Rio Rico Airbnb Market Analysis 2025: Short Term Rental Data & Vacation Rental Statistics in Arizona, United States
Is Airbnb profitable in Rio Rico in 2025? Explore comprehensive Airbnb analytics for Rio Rico, Arizona, United States to uncover income potential. This 2025 STR market report for Rio Rico, based on AirROI data from April 2024 to March 2025, reveals key trends in the niche market of 17 active listings.
Whether you're considering an Airbnb investment in Rio Rico, optimizing your existing vacation rental, or exploring rental arbitrage opportunities, understanding the Rio Rico Airbnb data is crucial. Leveraging the low regulation environment is key to maximizing your short term rental income potential. Let's dive into the specifics.
Key Rio Rico Airbnb Performance Metrics Overview
Monthly Airbnb Revenue Variations & Income Potential in Rio Rico (2025)
Understanding the monthly revenue variations for Airbnb listings in Rio Rico is key to maximizing your short term rental income potential. Seasonality significantly impacts earnings. Our analysis, based on data from the past 12 months, shows that the peak revenue month for STRs in Rio Rico is typically May, while August often presents the lowest earnings, highlighting opportunities for strategic pricing adjustments during shoulder and low seasons. Explore the typical Airbnb income in Rio Rico across different performance tiers:
- Best-in-class properties (Top 10%) achieve $4,604+ monthly, often utilizing dynamic pricing and superior guest experiences.
- Strong performing properties (Top 25%) earn $2,858 or more, indicating effective management and desirable locations/amenities.
- Typical properties (Median) generate around $1,420 per month, representing the average market performance.
- Entry-level properties (Bottom 25%) see earnings around $735, often with potential for optimization.
Average Monthly Airbnb Earnings Trend in Rio Rico
Rio Rico Airbnb Occupancy Rate Trends (2025)
Maximize your bookings by understanding the Rio Rico STR occupancy trends. Seasonal demand shifts significantly influence how often properties are booked. Typically, Maysees the highest demand (peak season occupancy), while September experiences the lowest (low season). Effective strategies, like adjusting minimum stays or offering promotions, can boost occupancy during slower periods. Here's how different property tiers perform in Rio Rico:
- Best-in-class properties (Top 10%) achieve 79%+ occupancy, indicating high desirability and potentially optimized availability.
- Strong performing properties (Top 25%) maintain 69% or higher occupancy, suggesting good market fit and guest satisfaction.
- Typical properties (Median) have an occupancy rate around 44%.
- Entry-level properties (Bottom 25%) average 20% occupancy, potentially facing higher vacancy.
Average Monthly Occupancy Rate Trend in Rio Rico
Average Daily Rate (ADR) Airbnb Trends in Rio Rico (2025)
Effective short term rental pricing strategy in Rio Rico involves understanding monthly ADR fluctuations. The Average Daily Rate (ADR) for Airbnb in Rio Rico typically peaks in October and dips lowest during November. Leveraging Airbnb dynamic pricing tools or strategies based on this seasonality can significantly boost revenue. Here's a look at the typical nightly rates achieved:
- Best-in-class properties (Top 10%) command rates of $219+ per night, often due to premium features or locations.
- Strong performing properties (Top 25%) achieve nightly rates of $163 or more.
- Typical properties (Median) charge around $99 per night.
- Entry-level properties (Bottom 25%) earn around $75 per night.
Average Daily Rate (ADR) Trend by Month in Rio Rico
Get Live Rio Rico Market Intelligence 👇

Explore Real-time Analytics
Airbnb Seasonality Analysis & Trends in Rio Rico (2025)
Peak Season (May, June, January)
- Revenue averages $2,612 per month
- Occupancy rates average 53.7%
- Daily rates average $140
Shoulder Season
- Revenue averages $2,070 per month
- Occupancy maintains around 47.1%
- Daily rates hold near $132
Low Season (July, August, September)
- Revenue drops to average $1,552 per month
- Occupancy decreases to average 33.2%
- Daily rates adjust to average $146
Seasonality Insights for Rio Rico
- The Airbnb seasonality in Rio Rico shows moderate seasonality with distinct peak and low periods. While the sections above show seasonal averages, it's also insightful to look at the extremes:
- During the high season, the absolute peak month showcases Rio Rico's highest earning potential, with monthly revenues capable of climbing to $2,741, occupancy reaching a high of 62.3%, and ADRs peaking at $149.
- Conversely, the slowest single month of the year, typically falling within the low season, marks the market's lowest point. In this month, revenue might dip to $1,338, occupancy could drop to 28.3%, and ADRs may adjust down to $121.
- Understanding both the seasonal averages and these monthly peaks and troughs in revenue, occupancy, and ADR is crucial for maximizing your Airbnb profit potential in Rio Rico.
Seasonal Strategies for Maximizing Profit
- Peak Season: Maximize revenue through premium pricing and potentially longer minimum stays. Ensure high availability.
- Low Season: Offer competitive pricing, special promotions (e.g., extended stay discounts), and flexible cancellation policies. Target off-season travelers like remote workers or budget-conscious guests.
- Shoulder Seasons: Implement dynamic pricing that balances peak and low rates. Target weekend travelers or specific events. Offer slightly more flexible terms than peak season.
- Regularly analyze your own performance against these Rio Rico seasonality benchmarks and adjust your pricing and availability strategy accordingly.
Best Areas for Airbnb Investment in Rio Rico (2025)
Exploring the top neighborhoods for short-term rentals in Rio Rico? This section highlights key areas, outlining why they are attractive for hosts and guests, along with notable local attractions. Consider these locations based on your target guest profile and investment strategy.
| Neighborhood / Area | Why Host Here? (Target Guests & Appeal) | Key Attractions & Landmarks |
|---|---|---|
| Rio Rico | A growing community with a mix of natural beauty and history, ideal for travelers seeking a quiet escape with opportunities for outdoor activities and exploring local culture. | 卡尔斯巴德温泉, 美丽的沙漠风景, Golf courses, Historic ruins, Fishing and boating on the Santa Cruz River |
| Tumacácori | Rich in history and culture, Tumacácori is known for its historic mission and beautiful scenery, attracting visitors interested in history and nature. | Tumacácori National Historical Park, Historic mission ruins, Santa Cruz River, Local arts and crafts, Scenic hiking trails |
| Nogales | Located on the border with Mexico, Nogales offers a unique cultural experience and attracts visitors interested in shopping, dining, and cross-border travel. | Mexican markets, Border town experiences, Local restaurants, Historic downtown, Music and cultural festivals |
| Patagonia | This small town is known for its artsy vibe and beautiful natural landscapes, popular among those who enjoy small-town charm and outdoor activities. | Patagonia Lake State Park, Art galleries, Local shops and cafes, Bird watching, Hiking trails |
| Green Valley | A popular retirement community with a relaxed lifestyle, Green Valley attracts visitors looking for peace, golf courses, and community activities. | Golf courses, Local markets, Community events, Seniors' activities, Scenic drives |
| Sahuarita | An upcoming suburb with family-friendly amenities, Sahuarita is ideal for family vacations and offers a range of recreational activities. | Parks and recreation areas, Local museums, Shopping centers, Hiking trails, Sahuarita Lake |
| Bisbee | A historic mining town turned artistic hub, Bisbee is known for its quirky vibe and attracts those interested in arts, history, and unique local experiences. | Historic downtown, Local art galleries, Copper Queen Mine, Live music venues, Cultural festivals |
| Tubac | Famous for its art community and historic sites, Tubac is a destination for artists and those looking to explore local culture and history. | Tubac Presidio State Historic Park, Art galleries, Local artisan shops, Scenic beauty of the Santa Cruz Valley, Cultural events |
Understanding Airbnb License Requirements & STR Laws in Rio Rico (2025)
While Rio Rico, Arizona, United States currently shows low STR regulations, specific Airbnb license requirements might still exist or change. Always verify the latest short term rental regulations and Airbnb license requirements directly with local government authorities for Rio Rico to ensure full compliance before hosting.
(Source: AirROI data, 2025, finding no licensed listings among those analyzed)
Top Performing Airbnb Properties in Rio Rico (2025)
Benchmark your potential! Explore examples of top-performing Airbnb properties in Rio Ricobased on Trailing Twelve Month (TTM) revenue. Analyze their characteristics, revenue, occupancy rate, and ADR to understand what drives success in this market.

Patagonia Lake Area | 3 BR | Mountains | Serenity
Entire Place • 3 bedrooms
Casa Agave
Entire Place • 4 bedrooms

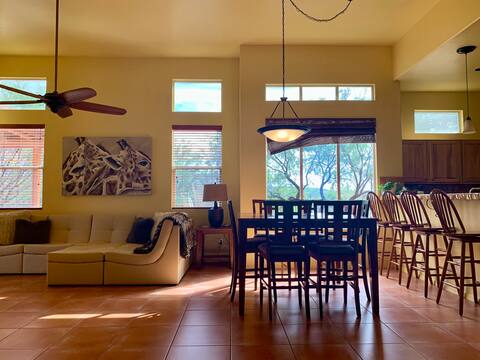
Charming Home with Stunning views!
Entire Place • 3 bedrooms
Casa Rio Rico
Entire Place • 4 bedrooms

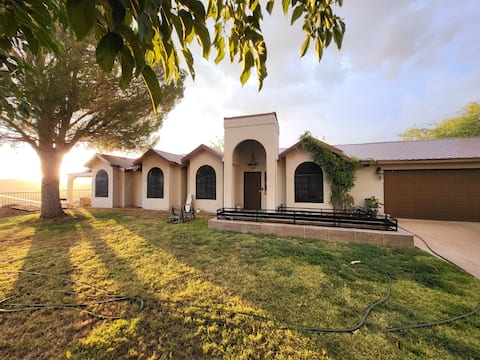
Newer Home. Stunning Views. Pets OK. EZ to I-19
Entire Place • 3 bedrooms

Cozy Rio Rico guesthouse with a view
Entire Place • N/A
Note: Performance varies based on location, size, amenities, seasonality, and management quality. Data reflects the past 12 months.
Top Performing Airbnb Hosts in Rio Rico (2025)
Learn from the best! This table showcases top-performing Airbnb hosts in Rio Rico based on the number of properties managed and estimated total revenue over the past year. Analyze their scale and performance metrics.
| Host Name | Properties | Grossing Revenue | Stay Reviews | Avg Rating |
|---|---|---|---|---|
| Todd | 1 | $63,350 | 66 | 4.91/5.0 |
| Lourdes & TJ | 1 | $59,055 | 61 | 4.84/5.0 |
| Andres | 1 | $33,539 | 42 | 4.88/5.0 |
| Fernando | 1 | $20,379 | 68 | 4.87/5.0 |
| Lillian | 1 | $17,359 | 26 | 5.00/5.0 |
| Karen | 1 | $15,944 | 338 | 4.87/5.0 |
| Maryann | 2 | $15,891 | 39 | 4.92/5.0 |
| Rosie | 1 | $15,517 | 46 | 4.98/5.0 |
| Brenda | 1 | $13,648 | 7 | 5.00/5.0 |
| Luanne | 1 | $10,378 | 123 | 4.89/5.0 |
Analyzing the strategies of top hosts, such as their property selection, pricing, and guest communication, can offer valuable lessons for optimizing your own Airbnb operations in Rio Rico.
Dive Deeper: Advanced Rio Rico STR Market Data (2025)
Ready to unlock more insights? AirROI provides access to advanced metrics and comprehensive Airbnb data for Rio Rico. Explore detailed analytics beyond this report to refine your investment strategy, optimize pricing, and maximize your vacation rental profits.
Explore Advanced MetricsRio Rico Short-Term Rental Market Composition (2025): Property & Room Types
Room Type Distribution
Property Type Distribution
Market Composition Insights for Rio Rico
- The Rio Rico Airbnb market composition is heavily skewed towards Entire Home/Apt listings, which make up 82.4% of the 17 active rentals. This indicates strong guest preference for privacy and space.
- Looking at the property type distribution in Rio Rico, House properties are the most common (52.9%), reflecting the local real estate landscape.
- Houses represent a significant 52.9% portion, catering likely to families or larger groups.
- The presence of 23.5% Hotel/Boutique listings indicates integration with traditional hospitality.
Rio Rico Airbnb Room Capacity Analysis (2025): Bedroom Distribution
Distribution of Listings by Number of Bedrooms
Room Capacity Insights for Rio Rico
- The dominant room capacity in Rio Rico is 1 bedroom listings, making up 35.3% of the market. This suggests a strong demand for properties suitable for couples or solo travelers.
- Together, 1 bedroom and 3 bedrooms properties represent 70.6% of the active Airbnb listings in Rio Rico, indicating a high concentration in these sizes.
- A significant 47.1% of listings offer 3+ bedrooms, catering to larger groups and families seeking more space in Rio Rico.
Rio Rico Vacation Rental Guest Capacity Trends (2025)
Distribution of Listings by Guest Capacity
Guest Capacity Insights for Rio Rico
- The most common guest capacity trend in Rio Rico vacation rentals is listings accommodating 4 guests (23.5%). This suggests the primary traveler segment is likely small families or groups.
- Properties designed for 4 guests and 6 guests dominate the Rio Rico STR market, accounting for 41.1% of listings.
- 47.0% of properties accommodate 6+ guests, serving the market segment for larger families or group travel in Rio Rico.
- On average, properties in Rio Rico are equipped to host 5.1 guests.
Rio Rico Airbnb Booking Patterns (2025): Available vs. Booked Days
Available Days Distribution
Booked Days Distribution
Booking Pattern Insights for Rio Rico
- The most common availability pattern in Rio Rico falls within the 271-366 days range, representing 35.3% of listings. This suggests many properties have significant open periods on their calendars.
- Approximately 70.6% of listings show high availability (181+ days open annually), indicating potential for increased bookings or specific owner usage patterns.
- For booked days, the 91-180 days range is most frequent in Rio Rico (41.2%), reflecting common guest stay durations or potential owner blocking patterns.
- A notable 29.4% of properties secure long booking periods (181+ days booked per year), highlighting successful long-term rental strategies or significant owner usage.
Rio Rico Airbnb Minimum Stay Requirements Analysis
Distribution of Listings by Minimum Night Requirement
1 Night
5 listings
31.3% of total
2 Nights
5 listings
31.3% of total
4-6 Nights
1 listings
6.3% of total
7-29 Nights
1 listings
6.3% of total
30+ Nights
4 listings
25% of total
Key Insights
- The most prevalent minimum stay requirement in Rio Rico is 1 Night, adopted by 31.3% of listings. This highlights the market's preference for shorter, flexible bookings.
- A strong majority (62.6%) of the Rio Rico Airbnb data shows acceptance of very short stays (1-2 nights), indicating a dynamic, high-turnover market.
- A significant segment (25%) caters to monthly stays (30+ nights) in Rio Rico, pointing to opportunities in the extended-stay market.
Recommendations
- Align with the market by considering a 1 Night minimum stay, as 31.3% of Rio Rico hosts use this setting.
- Explore offering discounts for stays of 30+ nights to attract the 25% of the market seeking extended stays.
- Adjust minimum nights based on seasonality – potentially shorter during low season and longer during peak demand periods in Rio Rico.
Rio Rico Airbnb Cancellation Policy Trends Analysis (2025)
Flexible
4 listings
30.8% of total
Moderate
2 listings
15.4% of total
Firm
4 listings
30.8% of total
Strict
3 listings
23.1% of total
Cancellation Policy Insights for Rio Rico
- The prevailing Airbnb cancellation policy trend in Rio Rico is Flexible, used by 30.8% of listings.
- A majority (53.9%) of hosts in Rio Rico utilize Firm or Strict policies, indicating a market where hosts prioritize booking security.
Recommendations for Hosts
- Consider adopting a Flexible policy to align with the 30.8% market standard in Rio Rico.
- Regularly review your cancellation policy against competitors and market demand shifts in Rio Rico.
Rio Rico STR Booking Lead Time Analysis (2025)
Average Booking Lead Time by Month
Booking Lead Time Insights for Rio Rico
- The overall average booking lead time for vacation rentals in Rio Rico is 56 days.
- Guests book furthest in advance for stays during February (average 93 days), likely coinciding with peak travel demand or local events.
- The shortest booking windows occur for stays in August (average 28 days), indicating more last-minute travel plans during this time.
- Seasonally, Winter (70 days avg.) sees the longest lead times, while Spring (48 days avg.) has the shortest, reflecting typical travel planning cycles.
Recommendations for Hosts
- Use the overall average lead time (56 days) as a baseline for your pricing and availability strategy in Rio Rico.
- For February stays, consider implementing length-of-stay discounts or slightly higher rates for bookings made less than 93 days out to capitalize on advance planning.
- Target marketing efforts for the Winter season well in advance (at least 70 days) to capture early planners.
- Monitor your own booking lead times against these Rio Rico averages to identify opportunities for dynamic pricing adjustments.
Popular & Essential Airbnb Amenities in Rio Rico (2025)
Amenity Prevalence
Amenity Insights for Rio Rico
- Essential amenities in Rio Rico that guests expect include: Wifi, Heating, TV, Hot water, Air conditioning. Lacking these (any) could significantly impact bookings.
- Popular amenities like Essentials, Free parking on premises, Kitchen are common but not universal. Offering these can provide a competitive edge.
Recommendations for Hosts
- Ensure your listing includes all essential amenities for Rio Rico: Wifi, Heating, TV, Hot water, Air conditioning.
- Consider adding popular differentiators like Essentials or Free parking on premises to increase appeal.
- Highlight unique or less common amenities you offer (e.g., hot tub, dedicated workspace, EV charger) in your listing description and photos.
- Regularly check competitor amenities in Rio Rico to stay competitive.
Rio Rico Airbnb Guest Demographics & Profile Analysis (2025)
Guest Profile Summary for Rio Rico
- The typical guest profile for Airbnb in Rio Rico consists of primarily domestic travelers (90%), often arriving from nearby Phoenix, typically belonging to the Post-2000s (Gen Z/Alpha) group (50%), primarily speaking English or Spanish.
- Domestic travelers account for 90.3% of guests.
- Key international markets include United States (90.3%) and Mexico (3.5%).
- Top languages spoken are English (64.2%) followed by Spanish (26.6%).
- A significant demographic segment is the Post-2000s (Gen Z/Alpha) group, representing 50% of guests.
Recommendations for Hosts
- Target domestic marketing efforts towards travelers from Phoenix and Tucson.
- Tailor amenities and listing descriptions to appeal to the dominant Post-2000s (Gen Z/Alpha) demographic (e.g., highlight fast WiFi, smart home features, local guides).
- Highlight unique local experiences or amenities relevant to the primary guest profile.
- Consider seasonal promotions aligned with peak travel times for key origin markets.
Nearby Short-Term Rental Market Comparison
How does the Rio Rico Airbnb market stack up against its neighbors? Compare key performance metrics like average monthly revenue, ADR, and occupancy rates in surrounding areas to understand the broader regional STR landscape.
| Market | Active Properties | Monthly Revenue | Daily Rate | Avg. Occupancy |
|---|---|---|---|---|
| Mount Lemmon | 40 | $3,401 | $240.92 | 49% |
| Oro Valley | 250 | $2,154 | $209.45 | 42% |
| Corona de Tucson | 17 | $2,149 | $164.80 | 49% |
| Sonoita | 36 | $2,088 | $185.95 | 37% |
| Marana | 107 | $2,075 | $195.52 | 42% |
| Casa Grande | 159 | $1,966 | $152.44 | 49% |
| Tucson | 3,600 | $1,946 | $165.63 | 46% |
| Sahuarita | 46 | $1,828 | $150.17 | 51% |
| Catalina | 27 | $1,798 | $181.37 | 42% |
| Elgin | 22 | $1,795 | $204.69 | 36% |