Dolan Springs Airbnb Market Analysis 2025: Short Term Rental Data & Vacation Rental Statistics in Arizona, United States
Is Airbnb profitable in Dolan Springs in 2025? Explore comprehensive Airbnb analytics for Dolan Springs, Arizona, United States to uncover income potential. This 2025 STR market report for Dolan Springs, based on AirROI data from April 2024 to March 2025, reveals key trends in the niche market of 18 active listings.
Whether you're considering an Airbnb investment in Dolan Springs, optimizing your existing vacation rental, or exploring rental arbitrage opportunities, understanding the Dolan Springs Airbnb data is crucial. Leveraging the low regulation environment is key to maximizing your short term rental income potential. Let's dive into the specifics.
Key Dolan Springs Airbnb Performance Metrics Overview
Monthly Airbnb Revenue Variations & Income Potential in Dolan Springs (2025)
Understanding the monthly revenue variations for Airbnb listings in Dolan Springs is key to maximizing your short term rental income potential. Seasonality significantly impacts earnings. Our analysis, based on data from the past 12 months, shows that the peak revenue month for STRs in Dolan Springs is typically May, while January often presents the lowest earnings, highlighting opportunities for strategic pricing adjustments during shoulder and low seasons. Explore the typical Airbnb income in Dolan Springs across different performance tiers:
- Best-in-class properties (Top 10%) achieve $2,428+ monthly, often utilizing dynamic pricing and superior guest experiences.
- Strong performing properties (Top 25%) earn $1,545 or more, indicating effective management and desirable locations/amenities.
- Typical properties (Median) generate around $1,042 per month, representing the average market performance.
- Entry-level properties (Bottom 25%) see earnings around $440, often with potential for optimization.
Average Monthly Airbnb Earnings Trend in Dolan Springs
Dolan Springs Airbnb Occupancy Rate Trends (2025)
Maximize your bookings by understanding the Dolan Springs STR occupancy trends. Seasonal demand shifts significantly influence how often properties are booked. Typically, Aprilsees the highest demand (peak season occupancy), while January experiences the lowest (low season). Effective strategies, like adjusting minimum stays or offering promotions, can boost occupancy during slower periods. Here's how different property tiers perform in Dolan Springs:
- Best-in-class properties (Top 10%) achieve 58%+ occupancy, indicating high desirability and potentially optimized availability.
- Strong performing properties (Top 25%) maintain 46% or higher occupancy, suggesting good market fit and guest satisfaction.
- Typical properties (Median) have an occupancy rate around 32%.
- Entry-level properties (Bottom 25%) average 17% occupancy, potentially facing higher vacancy.
Average Monthly Occupancy Rate Trend in Dolan Springs
Average Daily Rate (ADR) Airbnb Trends in Dolan Springs (2025)
Effective short term rental pricing strategy in Dolan Springs involves understanding monthly ADR fluctuations. The Average Daily Rate (ADR) for Airbnb in Dolan Springs typically peaks in November and dips lowest during July. Leveraging Airbnb dynamic pricing tools or strategies based on this seasonality can significantly boost revenue. Here's a look at the typical nightly rates achieved:
- Best-in-class properties (Top 10%) command rates of $161+ per night, often due to premium features or locations.
- Strong performing properties (Top 25%) achieve nightly rates of $119 or more.
- Typical properties (Median) charge around $91 per night.
- Entry-level properties (Bottom 25%) earn around $50 per night.
Average Daily Rate (ADR) Trend by Month in Dolan Springs
Get Live Dolan Springs Market Intelligence 👇

Explore Real-time Analytics
Airbnb Seasonality Analysis & Trends in Dolan Springs (2025)
Peak Season (May, April, June)
- Revenue averages $1,600 per month
- Occupancy rates average 37.5%
- Daily rates average $96
Shoulder Season
- Revenue averages $1,111 per month
- Occupancy maintains around 34.2%
- Daily rates hold near $97
Low Season (January, February, August)
- Revenue drops to average $861 per month
- Occupancy decreases to average 26.9%
- Daily rates adjust to average $97
Seasonality Insights for Dolan Springs
- The Airbnb seasonality in Dolan Springs shows highly seasonal trends requiring careful strategy. While the sections above show seasonal averages, it's also insightful to look at the extremes:
- During the high season, the absolute peak month showcases Dolan Springs's highest earning potential, with monthly revenues capable of climbing to $1,639, occupancy reaching a high of 41.8%, and ADRs peaking at $101.
- Conversely, the slowest single month of the year, typically falling within the low season, marks the market's lowest point. In this month, revenue might dip to $784, occupancy could drop to 20.9%, and ADRs may adjust down to $94.
- Understanding both the seasonal averages and these monthly peaks and troughs in revenue, occupancy, and ADR is crucial for maximizing your Airbnb profit potential in Dolan Springs.
Seasonal Strategies for Maximizing Profit
- Peak Season: Maximize revenue through premium pricing and potentially longer minimum stays. Ensure high availability.
- Low Season: Offer competitive pricing, special promotions (e.g., extended stay discounts), and flexible cancellation policies. Target off-season travelers like remote workers or budget-conscious guests.
- Shoulder Seasons: Implement dynamic pricing that balances peak and low rates. Target weekend travelers or specific events. Offer slightly more flexible terms than peak season.
- Regularly analyze your own performance against these Dolan Springs seasonality benchmarks and adjust your pricing and availability strategy accordingly.
Best Areas for Airbnb Investment in Dolan Springs (2025)
Exploring the top neighborhoods for short-term rentals in Dolan Springs? This section highlights key areas, outlining why they are attractive for hosts and guests, along with notable local attractions. Consider these locations based on your target guest profile and investment strategy.
| Neighborhood / Area | Why Host Here? (Target Guests & Appeal) | Key Attractions & Landmarks |
|---|---|---|
| Topock Marina | A picturesque area located on the border of Arizona and California, it attracts water enthusiasts and those looking for tranquil views of the Colorado River. | Topock Gorge, Pirate Cove Resort, Lake Havasu City, Havasu National Wildlife Refuge |
| Lake Havasu City | A hot vacation spot known for its stunning lake, beautiful beaches, and the famous London Bridge. It provides ample recreational activities and attracts both tourists and seasonal renters. | London Bridge, Lake Havasu State Park, Swarfega Beach, Lake Havasu Museum of History |
| Kingman | A historic Route 66 town offering a glimpse into America's past, Kingman is a lovely stop for road trippers and history lovers. | Route 66 Museum, Locomotive Park, Hualapai Mountain Park, Cerbat Foothills Recreation Area |
| Grand Canyon West | Close to the Grand Canyon, this area is ideal for adventurers and nature lovers looking for breathtaking views and outdoor activities. | Skywalk, Guano Point, Eagle Point, Grand Canyon West Rim |
| Bullhead City | A vibrant city on the banks of the Colorado River, it's popular for its casinos, boating, and water sports activities. | Laughlin Riverwalk, Bullhead City Community Park, Big Bend State Recreation Area |
| Oatman | A ghost town on Route 66 with wild burros roaming freely, Oatman offers a unique charm and draws tourists interested in history and unique experiences. | Old West Main Street, Oatman Ghost Town, Burro Crossover, Historic Oatman Hotel |
| Littlefield | An off-the-beaten-path location attracting nature lovers and those seeking a quiet retreat close to the Virgin River and nearby attractions. | Virgin River Gorge, Littlefield Historical Park |
| Dolan Springs | Known for its proximity to the Grand Canyon and outdoor recreational opportunities, it offers a peaceful setting for travelers looking to explore Arizona's natural beauty. | Grand Canyon Skywalk, Havasupai Falls, Hualapai Ranch |
Understanding Airbnb License Requirements & STR Laws in Dolan Springs (2025)
While Dolan Springs, Arizona, United States currently shows low STR regulations, specific Airbnb license requirements might still exist or change. Always verify the latest short term rental regulations and Airbnb license requirements directly with local government authorities for Dolan Springs to ensure full compliance before hosting.
(Source: AirROI data, 2025, finding no licensed listings among those analyzed)
Top Performing Airbnb Properties in Dolan Springs (2025)
Benchmark your potential! Explore examples of top-performing Airbnb properties in Dolan Springsbased on Trailing Twelve Month (TTM) revenue. Analyze their characteristics, revenue, occupancy rate, and ADR to understand what drives success in this market.
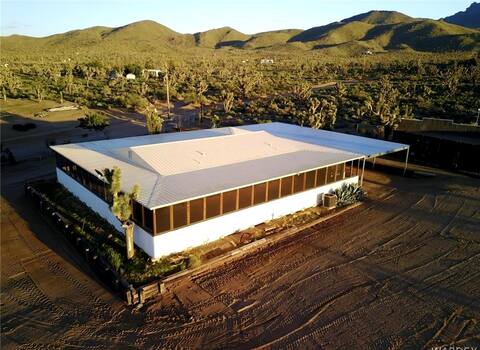
The Desert Owl
Entire Place • 3 bedrooms

The Broken Arrow Camper Arizona Joshua Tree Escape
Entire Place • 1 bedroom
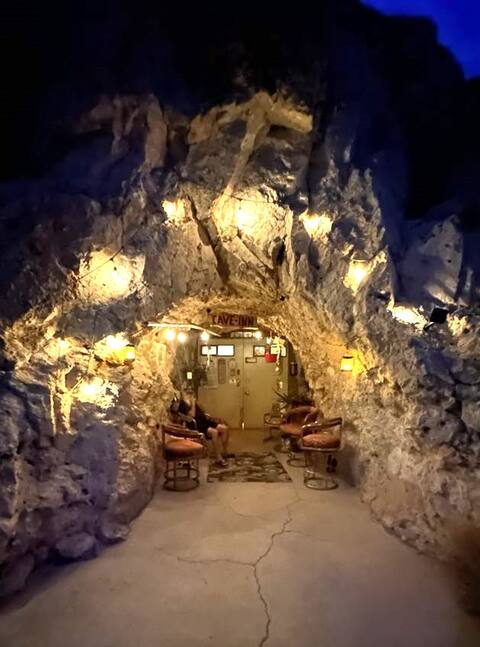
Taylor Mountain Cave Inn Retreat. Please read all!
Private Room • 2 bedrooms
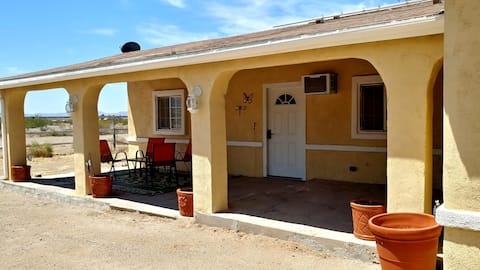
2 Bd Dolan Springs Grand Canyon Retreat
Entire Place • 2 bedrooms
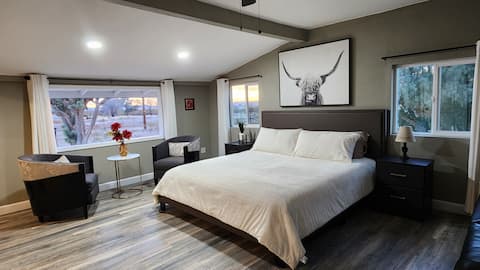
Desert Sanctuary
Entire Place • 2 bedrooms

1 Bdrm Grand Canyon Bridge Rental
Entire Place • 1 bedroom
Note: Performance varies based on location, size, amenities, seasonality, and management quality. Data reflects the past 12 months.
Top Performing Airbnb Hosts in Dolan Springs (2025)
Learn from the best! This table showcases top-performing Airbnb hosts in Dolan Springs based on the number of properties managed and estimated total revenue over the past year. Analyze their scale and performance metrics.
| Host Name | Properties | Grossing Revenue | Stay Reviews | Avg Rating |
|---|---|---|---|---|
| Robert | 3 | $46,427 | 412 | 4.79/5.0 |
| Lala | 1 | $30,299 | 39 | 5.00/5.0 |
| Gigi | 1 | $26,626 | 334 | 4.99/5.0 |
| Jeanette | 1 | $25,399 | 146 | 4.97/5.0 |
| Dusty | 1 | $18,735 | 138 | 4.64/5.0 |
| Kelly | 3 | $16,291 | 727 | 4.94/5.0 |
| Diego | 1 | $13,223 | 190 | 4.69/5.0 |
| Evolve | 1 | $11,906 | 4 | 4.50/5.0 |
| Sharon | 1 | $11,802 | 32 | 4.66/5.0 |
| Mary | 2 | $7,941 | 97 | 4.93/5.0 |
Analyzing the strategies of top hosts, such as their property selection, pricing, and guest communication, can offer valuable lessons for optimizing your own Airbnb operations in Dolan Springs.
Dive Deeper: Advanced Dolan Springs STR Market Data (2025)
Ready to unlock more insights? AirROI provides access to advanced metrics and comprehensive Airbnb data for Dolan Springs. Explore detailed analytics beyond this report to refine your investment strategy, optimize pricing, and maximize your vacation rental profits.
Explore Advanced MetricsDolan Springs Short-Term Rental Market Composition (2025): Property & Room Types
Room Type Distribution
Property Type Distribution
Market Composition Insights for Dolan Springs
- The Dolan Springs Airbnb market composition is heavily skewed towards Entire Home/Apt listings, which make up 77.8% of the 18 active rentals. This indicates strong guest preference for privacy and space.
- Looking at the property type distribution in Dolan Springs, House properties are the most common (77.8%), reflecting the local real estate landscape.
- Houses represent a significant 77.8% portion, catering likely to families or larger groups.
Dolan Springs Airbnb Room Capacity Analysis (2025): Bedroom Distribution
Distribution of Listings by Number of Bedrooms
Room Capacity Insights for Dolan Springs
- The dominant room capacity in Dolan Springs is 1 bedroom listings, making up 44.4% of the market. This suggests a strong demand for properties suitable for couples or solo travelers.
- Together, 1 bedroom and 2 bedrooms properties represent 66.6% of the active Airbnb listings in Dolan Springs, indicating a high concentration in these sizes.
Dolan Springs Vacation Rental Guest Capacity Trends (2025)
Distribution of Listings by Guest Capacity
Guest Capacity Insights for Dolan Springs
- The most common guest capacity trend in Dolan Springs vacation rentals is listings accommodating 4 guests (22.2%). This suggests the primary traveler segment is likely small families or groups.
- Properties designed for 4 guests and 5 guests dominate the Dolan Springs STR market, accounting for 38.9% of listings.
- 27.8% of properties accommodate 6+ guests, serving the market segment for larger families or group travel in Dolan Springs.
- On average, properties in Dolan Springs are equipped to host 4.1 guests.
Dolan Springs Airbnb Booking Patterns (2025): Available vs. Booked Days
Available Days Distribution
Booked Days Distribution
Booking Pattern Insights for Dolan Springs
- The most common availability pattern in Dolan Springs falls within the 181-270 days range, representing 61.1% of listings. This suggests many properties have significant open periods on their calendars.
- Approximately 94.4% of listings show high availability (181+ days open annually), indicating potential for increased bookings or specific owner usage patterns.
- For booked days, the 91-180 days range is most frequent in Dolan Springs (55.6%), reflecting common guest stay durations or potential owner blocking patterns.
- A notable 11.1% of properties secure long booking periods (181+ days booked per year), highlighting successful long-term rental strategies or significant owner usage.
Dolan Springs Airbnb Minimum Stay Requirements Analysis
Distribution of Listings by Minimum Night Requirement
1 Night
15 listings
88.2% of total
2 Nights
2 listings
11.8% of total
Key Insights
- The most prevalent minimum stay requirement in Dolan Springs is 1 Night, adopted by 88.2% of listings. This highlights the market's preference for shorter, flexible bookings.
- A strong majority (100.0%) of the Dolan Springs Airbnb data shows acceptance of very short stays (1-2 nights), indicating a dynamic, high-turnover market.
Recommendations
- Align with the market by considering a 1 Night minimum stay, as 88.2% of Dolan Springs hosts use this setting.
- Adjust minimum nights based on seasonality – potentially shorter during low season and longer during peak demand periods in Dolan Springs.
Dolan Springs Airbnb Cancellation Policy Trends Analysis (2025)
Flexible
8 listings
44.4% of total
Moderate
6 listings
33.3% of total
Firm
2 listings
11.1% of total
Strict
2 listings
11.1% of total
Cancellation Policy Insights for Dolan Springs
- The prevailing Airbnb cancellation policy trend in Dolan Springs is Flexible, used by 44.4% of listings.
- The market strongly favors guest-friendly terms, with 77.7% of listings offering Flexible or Moderate policies. This suggests guests in Dolan Springs may expect booking flexibility.
Recommendations for Hosts
- Consider adopting a Flexible policy to align with the 44.4% market standard in Dolan Springs.
- Using a Strict policy might deter some guests, as only 11.1% of listings use it. Evaluate if potential revenue protection outweighs possible lower booking rates.
- Regularly review your cancellation policy against competitors and market demand shifts in Dolan Springs.
Dolan Springs STR Booking Lead Time Analysis (2025)
Average Booking Lead Time by Month
Booking Lead Time Insights for Dolan Springs
- The overall average booking lead time for vacation rentals in Dolan Springs is 31 days.
- Guests book furthest in advance for stays during May (average 60 days), likely coinciding with peak travel demand or local events.
- The shortest booking windows occur for stays in February (average 19 days), indicating more last-minute travel plans during this time.
- Seasonally, Spring (37 days avg.) sees the longest lead times, while Winter (24 days avg.) has the shortest, reflecting typical travel planning cycles.
Recommendations for Hosts
- Use the overall average lead time (31 days) as a baseline for your pricing and availability strategy in Dolan Springs.
- For May stays, consider implementing length-of-stay discounts or slightly higher rates for bookings made less than 60 days out to capitalize on advance planning.
- Target marketing efforts for the Spring season well in advance (at least 37 days) to capture early planners.
- Monitor your own booking lead times against these Dolan Springs averages to identify opportunities for dynamic pricing adjustments.
Popular & Essential Airbnb Amenities in Dolan Springs (2025)
Amenity Prevalence
Amenity Insights for Dolan Springs
- Essential amenities in Dolan Springs that guests expect include: Wifi, Essentials, Dishes and silverware, Hot water, Refrigerator. Lacking these (any) could significantly impact bookings.
- Popular amenities like Air conditioning, Bed linens, Smoke alarm are common but not universal. Offering these can provide a competitive edge.
Recommendations for Hosts
- Ensure your listing includes all essential amenities for Dolan Springs: Wifi, Essentials, Dishes and silverware, Hot water, Refrigerator.
- Consider adding popular differentiators like Air conditioning or Bed linens to increase appeal.
- Highlight unique or less common amenities you offer (e.g., hot tub, dedicated workspace, EV charger) in your listing description and photos.
- Regularly check competitor amenities in Dolan Springs to stay competitive.
Dolan Springs Airbnb Guest Demographics & Profile Analysis (2025)
Guest Profile Summary for Dolan Springs
- The typical guest profile for Airbnb in Dolan Springs consists of primarily domestic travelers (80%), often arriving from nearby Las Vegas, typically belonging to the Post-2000s (Gen Z/Alpha) group (50%), primarily speaking English or Spanish.
- Domestic travelers account for 79.5% of guests.
- Key international markets include United States (79.5%) and Canada (4.6%).
- Top languages spoken are English (60%) followed by Spanish (13.3%).
- A significant demographic segment is the Post-2000s (Gen Z/Alpha) group, representing 50% of guests.
Recommendations for Hosts
- Target domestic marketing efforts towards travelers from Las Vegas and New York.
- Tailor amenities and listing descriptions to appeal to the dominant Post-2000s (Gen Z/Alpha) demographic (e.g., highlight fast WiFi, smart home features, local guides).
- Highlight unique local experiences or amenities relevant to the primary guest profile.
- Consider seasonal promotions aligned with peak travel times for key origin markets.
Nearby Short-Term Rental Market Comparison
How does the Dolan Springs Airbnb market stack up against its neighbors? Compare key performance metrics like average monthly revenue, ADR, and occupancy rates in surrounding areas to understand the broader regional STR landscape.
| Market | Active Properties | Monthly Revenue | Daily Rate | Avg. Occupancy |
|---|---|---|---|---|
| Henderson | 558 | $3,505 | $264.72 | 47% |
| Parker Strip | 113 | $3,183 | $356.40 | 33% |
| Mesquite | 115 | $3,149 | $218.89 | 49% |
| North Las Vegas | 1,303 | $2,984 | $239.88 | 48% |
| Spring Valley | 1,639 | $2,977 | $263.03 | 46% |
| Paradise | 3,730 | $2,963 | $282.62 | 44% |
| Sunrise Manor | 267 | $2,392 | $198.09 | 44% |
| Summerlin South | 47 | $2,386 | $208.17 | 46% |
| Las Vegas | 2,312 | $2,359 | $226.61 | 42% |
| Needles | 27 | $2,302 | $225.96 | 35% |