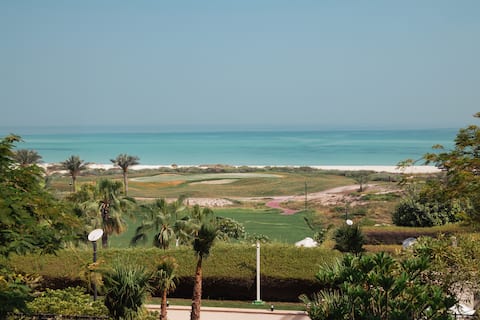
Abu Dhabi Airbnb Market Analysis 2026: Short Term Rental Data & Vacation Rental Statistics in Abu Dhabi Emirate, United Arab Emirates
Is Airbnb profitable in Abu Dhabi in 2026? Explore comprehensive Airbnb analytics for Abu Dhabi, Abu Dhabi Emirate, United Arab Emirates to uncover income potential. This 2026 STR market report for Abu Dhabi, based on AirROI data from February 2025 to January 2026, reveals key trends in the bustling market of 1,083 active listings.
Whether you're considering an Airbnb investment in Abu Dhabi, optimizing your existing vacation rental, or exploring rental arbitrage opportunities, understanding the Abu Dhabi Airbnb data is crucial. Understanding the local regulations is key to maximizing your short term rental income potential. Let's dive into the specifics.
Key Abu Dhabi Airbnb Performance Metrics Overview
Monthly Airbnb Revenue Variations & Income Potential in Abu Dhabi (2026)
Understanding the monthly revenue variations for Airbnb listings in Abu Dhabi is key to maximizing your short term rental income potential. Seasonality significantly impacts earnings. Our analysis, based on data from the past 12 months, shows that the peak revenue month for STRs in Abu Dhabi is typically December, while August often presents the lowest earnings, highlighting opportunities for strategic pricing adjustments during shoulder and low seasons. Explore the typical Airbnb income in Abu Dhabi across different performance tiers:
- Best-in-class properties (Top 10%) achieve $5,810+ monthly, often utilizing dynamic pricing and superior guest experiences.
- Strong performing properties (Top 25%) earn $3,770 or more, indicating effective management and desirable locations/amenities.
- Typical properties (Median) generate around $1,983 per month, representing the average market performance.
- Entry-level properties (Bottom 25%) see earnings around $853, often with potential for optimization.
Average Monthly Airbnb Earnings Trend in Abu Dhabi
Abu Dhabi Airbnb Occupancy Rate Trends (2026)
Maximize your bookings by understanding the Abu Dhabi STR occupancy trends. Seasonal demand shifts significantly influence how often properties are booked. Typically, Februarysees the highest demand (peak season occupancy), while January experiences the lowest (low season). Effective strategies, like adjusting minimum stays or offering promotions, can boost occupancy during slower periods. Here's how different property tiers perform in Abu Dhabi:
- Best-in-class properties (Top 10%) achieve 82%+ occupancy, indicating high desirability and potentially optimized availability.
- Strong performing properties (Top 25%) maintain 65% or higher occupancy, suggesting good market fit and guest satisfaction.
- Typical properties (Median) have an occupancy rate around 39%.
- Entry-level properties (Bottom 25%) average 19% occupancy, potentially facing higher vacancy.
Average Monthly Occupancy Rate Trend in Abu Dhabi
Average Daily Rate (ADR) Airbnb Trends in Abu Dhabi (2026)
Effective short term rental pricing strategy in Abu Dhabi involves understanding monthly ADR fluctuations. The Average Daily Rate (ADR) for Airbnb in Abu Dhabi typically peaks in December and dips lowest during August. Leveraging Airbnb dynamic pricing tools or strategies based on this seasonality can significantly boost revenue. Here's a look at the typical nightly rates achieved:
- Best-in-class properties (Top 10%) command rates of $350+ per night, often due to premium features or locations.
- Strong performing properties (Top 25%) achieve nightly rates of $234 or more.
- Typical properties (Median) charge around $159 per night.
- Entry-level properties (Bottom 25%) earn around $98 per night.
Average Daily Rate (ADR) Trend by Month in Abu Dhabi
Get Live Abu Dhabi Market Intelligence 👇

Explore Real-time Analytics
Airbnb Seasonality Analysis & Trends in Abu Dhabi (2026)
Peak Season (December, November, October)
- Revenue averages $3,677 per month
- Occupancy rates average 44.1%
- Daily rates average $270
Shoulder Season
- Revenue averages $2,573 per month
- Occupancy maintains around 44.0%
- Daily rates hold near $183
Low Season (June, July, August)
- Revenue drops to average $1,965 per month
- Occupancy decreases to average 39.0%
- Daily rates adjust to average $155
Seasonality Insights for Abu Dhabi
- The Airbnb seasonality in Abu Dhabi shows highly seasonal trends requiring careful strategy. While the sections above show seasonal averages, it's also insightful to look at the extremes:
- During the high season, the absolute peak month showcases Abu Dhabi's highest earning potential, with monthly revenues capable of climbing to $4,188, occupancy reaching a high of 57.6%, and ADRs peaking at $302.
- Conversely, the slowest single month of the year, typically falling within the low season, marks the market's lowest point. In this month, revenue might dip to $1,888, occupancy could drop to 34.9%, and ADRs may adjust down to $152.
- Understanding both the seasonal averages and these monthly peaks and troughs in revenue, occupancy, and ADR is crucial for maximizing your Airbnb profit potential in Abu Dhabi.
Seasonal Strategies for Maximizing Profit
- Peak Season: Maximize revenue through premium pricing and potentially longer minimum stays. Ensure high availability.
- Low Season: Offer competitive pricing, special promotions (e.g., extended stay discounts), and flexible cancellation policies. Target off-season travelers like remote workers or budget-conscious guests.
- Shoulder Seasons: Implement dynamic pricing that balances peak and low rates. Target weekend travelers or specific events. Offer slightly more flexible terms than peak season.
- Regularly analyze your own performance against these Abu Dhabi seasonality benchmarks and adjust your pricing and availability strategy accordingly.
Best Areas for Airbnb Investment in Abu Dhabi (2026)
Exploring the top neighborhoods for short-term rentals in Abu Dhabi? This section highlights key areas, outlining why they are attractive for hosts and guests, along with notable local attractions. Consider these locations based on your target guest profile and investment strategy.
| Neighborhood / Area | Why Host Here? (Target Guests & Appeal) | Key Attractions & Landmarks |
|---|---|---|
| Corniche | A scenic waterfront area that offers beautiful views, parks, and beaches. It is popular among tourists and locals alike, making it ideal for short-term rentals. | Corniche Beach, Heritage Village, UAE Pavilion, Abu Dhabi Breakwater, Marina Mall |
| Yas Island | Home to major attractions like Yas Waterworld, Ferrari World, and Yas Marina Circuit. It draws thrill-seekers and families, perfect for Airbnb hosts. | Yas Waterworld, Ferrari World Abu Dhabi, Yas Marina Circuit, Warner Bros. World Abu Dhabi, Yas Mall |
| Saadiyat Island | Known for its cultural institutions and stunning beaches. A luxurious destination appealing to affluent travelers and art enthusiasts. | Louvre Abu Dhabi, Saadiyat Beach Club, Manarat Al Saadiyat, New York University Abu Dhabi, Saadiyat Cultural District |
| Al Ain | A region rich in history and culture, making it popular for visitors interested in heritage tourism. A more laid-back option compared to the city. | Al Ain Oasis, Al Jahili Fort, Sheikh Zayed Palace Museum, Al Ain Zoo, Jebel Hafeet |
| Downtown Abu Dhabi | The bustling heart of the city, with a mix of modernity and tradition. Great for urban travelers seeking convenience and accessibility to major attractions. | Abu Dhabi Mall, The Galleria, Sheikh Zayed Grand Mosque, Qasr Al Watan, Emirates Palace |
| Madinat Zayed | A mixed-use area that offers shopping and entertainment options, attracting both tourists and locals. Good for Airbnbs targeting budget travelers. | Western Region Museum, Al Dhafra Dates Festival, Madinat Zayed Shopping Center |
| Al Reem Island | A vibrant community with modern residential developments and proximity to the city center. Ideal for hosting young professionals and expatriates. | Reem Central Park, Sorbonne University Abu Dhabi, Galleria Mall, Al Reem Mall |
| Liwa Oasis | Famous for its stunning desert landscapes and palm groves, it attracts eco-tourists and those looking for adventure and tranquility in nature. | Liwa Oasis, Rub' al Khali (Empty Quarter), Fort Liwa, Camel trekking, Desert safaris |
Understanding Airbnb License Requirements & STR Laws in Abu Dhabi (2026)
With 11% of listings showing registration in 2026, understanding potential Airbnb license requirements is crucial in Abu Dhabi. Always verify the latest short term rental regulations and Airbnb license requirements directly with local government authorities for Abu Dhabi to ensure full compliance before hosting.
(Source: AirROI data, 2026, based on 11% licensed listings)
Top Performing Airbnb Properties in Abu Dhabi (2026)
Benchmark your potential! Explore examples of top-performing Airbnb properties in Abu Dhabibased on Trailing Twelve Month (TTM) revenue. Analyze their characteristics, revenue, occupancy rate, and ADR to understand what drives success in this market.
L'Escapade @St Regis Saadiyat
Entire Place • 2 bedrooms

The little palace - 120 inch screen
Entire Place • 3 bedrooms

Yas Island 4BR Near Ferrari World and Yas Mall
Entire Place • 4 bedrooms

Arabian style villa, swimming pool & play room
Entire Place • 5 bedrooms

Silkhaus Lavish 3BR+ Maid | Yas Island
Entire Place • 4 bedrooms

1-Bed Loft with Pool View, Steps from the Beach
Entire Place • 1 bedroom
Note: Performance varies based on location, size, amenities, seasonality, and management quality. Data reflects the past 12 months.
Top Performing Airbnb Hosts in Abu Dhabi (2026)
Learn from the best! This table showcases top-performing Airbnb hosts in Abu Dhabi based on the number of properties managed and estimated total revenue over the past year. Analyze their scale and performance metrics.
| Host Name | Properties | Grossing Revenue | Stay Reviews | Avg Rating |
|---|---|---|---|---|
| Royal Holiday | 145 | $3,374,821 | 1722 | 4.60/5.0 |
| Paul | 55 | $2,222,423 | 951 | 4.66/5.0 |
| Bloomfields | 123 | $1,405,137 | 493 | 3.93/5.0 |
| Esperanza | 23 | $861,193 | 2011 | 4.64/5.0 |
| Sustainable | 33 | $789,594 | 446 | 4.60/5.0 |
| Martina | 32 | $767,444 | 528 | 4.56/5.0 |
| Saeed | 26 | $670,557 | 345 | 4.64/5.0 |
| Voyage Vacation Home Rental LL | 27 | $639,603 | 319 | 4.39/5.0 |
| Mabz | 16 | $554,079 | 644 | 4.68/5.0 |
| Paul | 8 | $404,446 | 153 | 4.64/5.0 |
Analyzing the strategies of top hosts, such as their property selection, pricing, and guest communication, can offer valuable lessons for optimizing your own Airbnb operations in Abu Dhabi.
Dive Deeper: Advanced Abu Dhabi STR Market Data (2026)
Ready to unlock more insights? AirROI provides access to advanced metrics and comprehensive Airbnb data for Abu Dhabi. Explore detailed analytics beyond this report to refine your investment strategy, optimize pricing, and maximize your vacation rental profits.
Explore Advanced MetricsAbu Dhabi Short-Term Rental Market Composition (2026): Property & Room Types
Room Type Distribution
Property Type Distribution
Market Composition Insights for Abu Dhabi
- The Abu Dhabi Airbnb market composition is heavily skewed towards Entire Home/Apt listings, which make up 87.4% of the 1,083 active rentals. This indicates strong guest preference for privacy and space.
- Looking at the property type distribution in Abu Dhabi, Apartment/Condo properties are the most common (91.6%), reflecting the local real estate landscape.
- Smaller segments like hotel/boutique, others, outdoor/unique (combined 2.4%) offer potential for unique stay experiences.
Abu Dhabi Airbnb Room Capacity Analysis (2026): Bedroom Distribution
Distribution of Listings by Number of Bedrooms
Room Capacity Insights for Abu Dhabi
- The dominant room capacity in Abu Dhabi is 1 bedroom listings, making up 49.7% of the market. This suggests a strong demand for properties suitable for couples or solo travelers.
- Together, 1 bedroom and 2 bedrooms properties represent 70.9% of the active Airbnb listings in Abu Dhabi, indicating a high concentration in these sizes.
- Listings with 3+ bedrooms (7.1%) represent a smaller niche, potentially indicating an underserved market for larger group accommodations in Abu Dhabi.
Abu Dhabi Vacation Rental Guest Capacity Trends (2026)
Distribution of Listings by Guest Capacity
Guest Capacity Insights for Abu Dhabi
- The most common guest capacity trend in Abu Dhabi vacation rentals is listings accommodating 2 guests (33.8%). This suggests the primary traveler segment is likely couples or solo travelers.
- Properties designed for 2 guests and 4 guests dominate the Abu Dhabi STR market, accounting for 51.8% of listings.
- 12.1% of properties accommodate 6+ guests, serving the market segment for larger families or group travel in Abu Dhabi.
- On average, properties in Abu Dhabi are equipped to host 3.1 guests.
Abu Dhabi Airbnb Booking Patterns (2026): Available vs. Booked Days
Available Days Distribution
Booked Days Distribution
Booking Pattern Insights for Abu Dhabi
- The most common availability pattern in Abu Dhabi falls within the 271-366 days range, representing 57.2% of listings. This suggests many properties have significant open periods on their calendars.
- Approximately 85.7% of listings show high availability (181+ days open annually), indicating potential for increased bookings or specific owner usage patterns.
- For booked days, the 31-90 days range is most frequent in Abu Dhabi (31.6%), reflecting common guest stay durations or potential owner blocking patterns.
- A notable 15.1% of properties secure long booking periods (181+ days booked per year), highlighting successful long-term rental strategies or significant owner usage.
Abu Dhabi Airbnb Minimum Stay Requirements Analysis
Distribution of Listings by Minimum Night Requirement
1 Night
368 listings
34% of total
2 Nights
101 listings
9.3% of total
3 Nights
27 listings
2.5% of total
4-6 Nights
29 listings
2.7% of total
7-29 Nights
44 listings
4.1% of total
30+ Nights
514 listings
47.5% of total
Key Insights
- The most prevalent minimum stay requirement in Abu Dhabi is 30+ Nights, adopted by 47.5% of listings. This highlights the market's preference for longer commitments.
- A significant segment (47.5%) caters to monthly stays (30+ nights) in Abu Dhabi, pointing to opportunities in the extended-stay market.
Recommendations
- Align with the market by considering a 30+ Nights minimum stay, as 47.5% of Abu Dhabi hosts use this setting.
- Explore offering discounts for stays of 30+ nights to attract the 47.5% of the market seeking extended stays.
- Adjust minimum nights based on seasonality – potentially shorter during low season and longer during peak demand periods in Abu Dhabi.
Abu Dhabi Airbnb Cancellation Policy Trends Analysis (2026)
Super Strict 30 Days
11 listings
1% of total
Super Strict 60 Days
21 listings
2% of total
Limited
11 listings
1% of total
Flexible
390 listings
36.3% of total
Moderate
384 listings
35.8% of total
Firm
150 listings
14% of total
Strict
106 listings
9.9% of total
Cancellation Policy Insights for Abu Dhabi
- The prevailing Airbnb cancellation policy trend in Abu Dhabi is Flexible, used by 36.3% of listings.
- The market strongly favors guest-friendly terms, with 72.1% of listings offering Flexible or Moderate policies. This suggests guests in Abu Dhabi may expect booking flexibility.
- Strict cancellation policies are quite rare (9.9%), potentially making listings with this policy less competitive unless justified by high demand or property type.
Recommendations for Hosts
- Consider adopting a Flexible policy to align with the 36.3% market standard in Abu Dhabi.
- Using a Strict policy might deter some guests, as only 9.9% of listings use it. Evaluate if potential revenue protection outweighs possible lower booking rates.
- Regularly review your cancellation policy against competitors and market demand shifts in Abu Dhabi.
Abu Dhabi STR Booking Lead Time Analysis (2026)
Average Booking Lead Time by Month
Booking Lead Time Insights for Abu Dhabi
- The overall average booking lead time for vacation rentals in Abu Dhabi is 28 days.
- Guests book furthest in advance for stays during December (average 46 days), likely coinciding with peak travel demand or local events.
- The shortest booking windows occur for stays in July (average 14 days), indicating more last-minute travel plans during this time.
- Seasonally, Winter (34 days avg.) sees the longest lead times, while Summer (17 days avg.) has the shortest, reflecting typical travel planning cycles.
Recommendations for Hosts
- Use the overall average lead time (28 days) as a baseline for your pricing and availability strategy in Abu Dhabi.
- For December stays, consider implementing length-of-stay discounts or slightly higher rates for bookings made less than 46 days out to capitalize on advance planning.
- During July, focus on last-minute booking availability and promotions, as guests book with very short notice (14 days avg.).
- Target marketing efforts for the Winter season well in advance (at least 34 days) to capture early planners.
- Monitor your own booking lead times against these Abu Dhabi averages to identify opportunities for dynamic pricing adjustments.
Popular & Essential Airbnb Amenities in Abu Dhabi (2026)
Amenity Prevalence
Amenity Insights for Abu Dhabi
- Essential amenities in Abu Dhabi that guests expect include: Air conditioning, Wifi, Kitchen. Lacking these (any) could significantly impact bookings.
- Popular amenities like Washer, TV, Smoke alarm are common but not universal. Offering these can provide a competitive edge.
Recommendations for Hosts
- Ensure your listing includes all essential amenities for Abu Dhabi: Air conditioning, Wifi, Kitchen.
- Prioritize adding missing essentials: Air conditioning, Wifi, Kitchen.
- Consider adding popular differentiators like Washer or TV to increase appeal.
- Highlight unique or less common amenities you offer (e.g., hot tub, dedicated workspace, EV charger) in your listing description and photos.
- Regularly check competitor amenities in Abu Dhabi to stay competitive.
Abu Dhabi Airbnb Guest Demographics & Profile Analysis (2026)
Guest Profile Summary for Abu Dhabi
- The typical guest profile for Airbnb in Abu Dhabi consists of predominantly international visitors (79%), with top international origins including United Kingdom, typically belonging to the Post-2000s (Gen Z/Alpha) group (50%), primarily speaking English or Arabic.
- Domestic travelers account for 20.7% of guests.
- Key international markets include United Arab Emirates (20.7%) and United Kingdom (11.9%).
- Top languages spoken are English (45.3%) followed by Arabic (12%).
- A significant demographic segment is the Post-2000s (Gen Z/Alpha) group, representing 50% of guests.
Recommendations for Hosts
- Focus marketing internationally, particularly towards travelers from United Kingdom.
- Tailor amenities and listing descriptions to appeal to the dominant Post-2000s (Gen Z/Alpha) demographic (e.g., highlight fast WiFi, smart home features, local guides).
- Highlight unique local experiences or amenities relevant to the primary guest profile.
- Consider seasonal promotions aligned with peak travel times for key origin markets.
Nearby Short-Term Rental Market Comparison
How does the Abu Dhabi Airbnb market stack up against its neighbors? Compare key performance metrics like average monthly revenue, ADR, and occupancy rates in surrounding areas to understand the broader regional STR landscape.
| Market | Active Properties | Monthly Revenue | Daily Rate | Avg. Occupancy |
|---|---|---|---|---|
| Emaar Beachfront | 65 | $3,507 | $369.68 | 44% |
| Dubai Marina | 32 | $2,348 | $225.47 | 46% |
| Mina Al arab | 25 | $2,271 | $442.53 | 25% |
| Business Bay | 1,210 | $2,269 | $251.35 | 47% |
| Dubai | 15,275 | $2,221 | $258.80 | 44% |
| دبي | 588 | $1,948 | $230.79 | 45% |
| Ras Al Khaimah | 37 | $1,577 | $222.23 | 30% |
| Ras Al-Khaimah | 34 | $1,509 | $226.14 | 28% |
| Ras al Khaimah | 16 | $1,262 | $196.69 | 26% |
| Jazeerat Al Marjan | 44 | $1,125 | $142.86 | 38% |