Kartepe Airbnb Market Analysis 2026: Short Term Rental Data & Vacation Rental Statistics in Kocaeli, Turkey
Is Airbnb profitable in Kartepe in 2026? Explore comprehensive Airbnb analytics for Kartepe, Kocaeli, Turkey to uncover income potential. This 2026 STR market report for Kartepe, based on AirROI data from February 2025 to January 2026, reveals key trends in the niche market of 153 active listings.
Whether you're considering an Airbnb investment in Kartepe, optimizing your existing vacation rental, or exploring rental arbitrage opportunities, understanding the Kartepe Airbnb data is crucial. Navigating the high regulation landscape is key to maximizing your short term rental income potential. Let's dive into the specifics.
Key Kartepe Airbnb Performance Metrics Overview
Monthly Airbnb Revenue Variations & Income Potential in Kartepe (2026)
Understanding the monthly revenue variations for Airbnb listings in Kartepe is key to maximizing your short term rental income potential. Seasonality significantly impacts earnings. Our analysis, based on data from the past 12 months, shows that the peak revenue month for STRs in Kartepe is typically August, while March often presents the lowest earnings, highlighting opportunities for strategic pricing adjustments during shoulder and low seasons. Explore the typical Airbnb income in Kartepe across different performance tiers:
- Best-in-class properties (Top 10%) achieve $4,304+ monthly, often utilizing dynamic pricing and superior guest experiences.
- Strong performing properties (Top 25%) earn $2,486 or more, indicating effective management and desirable locations/amenities.
- Typical properties (Median) generate around $1,245 per month, representing the average market performance.
- Entry-level properties (Bottom 25%) see earnings around $586, often with potential for optimization.
Average Monthly Airbnb Earnings Trend in Kartepe
Kartepe Airbnb Occupancy Rate Trends (2026)
Maximize your bookings by understanding the Kartepe STR occupancy trends. Seasonal demand shifts significantly influence how often properties are booked. Typically, Augustsees the highest demand (peak season occupancy), while March experiences the lowest (low season). Effective strategies, like adjusting minimum stays or offering promotions, can boost occupancy during slower periods. Here's how different property tiers perform in Kartepe:
- Best-in-class properties (Top 10%) achieve 56%+ occupancy, indicating high desirability and potentially optimized availability.
- Strong performing properties (Top 25%) maintain 40% or higher occupancy, suggesting good market fit and guest satisfaction.
- Typical properties (Median) have an occupancy rate around 22%.
- Entry-level properties (Bottom 25%) average 10% occupancy, potentially facing higher vacancy.
Average Monthly Occupancy Rate Trend in Kartepe
Average Daily Rate (ADR) Airbnb Trends in Kartepe (2026)
Effective short term rental pricing strategy in Kartepe involves understanding monthly ADR fluctuations. The Average Daily Rate (ADR) for Airbnb in Kartepe typically peaks in June and dips lowest during January. Leveraging Airbnb dynamic pricing tools or strategies based on this seasonality can significantly boost revenue. Here's a look at the typical nightly rates achieved:
- Best-in-class properties (Top 10%) command rates of $357+ per night, often due to premium features or locations.
- Strong performing properties (Top 25%) achieve nightly rates of $257 or more.
- Typical properties (Median) charge around $179 per night.
- Entry-level properties (Bottom 25%) earn around $119 per night.
Average Daily Rate (ADR) Trend by Month in Kartepe
Get Live Kartepe Market Intelligence 👇

Explore Real-time Analytics
Airbnb Seasonality Analysis & Trends in Kartepe (2026)
Peak Season (August, July, June)
- Revenue averages $2,914 per month
- Occupancy rates average 34.9%
- Daily rates average $228
Shoulder Season
- Revenue averages $1,813 per month
- Occupancy maintains around 26.2%
- Daily rates hold near $202
Low Season (March, May, October)
- Revenue drops to average $1,424 per month
- Occupancy decreases to average 20.8%
- Daily rates adjust to average $205
Seasonality Insights for Kartepe
- The Airbnb seasonality in Kartepe shows highly seasonal trends requiring careful strategy. While the sections above show seasonal averages, it's also insightful to look at the extremes:
- During the high season, the absolute peak month showcases Kartepe's highest earning potential, with monthly revenues capable of climbing to $3,529, occupancy reaching a high of 43.1%, and ADRs peaking at $228.
- Conversely, the slowest single month of the year, typically falling within the low season, marks the market's lowest point. In this month, revenue might dip to $1,389, occupancy could drop to 19.1%, and ADRs may adjust down to $197.
- Understanding both the seasonal averages and these monthly peaks and troughs in revenue, occupancy, and ADR is crucial for maximizing your Airbnb profit potential in Kartepe.
Seasonal Strategies for Maximizing Profit
- Peak Season: Maximize revenue through premium pricing and potentially longer minimum stays. Ensure high availability.
- Low Season: Offer competitive pricing, special promotions (e.g., extended stay discounts), and flexible cancellation policies. Target off-season travelers like remote workers or budget-conscious guests.
- Shoulder Seasons: Implement dynamic pricing that balances peak and low rates. Target weekend travelers or specific events. Offer slightly more flexible terms than peak season.
- Regularly analyze your own performance against these Kartepe seasonality benchmarks and adjust your pricing and availability strategy accordingly.
Best Areas for Airbnb Investment in Kartepe (2026)
Exploring the top neighborhoods for short-term rentals in Kartepe? This section highlights key areas, outlining why they are attractive for hosts and guests, along with notable local attractions. Consider these locations based on your target guest profile and investment strategy.
| Neighborhood / Area | Why Host Here? (Target Guests & Appeal) | Key Attractions & Landmarks |
|---|---|---|
| Maşukiye | A picturesque village known for its nature, fresh air, and outdoor activities. Perfect for visitors seeking tranquility and natural beauty, with access to hiking, waterfalls, and restaurants offering local cuisine. | Maşukiye Nature Park, Kartepe Ski Resort, Sapanca Lake, Sakarya River, Hiking trails |
| Kartepe Ski Resort | Popular winter destination in Turkey with ski slopes and resorts. Ideal for winter sports enthusiasts and travelers looking to experience snow and winter activities. | Kartepe Ski Resort, Ski slopes, Winter sports activities, Luxury lodges, Winter festivals |
| Sapanca | A charming lakeside town ideal for nature lovers. Attracts tourists for its scenic lake, outdoor activities, and peaceful retreats, making it a desirable Airbnb location. | Sapanca Lake, Nature Walking Trails, Picnic Areas, Historic Village, Outdoor Cafes |
| Kartepe Plateau | Known for its breathtaking views and serenity, perfect for weekend getaways. Visitors can enjoy the lush landscape, clean air, and various activities like hiking and cycling. | Plateau Views, Hiking and Biking Trails, Nature Retreats, Camping Spots, Photography Opportunities |
| Kocaeli City Center | The bustling heart of Kocaeli offers a mix of culture, dining, and entertainment. It's ideal for those seeking urban experiences, shopping, and local attractions. | Kocaeli Museum, Shopping Malls, Local Restaurants, Cultural Events, Kocaeli Park |
| Darıca Zoo and Botanical Garden | A great family-friendly destination with beautiful gardens and a zoo. Suitable for travelers with children looking for recreational activities. | Darıca Zoo, Botanical Gardens, Family Picnic Areas, Playgrounds, Animal Shows |
| Hereke | Known for its historic carpets and beautiful waterfront views. Attracts those interested in local crafts and relaxation by the sea. | Hereke Carpet Museum, Mediterranean Coast, Local Crafts Shops, Scenic Walks, Cafes by the waterfront |
| Çayırbaşı | A quaint neighborhood near Kartepe, offering a cozy environment and access to local experiences. Perfect for visitors seeking a laid-back atmosphere mixed with local culture. | Local Markets, Cultural Festivals, Traditional Turkish Cuisine, Quiet Streets, Scenic Views |
Understanding Airbnb License Requirements & STR Laws in Kartepe (2026)
Yes, Kartepe, Kocaeli, Turkey enforces high STR regulations. Obtaining a license and ensuring compliance is almost certainly required according to current 2026 STR laws. Always verify the latest short term rental regulations and Airbnb license requirements directly with local government authorities for Kartepe to ensure full compliance before hosting.
(Source: AirROI data, 2026, based on 86% licensed listings)
Top Performing Airbnb Properties in Kartepe (2026)
Benchmark your potential! Explore examples of top-performing Airbnb properties in Kartepebased on Trailing Twelve Month (TTM) revenue. Analyze their characteristics, revenue, occupancy rate, and ADR to understand what drives success in this market.
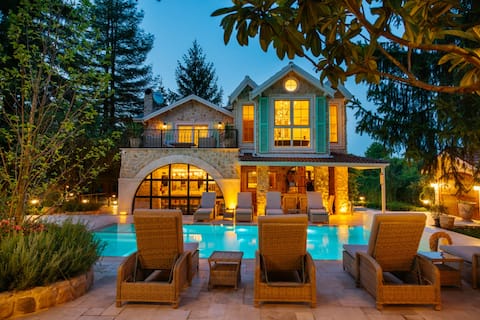
Geyikli Mansion Mountain Resort
Entire Place • 5 bedrooms

Sepetçi Lakehouse - Heated Pool
Entire Place • 5 bedrooms

Isolated Villa with Heated Pool on Sapanca Lake
Entire Place • 4 bedrooms

Atakanlar Chalet , 4000m2 is private to you.
Entire Place • 6 bedrooms
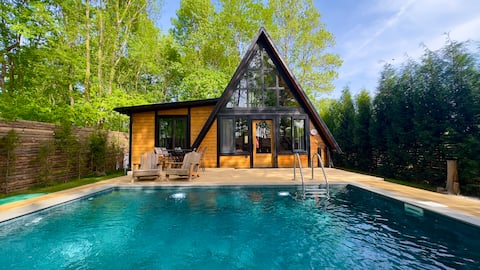
Private Luxury Cabin with Hot Pool and Jacuzzi
Entire Place • 2 bedrooms

Mono House Kartepe
Entire Place • 2 bedrooms
Note: Performance varies based on location, size, amenities, seasonality, and management quality. Data reflects the past 12 months.
Top Performing Airbnb Hosts in Kartepe (2026)
Learn from the best! This table showcases top-performing Airbnb hosts in Kartepe based on the number of properties managed and estimated total revenue over the past year. Analyze their scale and performance metrics.
| Host Name | Properties | Grossing Revenue | Stay Reviews | Avg Rating |
|---|---|---|---|---|
| Emirhan | 9 | $289,476 | 794 | 4.75/5.0 |
| Geyikli Köşk | 1 | $199,820 | 19 | 5.00/5.0 |
| Gökberk | 11 | $196,889 | 336 | 4.71/5.0 |
| Sepetçi Göl Evi | 1 | $126,034 | 65 | 4.91/5.0 |
| Yüksel | 6 | $108,895 | 27 | 5.00/5.0 |
| Semih | 4 | $77,277 | 172 | 4.93/5.0 |
| Hasan Tahsin | 1 | $75,374 | 61 | 4.97/5.0 |
| Kenan | 5 | $62,272 | 71 | 4.89/5.0 |
| Cankat | 5 | $58,143 | 291 | 4.77/5.0 |
| Mono House | 1 | $55,054 | 34 | 4.74/5.0 |
Analyzing the strategies of top hosts, such as their property selection, pricing, and guest communication, can offer valuable lessons for optimizing your own Airbnb operations in Kartepe.
Dive Deeper: Advanced Kartepe STR Market Data (2026)
Ready to unlock more insights? AirROI provides access to advanced metrics and comprehensive Airbnb data for Kartepe. Explore detailed analytics beyond this report to refine your investment strategy, optimize pricing, and maximize your vacation rental profits.
Explore Advanced MetricsKartepe Short-Term Rental Market Composition (2026): Property & Room Types
Room Type Distribution
Property Type Distribution
Market Composition Insights for Kartepe
- The Kartepe Airbnb market composition is heavily skewed towards Entire Home/Apt listings, which make up 90.2% of the 153 active rentals. This indicates strong guest preference for privacy and space.
- Looking at the property type distribution in Kartepe, House properties are the most common (68%), reflecting the local real estate landscape.
- Houses represent a significant 68% portion, catering likely to families or larger groups.
- The presence of 6.5% Hotel/Boutique listings indicates integration with traditional hospitality.
- Smaller segments like outdoor/unique (combined 2.6%) offer potential for unique stay experiences.
Kartepe Airbnb Room Capacity Analysis (2026): Bedroom Distribution
Distribution of Listings by Number of Bedrooms
Room Capacity Insights for Kartepe
- The dominant room capacity in Kartepe is 1 bedroom listings, making up 39.9% of the market. This suggests a strong demand for properties suitable for couples or solo travelers.
- Together, 1 bedroom and 2 bedrooms properties represent 66.7% of the active Airbnb listings in Kartepe, indicating a high concentration in these sizes.
- A significant 30.7% of listings offer 3+ bedrooms, catering to larger groups and families seeking more space in Kartepe.
Kartepe Vacation Rental Guest Capacity Trends (2026)
Distribution of Listings by Guest Capacity
Guest Capacity Insights for Kartepe
- The most common guest capacity trend in Kartepe vacation rentals is listings accommodating 4 guests (23.5%). This suggests the primary traveler segment is likely small families or groups.
- Properties designed for 4 guests and 8+ guests dominate the Kartepe STR market, accounting for 41.8% of listings.
- 37.3% of properties accommodate 6+ guests, serving the market segment for larger families or group travel in Kartepe.
- On average, properties in Kartepe are equipped to host 4.8 guests.
Kartepe Airbnb Booking Patterns (2026): Available vs. Booked Days
Available Days Distribution
Booked Days Distribution
Booking Pattern Insights for Kartepe
- The most common availability pattern in Kartepe falls within the 271-366 days range, representing 78.4% of listings. This suggests many properties have significant open periods on their calendars.
- Approximately 94.7% of listings show high availability (181+ days open annually), indicating potential for increased bookings or specific owner usage patterns.
- For booked days, the 31-90 days range is most frequent in Kartepe (38.6%), reflecting common guest stay durations or potential owner blocking patterns.
- A notable 5.3% of properties secure long booking periods (181+ days booked per year), highlighting successful long-term rental strategies or significant owner usage.
Kartepe Airbnb Minimum Stay Requirements Analysis
Distribution of Listings by Minimum Night Requirement
1 Night
61 listings
39.9% of total
2 Nights
11 listings
7.2% of total
4-6 Nights
4 listings
2.6% of total
7-29 Nights
10 listings
6.5% of total
30+ Nights
67 listings
43.8% of total
Key Insights
- The most prevalent minimum stay requirement in Kartepe is 30+ Nights, adopted by 43.8% of listings. This highlights the market's preference for longer commitments.
- A significant segment (43.8%) caters to monthly stays (30+ nights) in Kartepe, pointing to opportunities in the extended-stay market.
Recommendations
- Align with the market by considering a 30+ Nights minimum stay, as 43.8% of Kartepe hosts use this setting.
- Explore offering discounts for stays of 30+ nights to attract the 43.8% of the market seeking extended stays.
- Adjust minimum nights based on seasonality – potentially shorter during low season and longer during peak demand periods in Kartepe.
Kartepe Airbnb Cancellation Policy Trends Analysis (2026)
Refundable
2 listings
1.3% of total
Limited
10 listings
6.6% of total
Non-refundable
2 listings
1.3% of total
Flexible
34 listings
22.5% of total
Moderate
36 listings
23.8% of total
Firm
43 listings
28.5% of total
Strict
24 listings
15.9% of total
Cancellation Policy Insights for Kartepe
- The prevailing Airbnb cancellation policy trend in Kartepe is Firm, used by 28.5% of listings.
- There's a relatively balanced mix between guest-friendly (46.3%) and stricter (44.4%) policies, offering choices for different guest needs.
Recommendations for Hosts
- Consider adopting a Firm policy to align with the 28.5% market standard in Kartepe.
- Regularly review your cancellation policy against competitors and market demand shifts in Kartepe.
Kartepe STR Booking Lead Time Analysis (2026)
Average Booking Lead Time by Month
Booking Lead Time Insights for Kartepe
- The overall average booking lead time for vacation rentals in Kartepe is 18 days.
- Guests book furthest in advance for stays during July (average 24 days), likely coinciding with peak travel demand or local events.
- The shortest booking windows occur for stays in October (average 10 days), indicating more last-minute travel plans during this time.
- Seasonally, Summer (23 days avg.) sees the longest lead times, while Fall (13 days avg.) has the shortest, reflecting typical travel planning cycles.
Recommendations for Hosts
- Use the overall average lead time (18 days) as a baseline for your pricing and availability strategy in Kartepe.
- During October, focus on last-minute booking availability and promotions, as guests book with very short notice (10 days avg.).
- Target marketing efforts for the Summer season well in advance (at least 23 days) to capture early planners.
- Monitor your own booking lead times against these Kartepe averages to identify opportunities for dynamic pricing adjustments.
Popular & Essential Airbnb Amenities in Kartepe (2026)
Amenity Prevalence
Amenity Insights for Kartepe
- Essential amenities in Kartepe that guests expect include: Free parking on premises, TV. Lacking these (any) could significantly impact bookings.
- Popular amenities like Air conditioning, Wifi, Outdoor dining area are common but not universal. Offering these can provide a competitive edge.
- Warning: Wifi is not universally provided but is considered essential globally. Ensure reliable Wifi is offered.
Recommendations for Hosts
- Ensure your listing includes all essential amenities for Kartepe: Free parking on premises, TV.
- Prioritize adding missing essentials: Free parking on premises, TV.
- Consider adding popular differentiators like Air conditioning or Wifi to increase appeal.
- Highlight unique or less common amenities you offer (e.g., hot tub, dedicated workspace, EV charger) in your listing description and photos.
- Regularly check competitor amenities in Kartepe to stay competitive.
Kartepe Airbnb Guest Demographics & Profile Analysis (2026)
Guest Profile Summary for Kartepe
- The typical guest profile for Airbnb in Kartepe consists of predominantly international visitors (67%), with top international origins including Türkiye, typically belonging to the Post-2000s (Gen Z/Alpha) group (50%), primarily speaking English or Turkish.
- Domestic travelers account for 33.3% of guests.
- Key international markets include Turkey (33.3%) and Türkiye (29.8%).
- Top languages spoken are English (40.9%) followed by Turkish (29.6%).
- A significant demographic segment is the Post-2000s (Gen Z/Alpha) group, representing 50% of guests.
Recommendations for Hosts
- Focus marketing internationally, particularly towards travelers from Türkiye.
- Tailor amenities and listing descriptions to appeal to the dominant Post-2000s (Gen Z/Alpha) demographic (e.g., highlight fast WiFi, smart home features, local guides).
- Highlight unique local experiences or amenities relevant to the primary guest profile.
- Consider seasonal promotions aligned with peak travel times for key origin markets.
Nearby Short-Term Rental Market Comparison
How does the Kartepe Airbnb market stack up against its neighbors? Compare key performance metrics like average monthly revenue, ADR, and occupancy rates in surrounding areas to understand the broader regional STR landscape.
| Market | Active Properties | Monthly Revenue | Daily Rate | Avg. Occupancy |
|---|---|---|---|---|
| Arifiye | 10 | $2,646 | $276.28 | 36% |
| Sapanca | 1,014 | $1,564 | $237.71 | 27% |
| Başiskele | 12 | $1,560 | $194.37 | 32% |
| Serdivan | 16 | $1,423 | $233.88 | 23% |
| Beykoz | 36 | $1,320 | $248.20 | 27% |
| Prince Islands | 152 | $1,190 | $176.95 | 27% |
| Gebze | 10 | $934 | $273.66 | 21% |
| Beşiktaş | 605 | $932 | $109.86 | 37% |
| Üsküdar | 161 | $899 | $101.78 | 38% |
| Şile | 139 | $887 | $151.99 | 24% |