Ezine Airbnb Market Analysis 2026: Short Term Rental Data & Vacation Rental Statistics in Canakkale, Turkey
Is Airbnb profitable in Ezine in 2026? Explore comprehensive Airbnb analytics for Ezine, Canakkale, Turkey to uncover income potential. This 2026 STR market report for Ezine, based on AirROI data from February 2025 to January 2026, reveals key trends in the niche market of 37 active listings.
Whether you're considering an Airbnb investment in Ezine, optimizing your existing vacation rental, or exploring rental arbitrage opportunities, understanding the Ezine Airbnb data is crucial. Navigating the high regulation landscape is key to maximizing your short term rental income potential. Let's dive into the specifics.
Key Ezine Airbnb Performance Metrics Overview
Monthly Airbnb Revenue Variations & Income Potential in Ezine (2026)
Understanding the monthly revenue variations for Airbnb listings in Ezine is key to maximizing your short term rental income potential. Seasonality significantly impacts earnings. Our analysis, based on data from the past 12 months, shows that the peak revenue month for STRs in Ezine is typically August, while February often presents the lowest earnings, highlighting opportunities for strategic pricing adjustments during shoulder and low seasons. Explore the typical Airbnb income in Ezine across different performance tiers:
- Best-in-class properties (Top 10%) achieve $1,295+ monthly, often utilizing dynamic pricing and superior guest experiences.
- Strong performing properties (Top 25%) earn $612 or more, indicating effective management and desirable locations/amenities.
- Typical properties (Median) generate around $379 per month, representing the average market performance.
- Entry-level properties (Bottom 25%) see earnings around $187, often with potential for optimization.
Average Monthly Airbnb Earnings Trend in Ezine
Ezine Airbnb Occupancy Rate Trends (2026)
Maximize your bookings by understanding the Ezine STR occupancy trends. Seasonal demand shifts significantly influence how often properties are booked. Typically, Augustsees the highest demand (peak season occupancy), while February experiences the lowest (low season). Effective strategies, like adjusting minimum stays or offering promotions, can boost occupancy during slower periods. Here's how different property tiers perform in Ezine:
- Best-in-class properties (Top 10%) achieve 43%+ occupancy, indicating high desirability and potentially optimized availability.
- Strong performing properties (Top 25%) maintain 23% or higher occupancy, suggesting good market fit and guest satisfaction.
- Typical properties (Median) have an occupancy rate around 14%.
- Entry-level properties (Bottom 25%) average 7% occupancy, potentially facing higher vacancy.
Average Monthly Occupancy Rate Trend in Ezine
Average Daily Rate (ADR) Airbnb Trends in Ezine (2026)
Effective short term rental pricing strategy in Ezine involves understanding monthly ADR fluctuations. The Average Daily Rate (ADR) for Airbnb in Ezine typically peaks in June and dips lowest during November. Leveraging Airbnb dynamic pricing tools or strategies based on this seasonality can significantly boost revenue. Here's a look at the typical nightly rates achieved:
- Best-in-class properties (Top 10%) command rates of $134+ per night, often due to premium features or locations.
- Strong performing properties (Top 25%) achieve nightly rates of $108 or more.
- Typical properties (Median) charge around $87 per night.
- Entry-level properties (Bottom 25%) earn around $59 per night.
Average Daily Rate (ADR) Trend by Month in Ezine
Get Live Ezine Market Intelligence 👇

Explore Real-time Analytics
Airbnb Seasonality Analysis & Trends in Ezine (2026)
Peak Season (August, July, October)
- Revenue averages $1,195 per month
- Occupancy rates average 39.0%
- Daily rates average $95
Shoulder Season
- Revenue averages $491 per month
- Occupancy maintains around 15.2%
- Daily rates hold near $92
Low Season (January, February, December)
- Revenue drops to average $128 per month
- Occupancy decreases to average 5.6%
- Daily rates adjust to average $88
Seasonality Insights for Ezine
- The Airbnb seasonality in Ezine shows highly seasonal trends requiring careful strategy. While the sections above show seasonal averages, it's also insightful to look at the extremes:
- During the high season, the absolute peak month showcases Ezine's highest earning potential, with monthly revenues capable of climbing to $1,412, occupancy reaching a high of 46.8%, and ADRs peaking at $99.
- Conversely, the slowest single month of the year, typically falling within the low season, marks the market's lowest point. In this month, revenue might dip to $55, occupancy could drop to 3.6%, and ADRs may adjust down to $86.
- Understanding both the seasonal averages and these monthly peaks and troughs in revenue, occupancy, and ADR is crucial for maximizing your Airbnb profit potential in Ezine.
Seasonal Strategies for Maximizing Profit
- Peak Season: Maximize revenue through premium pricing and potentially longer minimum stays. Ensure high availability.
- Low Season: Offer competitive pricing, special promotions (e.g., extended stay discounts), and flexible cancellation policies. Target off-season travelers like remote workers or budget-conscious guests.
- Shoulder Seasons: Implement dynamic pricing that balances peak and low rates. Target weekend travelers or specific events. Offer slightly more flexible terms than peak season.
- Regularly analyze your own performance against these Ezine seasonality benchmarks and adjust your pricing and availability strategy accordingly.
Best Areas for Airbnb Investment in Ezine (2026)
Exploring the top neighborhoods for short-term rentals in Ezine? This section highlights key areas, outlining why they are attractive for hosts and guests, along with notable local attractions. Consider these locations based on your target guest profile and investment strategy.
| Neighborhood / Area | Why Host Here? (Target Guests & Appeal) | Key Attractions & Landmarks |
|---|---|---|
| Ezine Town Center | The heart of Ezine, offering a blend of local culture and accessibility to nearby attractions. Ideal for travelers looking to experience Turkish town life and culinary delights. | Ezine Castle, Local markets, Troy Archaeological Site, Seafood restaurants |
| Ayvacik District | A peaceful area with breathtaking natural beauty. Great for those looking to escape the city, it offers proximity to the Kazdağı National Park. | Kazdağı National Park, Nature trails, Local villages, River activities |
| Cahramanlar Village | A quaint village known for its tranquility and stunning views. Perfect for guests looking for a rural retreat away from the hustle and bustle. | Village hikes, Organic farms, Traditional Turkish homes |
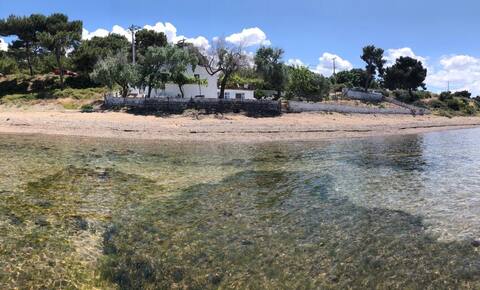
| Geyikli | A popular seaside town known for its beaches and coastal activities, appealing to those seeking a beach vacation experience. | Geyikli Beach, Boat tours, Fishing spots, Beach bars |
| Dardanos Beach Area | Known for its scenic beaches and resorts, it attracts beach lovers and those looking for relaxation by the sea. | Dardanos Beach, Beach clubs, Water sports, Sunset views |
| Kucukkuyu | A charming coastal town on the Aegean with a rich history and beautiful sea views, offering an authentic Turkish experience. | Ancient ruins, Boat rides, Local artisan shops |
| Troy Historical Site | A UNESCO World Heritage site, it attracts history enthusiasts and tourists interested in ancient civilizations. | The ruins of Troy, The Trojan Horse replica, Historical exhibitions |
| Sakarya Village | A tranquil village known for its agriculture and beauty, perfect for guests seeking a quiet and authentic rural experience. | Farmland, Local cheese producers, Hiking trails |
Understanding Airbnb License Requirements & STR Laws in Ezine (2026)
Yes, Ezine, Canakkale, Turkey enforces high STR regulations. Obtaining a license and ensuring compliance is almost certainly required according to current 2026 STR laws. Always verify the latest short term rental regulations and Airbnb license requirements directly with local government authorities for Ezine to ensure full compliance before hosting.
(Source: AirROI data, 2026, based on 73% licensed listings)
Top Performing Airbnb Properties in Ezine (2026)
Benchmark your potential! Explore examples of top-performing Airbnb properties in Ezinebased on Trailing Twelve Month (TTM) revenue. Analyze their characteristics, revenue, occupancy rate, and ADR to understand what drives success in this market.

Sea House ║ Hidden Paradise Alexandria Troas & Dalyan
Entire Place • 1 bedroom
Charming Beachfront Escape – Private & Peaceful
Entire Place • 2 bedrooms

Cozy And Peaceful | Sapmaz Stone House Çanakkale Tavaklı
Entire Place • 1 bedroom

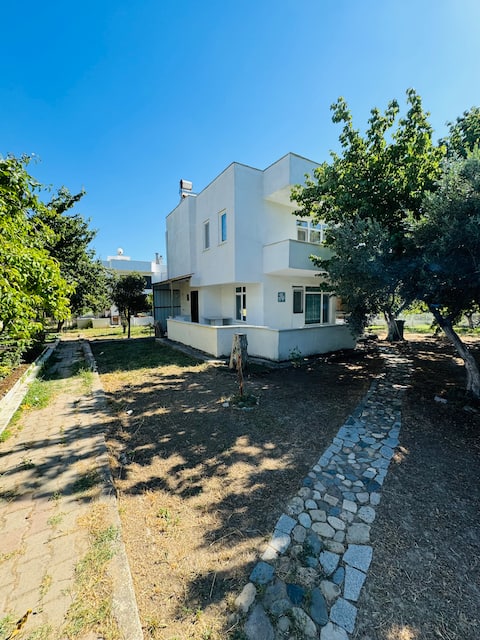
house with garden near the beach
Entire Place • 3 bedrooms
Troya Garden Villa
Entire Place • 3 bedrooms

Neandria Stone House Mustakil Tas Ev
Entire Place • 1 bedroom
Note: Performance varies based on location, size, amenities, seasonality, and management quality. Data reflects the past 12 months.
Top Performing Airbnb Hosts in Ezine (2026)
Learn from the best! This table showcases top-performing Airbnb hosts in Ezine based on the number of properties managed and estimated total revenue over the past year. Analyze their scale and performance metrics.
| Host Name | Properties | Grossing Revenue | Stay Reviews | Avg Rating |
|---|---|---|---|---|
| Ali Enselioğlu | 1 | $23,076 | 99 | 4.99/5.0 |
| Bedriye | 1 | $14,631 | 12 | 4.92/5.0 |
| Mehmet | 1 | $9,200 | 31 | 4.81/5.0 |
| Tijen | 1 | $8,022 | 40 | 4.83/5.0 |
| Mete | 6 | $7,758 | 26 | 4.95/5.0 |
| Basar | 2 | $7,078 | 61 | 4.82/5.0 |
| Troya Garden Vi̇lla | 1 | $6,586 | 5 | 3.60/5.0 |
| Ece | 1 | $6,096 | 18 | 5.00/5.0 |
| Tarik | 4 | $5,561 | 101 | 4.81/5.0 |
| Efe | 1 | $5,526 | 56 | 4.82/5.0 |
Analyzing the strategies of top hosts, such as their property selection, pricing, and guest communication, can offer valuable lessons for optimizing your own Airbnb operations in Ezine.
Dive Deeper: Advanced Ezine STR Market Data (2026)
Ready to unlock more insights? AirROI provides access to advanced metrics and comprehensive Airbnb data for Ezine. Explore detailed analytics beyond this report to refine your investment strategy, optimize pricing, and maximize your vacation rental profits.
Explore Advanced MetricsEzine Short-Term Rental Market Composition (2026): Property & Room Types
Room Type Distribution
Property Type Distribution
Market Composition Insights for Ezine
- The Ezine Airbnb market composition is heavily skewed towards Entire Home/Apt listings, which make up 83.8% of the 37 active rentals. This indicates strong guest preference for privacy and space.
- Looking at the property type distribution in Ezine, House properties are the most common (70.3%), reflecting the local real estate landscape.
- Houses represent a significant 70.3% portion, catering likely to families or larger groups.
- The presence of 10.8% Hotel/Boutique listings indicates integration with traditional hospitality.
- Smaller segments like others (combined 2.7%) offer potential for unique stay experiences.
Ezine Airbnb Room Capacity Analysis (2026): Bedroom Distribution
Distribution of Listings by Number of Bedrooms
Room Capacity Insights for Ezine
- The dominant room capacity in Ezine is 1 bedroom listings, making up 67.6% of the market. This suggests a strong demand for properties suitable for couples or solo travelers.
- Together, 1 bedroom and 2 bedrooms properties represent 78.4% of the active Airbnb listings in Ezine, indicating a high concentration in these sizes.
- With over half the market (67.6%) consisting of studios or 1-bedroom units, Ezine is particularly well-suited for individuals or couples.
- Listings with 3+ bedrooms (8.1%) represent a smaller niche, potentially indicating an underserved market for larger group accommodations in Ezine.
Ezine Vacation Rental Guest Capacity Trends (2026)
Distribution of Listings by Guest Capacity
Guest Capacity Insights for Ezine
- The most common guest capacity trend in Ezine vacation rentals is listings accommodating 4 guests (35.1%). This suggests the primary traveler segment is likely small families or groups.
- Properties designed for 4 guests and 3 guests dominate the Ezine STR market, accounting for 51.3% of listings.
- 21.6% of properties accommodate 6+ guests, serving the market segment for larger families or group travel in Ezine.
- On average, properties in Ezine are equipped to host 3.9 guests.
Ezine Airbnb Booking Patterns (2026): Available vs. Booked Days
Available Days Distribution
Booked Days Distribution
Booking Pattern Insights for Ezine
- The most common availability pattern in Ezine falls within the 271-366 days range, representing 91.9% of listings. This suggests many properties have significant open periods on their calendars.
- Approximately 100.0% of listings show high availability (181+ days open annually), indicating potential for increased bookings or specific owner usage patterns.
- For booked days, the 1-30 days range is most frequent in Ezine (51.4%), reflecting common guest stay durations or potential owner blocking patterns.
Ezine Airbnb Minimum Stay Requirements Analysis
Distribution of Listings by Minimum Night Requirement
1 Night
12 listings
32.4% of total
2 Nights
8 listings
21.6% of total
3 Nights
1 listings
2.7% of total
4-6 Nights
1 listings
2.7% of total
7-29 Nights
5 listings
13.5% of total
30+ Nights
10 listings
27% of total
Key Insights
- The most prevalent minimum stay requirement in Ezine is 1 Night, adopted by 32.4% of listings. This highlights the market's preference for shorter, flexible bookings.
- A significant segment (27%) caters to monthly stays (30+ nights) in Ezine, pointing to opportunities in the extended-stay market.
Recommendations
- Align with the market by considering a 1 Night minimum stay, as 32.4% of Ezine hosts use this setting.
- Explore offering discounts for stays of 30+ nights to attract the 27% of the market seeking extended stays.
- Adjust minimum nights based on seasonality – potentially shorter during low season and longer during peak demand periods in Ezine.
Ezine Airbnb Cancellation Policy Trends Analysis (2026)
Limited
8 listings
21.6% of total
Flexible
8 listings
21.6% of total
Moderate
5 listings
13.5% of total
Firm
10 listings
27% of total
Strict
6 listings
16.2% of total
Cancellation Policy Insights for Ezine
- The prevailing Airbnb cancellation policy trend in Ezine is Firm, used by 27% of listings.
- There's a relatively balanced mix between guest-friendly (35.1%) and stricter (43.2%) policies, offering choices for different guest needs.
Recommendations for Hosts
- Consider adopting a Firm policy to align with the 27% market standard in Ezine.
- Regularly review your cancellation policy against competitors and market demand shifts in Ezine.
Ezine STR Booking Lead Time Analysis (2026)
Average Booking Lead Time by Month
Booking Lead Time Insights for Ezine
- The overall average booking lead time for vacation rentals in Ezine is 26 days.
- Guests book furthest in advance for stays during February (average 77 days), likely coinciding with peak travel demand or local events.
- The shortest booking windows occur for stays in December (average 11 days), indicating more last-minute travel plans during this time.
- Seasonally, Winter (37 days avg.) sees the longest lead times, while Fall (22 days avg.) has the shortest, reflecting typical travel planning cycles.
Recommendations for Hosts
- Use the overall average lead time (26 days) as a baseline for your pricing and availability strategy in Ezine.
- For February stays, consider implementing length-of-stay discounts or slightly higher rates for bookings made less than 77 days out to capitalize on advance planning.
- During December, focus on last-minute booking availability and promotions, as guests book with very short notice (11 days avg.).
- Target marketing efforts for the Winter season well in advance (at least 37 days) to capture early planners.
- Monitor your own booking lead times against these Ezine averages to identify opportunities for dynamic pricing adjustments.
Popular & Essential Airbnb Amenities in Ezine (2026)
Amenity Prevalence
Amenity Insights for Ezine
- Popular amenities like TV, Heating, Hot water are common but not universal. Offering these can provide a competitive edge.
Recommendations for Hosts
- Consider adding popular differentiators like TV or Heating to increase appeal.
- Highlight unique or less common amenities you offer (e.g., hot tub, dedicated workspace, EV charger) in your listing description and photos.
- Regularly check competitor amenities in Ezine to stay competitive.
Ezine Airbnb Guest Demographics & Profile Analysis (2026)
Guest Profile Summary for Ezine
- The typical guest profile for Airbnb in Ezine consists of predominantly international visitors (83%), with top international origins including Türkiye, typically belonging to the Post-2000s (Gen Z/Alpha) group (50%), primarily speaking English or Turkish.
- Domestic travelers account for 17.4% of guests.
- Key international markets include Turkey (17.4%) and Türkiye (15.9%).
- Top languages spoken are English (40.7%) followed by Turkish (18.7%).
- A significant demographic segment is the Post-2000s (Gen Z/Alpha) group, representing 50% of guests.
Recommendations for Hosts
- Focus marketing internationally, particularly towards travelers from Türkiye.
- Tailor amenities and listing descriptions to appeal to the dominant Post-2000s (Gen Z/Alpha) demographic (e.g., highlight fast WiFi, smart home features, local guides).
- Highlight unique local experiences or amenities relevant to the primary guest profile.
- Consider seasonal promotions aligned with peak travel times for key origin markets.
Nearby Short-Term Rental Market Comparison
How does the Ezine Airbnb market stack up against its neighbors? Compare key performance metrics like average monthly revenue, ADR, and occupancy rates in surrounding areas to understand the broader regional STR landscape.
| Market | Active Properties | Monthly Revenue | Daily Rate | Avg. Occupancy |
|---|---|---|---|---|
| Güzelbahçe | 13 | $1,669 | $172.78 | 38% |
| Dikella | 16 | $1,170 | $190.78 | 36% |
| Foça | 124 | $994 | $157.95 | 29% |
| Çeşme | 1,045 | $991 | $210.81 | 29% |
| Bayraklı | 16 | $920 | $58.82 | 53% |
| Skala Eresou | 51 | $885 | $111.57 | 47% |
| Makri | 25 | $874 | $144.03 | 37% |
| Molyvos | 52 | $870 | $130.36 | 41% |
| Alexandroupoli | 267 | $870 | $119.70 | 36% |
| Thymiana | 14 | $853 | $230.51 | 32% |