Alanya Airbnb Market Analysis 2026: Short Term Rental Data & Vacation Rental Statistics in Antalya, Turkey
Is Airbnb profitable in Alanya in 2026? Explore comprehensive Airbnb analytics for Alanya, Antalya, Turkey to uncover income potential. This 2026 STR market report for Alanya, based on AirROI data from February 2025 to January 2026, reveals key trends in the bustling market of 1,053 active listings.
Whether you're considering an Airbnb investment in Alanya, optimizing your existing vacation rental, or exploring rental arbitrage opportunities, understanding the Alanya Airbnb data is crucial. Navigating the high regulation landscape is key to maximizing your short term rental income potential. Let's dive into the specifics.
Key Alanya Airbnb Performance Metrics Overview
Monthly Airbnb Revenue Variations & Income Potential in Alanya (2026)
Understanding the monthly revenue variations for Airbnb listings in Alanya is key to maximizing your short term rental income potential. Seasonality significantly impacts earnings. Our analysis, based on data from the past 12 months, shows that the peak revenue month for STRs in Alanya is typically August, while February often presents the lowest earnings, highlighting opportunities for strategic pricing adjustments during shoulder and low seasons. Explore the typical Airbnb income in Alanya across different performance tiers:
- Best-in-class properties (Top 10%) achieve $2,326+ monthly, often utilizing dynamic pricing and superior guest experiences.
- Strong performing properties (Top 25%) earn $1,475 or more, indicating effective management and desirable locations/amenities.
- Typical properties (Median) generate around $816 per month, representing the average market performance.
- Entry-level properties (Bottom 25%) see earnings around $346, often with potential for optimization.
Average Monthly Airbnb Earnings Trend in Alanya
Alanya Airbnb Occupancy Rate Trends (2026)
Maximize your bookings by understanding the Alanya STR occupancy trends. Seasonal demand shifts significantly influence how often properties are booked. Typically, Augustsees the highest demand (peak season occupancy), while December experiences the lowest (low season). Effective strategies, like adjusting minimum stays or offering promotions, can boost occupancy during slower periods. Here's how different property tiers perform in Alanya:
- Best-in-class properties (Top 10%) achieve 76%+ occupancy, indicating high desirability and potentially optimized availability.
- Strong performing properties (Top 25%) maintain 56% or higher occupancy, suggesting good market fit and guest satisfaction.
- Typical properties (Median) have an occupancy rate around 33%.
- Entry-level properties (Bottom 25%) average 15% occupancy, potentially facing higher vacancy.
Average Monthly Occupancy Rate Trend in Alanya
Average Daily Rate (ADR) Airbnb Trends in Alanya (2026)
Effective short term rental pricing strategy in Alanya involves understanding monthly ADR fluctuations. The Average Daily Rate (ADR) for Airbnb in Alanya typically peaks in September and dips lowest during February. Leveraging Airbnb dynamic pricing tools or strategies based on this seasonality can significantly boost revenue. Here's a look at the typical nightly rates achieved:
- Best-in-class properties (Top 10%) command rates of $145+ per night, often due to premium features or locations.
- Strong performing properties (Top 25%) achieve nightly rates of $95 or more.
- Typical properties (Median) charge around $64 per night.
- Entry-level properties (Bottom 25%) earn around $44 per night.
Average Daily Rate (ADR) Trend by Month in Alanya
Get Live Alanya Market Intelligence 👇

Explore Real-time Analytics
Airbnb Seasonality Analysis & Trends in Alanya (2026)
Peak Season (August, July, September)
- Revenue averages $1,766 per month
- Occupancy rates average 48.4%
- Daily rates average $91
Shoulder Season
- Revenue averages $1,003 per month
- Occupancy maintains around 34.3%
- Daily rates hold near $85
Low Season (February, March, December)
- Revenue drops to average $676 per month
- Occupancy decreases to average 32.2%
- Daily rates adjust to average $78
Seasonality Insights for Alanya
- The Airbnb seasonality in Alanya shows highly seasonal trends requiring careful strategy. While the sections above show seasonal averages, it's also insightful to look at the extremes:
- During the high season, the absolute peak month showcases Alanya's highest earning potential, with monthly revenues capable of climbing to $1,986, occupancy reaching a high of 51.6%, and ADRs peaking at $94.
- Conversely, the slowest single month of the year, typically falling within the low season, marks the market's lowest point. In this month, revenue might dip to $598, occupancy could drop to 27.1%, and ADRs may adjust down to $74.
- Understanding both the seasonal averages and these monthly peaks and troughs in revenue, occupancy, and ADR is crucial for maximizing your Airbnb profit potential in Alanya.
Seasonal Strategies for Maximizing Profit
- Peak Season: Maximize revenue through premium pricing and potentially longer minimum stays. Ensure high availability.
- Low Season: Offer competitive pricing, special promotions (e.g., extended stay discounts), and flexible cancellation policies. Target off-season travelers like remote workers or budget-conscious guests.
- Shoulder Seasons: Implement dynamic pricing that balances peak and low rates. Target weekend travelers or specific events. Offer slightly more flexible terms than peak season.
- Regularly analyze your own performance against these Alanya seasonality benchmarks and adjust your pricing and availability strategy accordingly.
Best Areas for Airbnb Investment in Alanya (2026)
Exploring the top neighborhoods for short-term rentals in Alanya? This section highlights key areas, outlining why they are attractive for hosts and guests, along with notable local attractions. Consider these locations based on your target guest profile and investment strategy.
| Neighborhood / Area | Why Host Here? (Target Guests & Appeal) | Key Attractions & Landmarks |
|---|---|---|
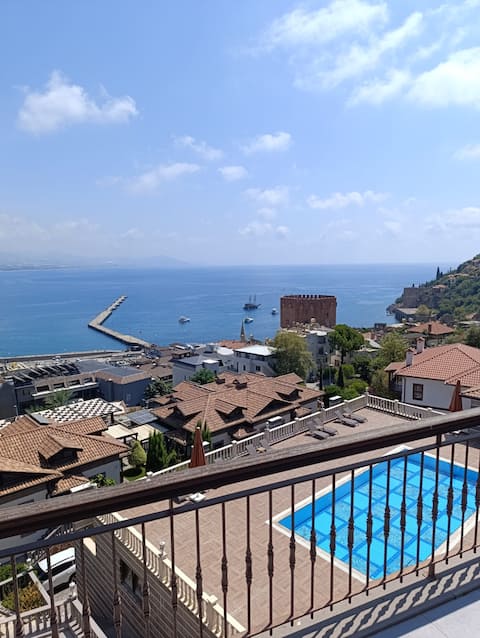
| Cleopatra Beach | Famous for its stunning sandy beach and crystal clear waters. A top spot for sunbathers and swimmers, making it popular with tourists. | Cleopatra Beach, Alanya Castle, Damlatas Cave, Alanya Archaeological Museum, Red Tower |
| Alanya Castle | A historical site offering breathtaking views of the Mediterranean. A great area for history enthusiasts and sightseers. | Alanya Castle, Red Tower, Alanya Gardens, TOsn't of ancient city walls, Kızılkule |
| Dimcay | A picturesque green valley known for its river and scenic picnic areas. Popular for those looking to escape the beach and enjoy nature. | Dim River, Dim Cave, Picnic areas, Scenic views, Mountain walks |
| Mahmutlar | A developing area with great beachfront properties and a vibrant expat community. Attractive for those seeking a more laid-back lifestyle. | Mahmutlar Beach, Mahmutlar weekly markets, Local cafés, Mount Taurus views, Dim River nearby |
| Oba | A quieter area close to Alanya with beautiful beaches and new resorts. Good for families and those looking for relaxation. | Oba Beach, Shopping centers, Local restaurants, Peaceful parks, Oba River |
| Kargicak | A serene area with luxury villas and beautiful views of the coast. Great place for high-end rental options. | Kargicak Beach, Luxury villas, Scenic hiking routes, Peaceful environment, Nature |
| Tosmur | An up-and-coming neighborhood with affordable properties. Popular with young families and those seeking a community atmosphere. | Tosmur Beach, Local markets, Parks, Alanya River, Family-friendly activities |
| Alanya City Center | The bustling heart of Alanya with shops, restaurants, and vibrant nightlife. Ideal for visitors wanting to experience the local culture. | City bazaar, Alanya Harbor, Cafes and nightlife, Cultural events, Historical sites |
Understanding Airbnb License Requirements & STR Laws in Alanya (2026)
Yes, Alanya, Antalya, Turkey enforces high STR regulations. Obtaining a license and ensuring compliance is almost certainly required according to current 2026 STR laws. Always verify the latest short term rental regulations and Airbnb license requirements directly with local government authorities for Alanya to ensure full compliance before hosting.
(Source: AirROI data, 2026, based on 74% licensed listings)
Top Performing Airbnb Properties in Alanya (2026)
Benchmark your potential! Explore examples of top-performing Airbnb properties in Alanyabased on Trailing Twelve Month (TTM) revenue. Analyze their characteristics, revenue, occupancy rate, and ADR to understand what drives success in this market.

Luxury villa with roof terrace
Entire Place • 3 bedrooms
Stunning Sea and Castle Views, Alanya Villa 1024
Entire Place • 8 bedrooms

Discover Alanya Bliss: Villa 1055 Awaits
Entire Place • 4 bedrooms

Cleopatra Beach | Spacious | Modern | Clean
Entire Place • 2 bedrooms
4BR Big Villa Spectacular view
Entire Place • 4 bedrooms

Sun, Pool & Comfort Await You, Alanya Villa 1005
Entire Place • 4 bedrooms
Note: Performance varies based on location, size, amenities, seasonality, and management quality. Data reflects the past 12 months.
Top Performing Airbnb Hosts in Alanya (2026)
Learn from the best! This table showcases top-performing Airbnb hosts in Alanya based on the number of properties managed and estimated total revenue over the past year. Analyze their scale and performance metrics.
| Host Name | Properties | Grossing Revenue | Stay Reviews | Avg Rating |
|---|---|---|---|---|
| Camilla | 31 | $446,815 | 960 | 4.82/5.0 |
| Степан | 35 | $368,223 | 370 | 4.69/5.0 |
| 5 Star Villa Holidays | 7 | $340,220 | 46 | 4.61/5.0 |
| Alara | 7 | $261,112 | 291 | 4.93/5.0 |
| Adina | 28 | $239,568 | 276 | 4.51/5.0 |
| Othman | 19 | $219,215 | 176 | 4.69/5.0 |
| Serhat | 12 | $159,787 | 512 | 4.96/5.0 |
| Erhan Direkçi | 29 | $153,151 | 270 | 4.73/5.0 |
| Руслан | 11 | $145,557 | 44 | 4.91/5.0 |
| Alanya Luxury Villas | 5 | $143,213 | 24 | 4.73/5.0 |
Analyzing the strategies of top hosts, such as their property selection, pricing, and guest communication, can offer valuable lessons for optimizing your own Airbnb operations in Alanya.
Dive Deeper: Advanced Alanya STR Market Data (2026)
Ready to unlock more insights? AirROI provides access to advanced metrics and comprehensive Airbnb data for Alanya. Explore detailed analytics beyond this report to refine your investment strategy, optimize pricing, and maximize your vacation rental profits.
Explore Advanced MetricsAlanya Short-Term Rental Market Composition (2026): Property & Room Types
Room Type Distribution
Property Type Distribution
Market Composition Insights for Alanya
- The Alanya Airbnb market composition is heavily skewed towards Entire Home/Apt listings, which make up 95.1% of the 1,053 active rentals. This indicates strong guest preference for privacy and space.
- Looking at the property type distribution in Alanya, Apartment/Condo properties are the most common (81.9%), reflecting the local real estate landscape.
- Smaller segments like hotel/boutique, outdoor/unique, unique stays (combined 4.1%) offer potential for unique stay experiences.
Alanya Airbnb Room Capacity Analysis (2026): Bedroom Distribution
Distribution of Listings by Number of Bedrooms
Room Capacity Insights for Alanya
- The dominant room capacity in Alanya is 1 bedroom listings, making up 57% of the market. This suggests a strong demand for properties suitable for couples or solo travelers.
- Together, 1 bedroom and 2 bedrooms properties represent 84.7% of the active Airbnb listings in Alanya, indicating a high concentration in these sizes.
- With over half the market (57%) consisting of studios or 1-bedroom units, Alanya is particularly well-suited for individuals or couples.
Alanya Vacation Rental Guest Capacity Trends (2026)
Distribution of Listings by Guest Capacity
Guest Capacity Insights for Alanya
- The most common guest capacity trend in Alanya vacation rentals is listings accommodating 4 guests (37.2%). This suggests the primary traveler segment is likely small families or groups.
- Properties designed for 4 guests and 3 guests dominate the Alanya STR market, accounting for 52.7% of listings.
- 25.5% of properties accommodate 6+ guests, serving the market segment for larger families or group travel in Alanya.
- On average, properties in Alanya are equipped to host 4.4 guests.
Alanya Airbnb Booking Patterns (2026): Available vs. Booked Days
Available Days Distribution
Booked Days Distribution
Booking Pattern Insights for Alanya
- The most common availability pattern in Alanya falls within the 271-366 days range, representing 70.9% of listings. This suggests many properties have significant open periods on their calendars.
- Approximately 93.0% of listings show high availability (181+ days open annually), indicating potential for increased bookings or specific owner usage patterns.
- For booked days, the 1-30 days range is most frequent in Alanya (35.2%), reflecting common guest stay durations or potential owner blocking patterns.
- A notable 7.8% of properties secure long booking periods (181+ days booked per year), highlighting successful long-term rental strategies or significant owner usage.
Alanya Airbnb Minimum Stay Requirements Analysis
Distribution of Listings by Minimum Night Requirement
1 Night
153 listings
14.5% of total
2 Nights
39 listings
3.7% of total
3 Nights
47 listings
4.5% of total
4-6 Nights
84 listings
8% of total
7-29 Nights
219 listings
20.8% of total
30+ Nights
511 listings
48.5% of total
Key Insights
- The most prevalent minimum stay requirement in Alanya is 30+ Nights, adopted by 48.5% of listings. This highlights the market's preference for longer commitments.
- Very short stays (1-2 nights) are less common (18.2%), suggesting hosts prefer slightly longer bookings to optimize turnover.
- A significant segment (48.5%) caters to monthly stays (30+ nights) in Alanya, pointing to opportunities in the extended-stay market.
Recommendations
- Align with the market by considering a 30+ Nights minimum stay, as 48.5% of Alanya hosts use this setting.
- If feasible, allowing 1-night stays, especially midweek or during low season, could capture last-minute bookings, as only 14.5% currently do.
- Explore offering discounts for stays of 30+ nights to attract the 48.5% of the market seeking extended stays.
- Adjust minimum nights based on seasonality – potentially shorter during low season and longer during peak demand periods in Alanya.
Alanya Airbnb Cancellation Policy Trends Analysis (2026)
Refundable
6 listings
0.6% of total
Limited
53 listings
5.1% of total
Non-refundable
5 listings
0.5% of total
Super Strict 60 Days
13 listings
1.2% of total
Flexible
329 listings
31.6% of total
Moderate
198 listings
19% of total
Firm
342 listings
32.8% of total
Strict
96 listings
9.2% of total
Cancellation Policy Insights for Alanya
- The prevailing Airbnb cancellation policy trend in Alanya is Firm, used by 32.8% of listings.
- There's a relatively balanced mix between guest-friendly (50.6%) and stricter (42.0%) policies, offering choices for different guest needs.
- Strict cancellation policies are quite rare (9.2%), potentially making listings with this policy less competitive unless justified by high demand or property type.
Recommendations for Hosts
- Consider adopting a Firm policy to align with the 32.8% market standard in Alanya.
- Using a Strict policy might deter some guests, as only 9.2% of listings use it. Evaluate if potential revenue protection outweighs possible lower booking rates.
- Regularly review your cancellation policy against competitors and market demand shifts in Alanya.
Alanya STR Booking Lead Time Analysis (2026)
Average Booking Lead Time by Month
Booking Lead Time Insights for Alanya
- The overall average booking lead time for vacation rentals in Alanya is 35 days.
- Guests book furthest in advance for stays during July (average 51 days), likely coinciding with peak travel demand or local events.
- The shortest booking windows occur for stays in February (average 11 days), indicating more last-minute travel plans during this time.
- Seasonally, Summer (43 days avg.) sees the longest lead times, while Winter (16 days avg.) has the shortest, reflecting typical travel planning cycles.
Recommendations for Hosts
- Use the overall average lead time (35 days) as a baseline for your pricing and availability strategy in Alanya.
- For July stays, consider implementing length-of-stay discounts or slightly higher rates for bookings made less than 51 days out to capitalize on advance planning.
- During February, focus on last-minute booking availability and promotions, as guests book with very short notice (11 days avg.).
- Target marketing efforts for the Summer season well in advance (at least 43 days) to capture early planners.
- Monitor your own booking lead times against these Alanya averages to identify opportunities for dynamic pricing adjustments.
Popular & Essential Airbnb Amenities in Alanya (2026)
Amenity Prevalence
Amenity Insights for Alanya
- Essential amenities in Alanya that guests expect include: Air conditioning, Wifi, TV, Kitchen. Lacking these (any) could significantly impact bookings.
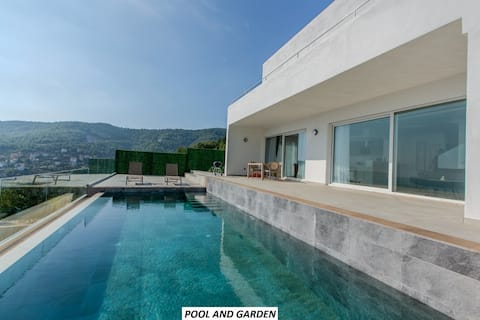
- Popular amenities like Washer, Hair dryer, Pool are common but not universal. Offering these can provide a competitive edge.
- A pool is a highly desired but not standard amenity, making it a key feature for attracting guests seeking leisure in Alanya.
Recommendations for Hosts
- Ensure your listing includes all essential amenities for Alanya: Air conditioning, Wifi, TV, Kitchen.
- Prioritize adding missing essentials: Air conditioning, Wifi, TV, Kitchen.
- Consider adding popular differentiators like Washer or Hair dryer to increase appeal.
- Highlight unique or less common amenities you offer (e.g., hot tub, dedicated workspace, EV charger) in your listing description and photos.
- Regularly check competitor amenities in Alanya to stay competitive.
Alanya Airbnb Guest Demographics & Profile Analysis (2026)
Guest Profile Summary for Alanya
- The typical guest profile for Airbnb in Alanya consists of predominantly international visitors (91%), with top international origins including United Kingdom, typically belonging to the Post-2000s (Gen Z/Alpha) group (50%), primarily speaking English or Russian.
- Domestic travelers account for 8.7% of guests.
- Key international markets include Germany (12.7%) and United Kingdom (9.2%).
- Top languages spoken are English (38.9%) followed by Russian (11.6%).
- A significant demographic segment is the Post-2000s (Gen Z/Alpha) group, representing 50% of guests.
Recommendations for Hosts
- Focus marketing internationally, particularly towards travelers from United Kingdom.
- Tailor amenities and listing descriptions to appeal to the dominant Post-2000s (Gen Z/Alpha) demographic (e.g., highlight fast WiFi, smart home features, local guides).
- Highlight unique local experiences or amenities relevant to the primary guest profile.
- Consider seasonal promotions aligned with peak travel times for key origin markets.
Nearby Short-Term Rental Market Comparison
How does the Alanya Airbnb market stack up against its neighbors? Compare key performance metrics like average monthly revenue, ADR, and occupancy rates in surrounding areas to understand the broader regional STR landscape.
| Market | Active Properties | Monthly Revenue | Daily Rate | Avg. Occupancy |
|---|---|---|---|---|
| Yialia | 15 | $2,478 | $297.53 | 43% |
| Pomos | 56 | $2,161 | $238.67 | 39% |
| Argaka | 50 | $2,110 | $260.98 | 45% |
| Neo Chorio | 108 | $2,009 | $242.15 | 42% |
| Ayia Marina Chrysochous | 33 | $1,531 | $165.81 | 41% |
| Vasilia | 25 | $1,483 | $215.52 | 33% |
| Agios Epiktitos | 41 | $1,421 | $176.31 | 39% |
| Polis Chrysochous | 195 | $1,344 | $156.03 | 42% |
| Serik | 289 | $1,214 | $215.55 | 33% |
| Lapithos | 55 | $1,086 | $146.36 | 38% |