Mak Khaeng Subdistrict Airbnb Market Analysis 2026: Short Term Rental Data & Vacation Rental Statistics in Udon Thani Province, Thailand
Is Airbnb profitable in Mak Khaeng Subdistrict in 2026? Explore comprehensive Airbnb analytics for Mak Khaeng Subdistrict, Udon Thani Province, Thailand to uncover income potential. This 2026 STR market report for Mak Khaeng Subdistrict, based on AirROI data from February 2025 to January 2026, reveals key trends in the niche market of 27 active listings.
Whether you're considering an Airbnb investment in Mak Khaeng Subdistrict, optimizing your existing vacation rental, or exploring rental arbitrage opportunities, understanding the Mak Khaeng Subdistrict Airbnb data is crucial. Leveraging the low regulation environment is key to maximizing your short term rental income potential. Let's dive into the specifics.
Key Mak Khaeng Subdistrict Airbnb Performance Metrics Overview
Monthly Airbnb Revenue Variations & Income Potential in Mak Khaeng Subdistrict (2026)
Understanding the monthly revenue variations for Airbnb listings in Mak Khaeng Subdistrict is key to maximizing your short term rental income potential. Seasonality significantly impacts earnings. Our analysis, based on data from the past 12 months, shows that the peak revenue month for STRs in Mak Khaeng Subdistrict is typically October, while July often presents the lowest earnings, highlighting opportunities for strategic pricing adjustments during shoulder and low seasons. Explore the typical Airbnb income in Mak Khaeng Subdistrict across different performance tiers:
- Best-in-class properties (Top 10%) achieve $643+ monthly, often utilizing dynamic pricing and superior guest experiences.
- Strong performing properties (Top 25%) earn $441 or more, indicating effective management and desirable locations/amenities.
- Typical properties (Median) generate around $274 per month, representing the average market performance.
- Entry-level properties (Bottom 25%) see earnings around $128, often with potential for optimization.
Average Monthly Airbnb Earnings Trend in Mak Khaeng Subdistrict
Mak Khaeng Subdistrict Airbnb Occupancy Rate Trends (2026)
Maximize your bookings by understanding the Mak Khaeng Subdistrict STR occupancy trends. Seasonal demand shifts significantly influence how often properties are booked. Typically, Octobersees the highest demand (peak season occupancy), while July experiences the lowest (low season). Effective strategies, like adjusting minimum stays or offering promotions, can boost occupancy during slower periods. Here's how different property tiers perform in Mak Khaeng Subdistrict:
- Best-in-class properties (Top 10%) achieve 82%+ occupancy, indicating high desirability and potentially optimized availability.
- Strong performing properties (Top 25%) maintain 63% or higher occupancy, suggesting good market fit and guest satisfaction.
- Typical properties (Median) have an occupancy rate around 37%.
- Entry-level properties (Bottom 25%) average 18% occupancy, potentially facing higher vacancy.
Average Monthly Occupancy Rate Trend in Mak Khaeng Subdistrict
Average Daily Rate (ADR) Airbnb Trends in Mak Khaeng Subdistrict (2026)
Effective short term rental pricing strategy in Mak Khaeng Subdistrict involves understanding monthly ADR fluctuations. The Average Daily Rate (ADR) for Airbnb in Mak Khaeng Subdistrict typically peaks in August and dips lowest during December. Leveraging Airbnb dynamic pricing tools or strategies based on this seasonality can significantly boost revenue. Here's a look at the typical nightly rates achieved:
- Best-in-class properties (Top 10%) command rates of $64+ per night, often due to premium features or locations.
- Strong performing properties (Top 25%) achieve nightly rates of $32 or more.
- Typical properties (Median) charge around $24 per night.
- Entry-level properties (Bottom 25%) earn around $17 per night.
Average Daily Rate (ADR) Trend by Month in Mak Khaeng Subdistrict
Get Live Mak Khaeng Subdistrict Market Intelligence 👇

Explore Real-time Analytics
Airbnb Seasonality Analysis & Trends in Mak Khaeng Subdistrict (2026)
Peak Season (October, November, December)
- Revenue averages $436 per month
- Occupancy rates average 50.9%
- Daily rates average $28
Shoulder Season
- Revenue averages $319 per month
- Occupancy maintains around 41.4%
- Daily rates hold near $30
Low Season (January, May, July)
- Revenue drops to average $246 per month
- Occupancy decreases to average 32.6%
- Daily rates adjust to average $30
Seasonality Insights for Mak Khaeng Subdistrict
- The Airbnb seasonality in Mak Khaeng Subdistrict shows highly seasonal trends requiring careful strategy. While the sections above show seasonal averages, it's also insightful to look at the extremes:
- During the high season, the absolute peak month showcases Mak Khaeng Subdistrict's highest earning potential, with monthly revenues capable of climbing to $492, occupancy reaching a high of 53.2%, and ADRs peaking at $31.
- Conversely, the slowest single month of the year, typically falling within the low season, marks the market's lowest point. In this month, revenue might dip to $239, occupancy could drop to 28.6%, and ADRs may adjust down to $28.
- Understanding both the seasonal averages and these monthly peaks and troughs in revenue, occupancy, and ADR is crucial for maximizing your Airbnb profit potential in Mak Khaeng Subdistrict.
Seasonal Strategies for Maximizing Profit
- Peak Season: Maximize revenue through premium pricing and potentially longer minimum stays. Ensure high availability.
- Low Season: Offer competitive pricing, special promotions (e.g., extended stay discounts), and flexible cancellation policies. Target off-season travelers like remote workers or budget-conscious guests.
- Shoulder Seasons: Implement dynamic pricing that balances peak and low rates. Target weekend travelers or specific events. Offer slightly more flexible terms than peak season.
- Regularly analyze your own performance against these Mak Khaeng Subdistrict seasonality benchmarks and adjust your pricing and availability strategy accordingly.
Best Areas for Airbnb Investment in Mak Khaeng Subdistrict (2026)
Exploring the top neighborhoods for short-term rentals in Mak Khaeng Subdistrict? This section highlights key areas, outlining why they are attractive for hosts and guests, along with notable local attractions. Consider these locations based on your target guest profile and investment strategy.
| Neighborhood / Area | Why Host Here? (Target Guests & Appeal) | Key Attractions & Landmarks |
|---|---|---|
| Udon Thani City Center | The heart of Udon Thani, offering convenience and accessibility. Ideal for tourists seeking shopping, dining, and cultural experiences. | Central Plaza Udon Thani, Udon Thani Museum, Nong Prajak Park, Thai-Chinese Cultural Center, Srinakharinwirot University |
| Nong Prajak Park | A beautiful public park that attracts both locals and tourists, perfect for nature lovers and families. | Nong Prajak Park, Bicycle Rentals, Outdoor Fitness Areas, Lake Activities, Food Stalls |
| Nong Khai Border | Located near the Laos border, this area is ideal for attracting cross-border travelers and those exploring the region. | Friendship Bridge, Nong Khai Market, Wat Phra That Bang Phuan, Thai-Lao Friendship Bridge Park |
| Ban Phue District | Known for its natural beauty and cultural attractions, appealing to those looking for a quieter, rural experience. | Wat That Phanom, Local Markets, Natural Springs, Rural Homestays |
| Phu Phra Bat Historical Park | A UNESCO World Heritage site with stunning rock formations and ancient history. Attracts history enthusiasts and eco-tourists. | Phu Phra Bat, Cave Temples, Prehistoric Rock Art, Scenic Hiking Trails |
| Nong Bua Lamphu | A peaceful province nearby that appeals to tourists looking for rural Thai culture and tranquil landscapes. | Local Temples, Natural Reserves, Cultural Festivals, Traditional Markets |
| Udon Sunshine | A developing area with modern amenities and family-friendly attractions, great for those seeking a suburban feel. | Udon Sunshine, Amusement Parks, Shopping Complexes, Family Attractions |
| Kham Chanot | A mystical site known for its spiritual significance and beautiful scenery, attracting both local and international tourists. | Kham Chanot Temple, Natural Beauty, Spiritual Retreats |
Understanding Airbnb License Requirements & STR Laws in Mak Khaeng Subdistrict (2026)
While Mak Khaeng Subdistrict, Udon Thani Province, Thailand currently shows low STR regulations, specific Airbnb license requirements might still exist or change. Always verify the latest short term rental regulations and Airbnb license requirements directly with local government authorities for Mak Khaeng Subdistrict to ensure full compliance before hosting.
(Source: AirROI data, 2026, finding no licensed listings among those analyzed)
Top Performing Airbnb Properties in Mak Khaeng Subdistrict (2026)
Benchmark your potential! Explore examples of top-performing Airbnb properties in Mak Khaeng Subdistrictbased on Trailing Twelve Month (TTM) revenue. Analyze their characteristics, revenue, occupancy rate, and ADR to understand what drives success in this market.

1B1B Monochrome Loft @Udonthani
Private Room • 1 bedroom
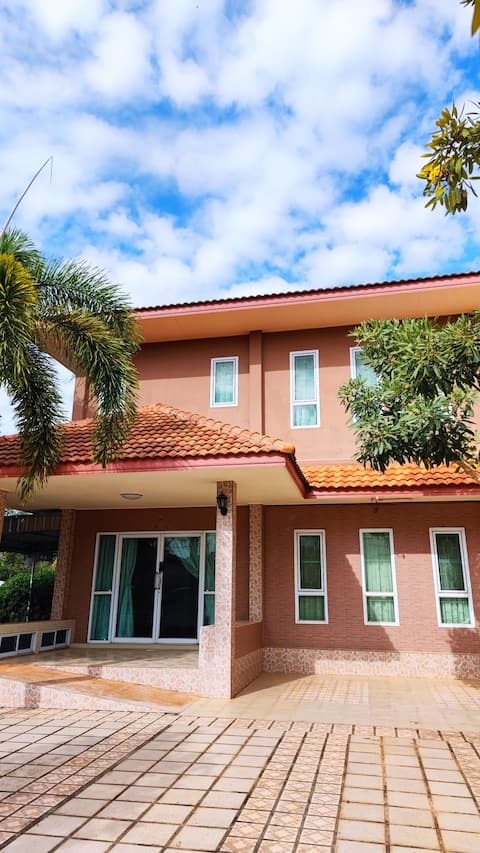
Big whole peaceful house
Entire Place • 3 bedrooms

1BR Hip Luxury Best Pool & Gym
Entire Place • 1 bedroom

Apt in City A 1 bedroom, pool, 2 Air Con Units
Entire Place • 1 bedroom

1 bedroom apartment, living room pool, Gym Laundry
Entire Place • 1 bedroom
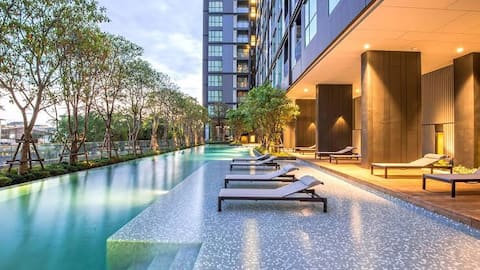
Udon the best pool gym close mall 1 BR
Entire Place • 1 bedroom
Note: Performance varies based on location, size, amenities, seasonality, and management quality. Data reflects the past 12 months.
Top Performing Airbnb Hosts in Mak Khaeng Subdistrict (2026)
Learn from the best! This table showcases top-performing Airbnb hosts in Mak Khaeng Subdistrict based on the number of properties managed and estimated total revenue over the past year. Analyze their scale and performance metrics.
| Host Name | Properties | Grossing Revenue | Stay Reviews | Avg Rating |
|---|---|---|---|---|
| Nannie | 1 | $9,244 | 36 | 4.94/5.0 |
| Charles | 2 | $7,584 | 221 | 4.80/5.0 |
| Warisa | 4 | $7,430 | 46 | 4.75/5.0 |
| Adunsak | 1 | $6,515 | 16 | 4.75/5.0 |
| Gale | 1 | $6,304 | 141 | 4.87/5.0 |
| Bum | 1 | $3,588 | 89 | 4.75/5.0 |
| Nattida | 1 | $3,368 | 31 | 4.94/5.0 |
| Jirawan | 1 | $3,025 | 32 | 4.94/5.0 |
| Nilja | 1 | $2,712 | 6 | 4.83/5.0 |
| Yaneenart | 1 | $2,675 | 7 | 4.71/5.0 |
Analyzing the strategies of top hosts, such as their property selection, pricing, and guest communication, can offer valuable lessons for optimizing your own Airbnb operations in Mak Khaeng Subdistrict.
Dive Deeper: Advanced Mak Khaeng Subdistrict STR Market Data (2026)
Ready to unlock more insights? AirROI provides access to advanced metrics and comprehensive Airbnb data for Mak Khaeng Subdistrict. Explore detailed analytics beyond this report to refine your investment strategy, optimize pricing, and maximize your vacation rental profits.
Explore Advanced MetricsMak Khaeng Subdistrict Short-Term Rental Market Composition (2026): Property & Room Types
Room Type Distribution
Property Type Distribution
Market Composition Insights for Mak Khaeng Subdistrict
- The Mak Khaeng Subdistrict Airbnb market composition is heavily skewed towards Entire Home/Apt listings, which make up 63% of the 27 active rentals. This indicates strong guest preference for privacy and space.
- However, a notable 37% share for Private Rooms suggests opportunities for budget-conscious travelers or hosts renting out spare rooms.
- Looking at the property type distribution in Mak Khaeng Subdistrict, Apartment/Condo properties are the most common (63%), reflecting the local real estate landscape.
- The presence of 18.5% Hotel/Boutique listings indicates integration with traditional hospitality.
- Smaller segments like outdoor/unique, others (combined 7.4%) offer potential for unique stay experiences.
Mak Khaeng Subdistrict Airbnb Room Capacity Analysis (2026): Bedroom Distribution
Distribution of Listings by Number of Bedrooms
Room Capacity Insights for Mak Khaeng Subdistrict
- The dominant room capacity in Mak Khaeng Subdistrict is 1 bedroom listings, making up 66.7% of the market. This suggests a strong demand for properties suitable for couples or solo travelers.
- Together, 1 bedroom and 4 bedrooms properties represent 74.1% of the active Airbnb listings in Mak Khaeng Subdistrict, indicating a high concentration in these sizes.
- With over half the market (66.7%) consisting of studios or 1-bedroom units, Mak Khaeng Subdistrict is particularly well-suited for individuals or couples.
Mak Khaeng Subdistrict Vacation Rental Guest Capacity Trends (2026)
Distribution of Listings by Guest Capacity
Guest Capacity Insights for Mak Khaeng Subdistrict
- The most common guest capacity trend in Mak Khaeng Subdistrict vacation rentals is listings accommodating 2 guests (66.7%). This suggests the primary traveler segment is likely couples or solo travelers.
- Properties designed for 2 guests and 3 guests dominate the Mak Khaeng Subdistrict STR market, accounting for 74.1% of listings.
- A significant 66.7% of listings cater specifically to 1-2 guests, highlighting strong demand from couples and solo travelers in Mak Khaeng Subdistrict.
- Listings for large groups (6+ guests) are relatively rare (3.7%), potentially indicating an opportunity for hosts targeting this segment in Mak Khaeng Subdistrict.
- On average, properties in Mak Khaeng Subdistrict are equipped to host 2.0 guests.
Mak Khaeng Subdistrict Airbnb Booking Patterns (2026): Available vs. Booked Days
Available Days Distribution
Booked Days Distribution
Booking Pattern Insights for Mak Khaeng Subdistrict
- The most common availability pattern in Mak Khaeng Subdistrict falls within the 271-366 days range, representing 51.9% of listings. This suggests many properties have significant open periods on their calendars.
- Approximately 85.2% of listings show high availability (181+ days open annually), indicating potential for increased bookings or specific owner usage patterns.
- For booked days, the 91-180 days range is most frequent in Mak Khaeng Subdistrict (33.3%), reflecting common guest stay durations or potential owner blocking patterns.
- A notable 18.5% of properties secure long booking periods (181+ days booked per year), highlighting successful long-term rental strategies or significant owner usage.
Mak Khaeng Subdistrict Airbnb Minimum Stay Requirements Analysis
Distribution of Listings by Minimum Night Requirement
1 Night
10 listings
37% of total
2 Nights
3 listings
11.1% of total
3 Nights
3 listings
11.1% of total
4-6 Nights
6 listings
22.2% of total
7-29 Nights
3 listings
11.1% of total
30+ Nights
2 listings
7.4% of total
Key Insights
- The most prevalent minimum stay requirement in Mak Khaeng Subdistrict is 1 Night, adopted by 37% of listings. This highlights the market's preference for shorter, flexible bookings.
Recommendations
- Align with the market by considering a 1 Night minimum stay, as 37% of Mak Khaeng Subdistrict hosts use this setting.
- Explore offering discounts for stays of 30+ nights to attract the 7.4% of the market seeking extended stays.
- Adjust minimum nights based on seasonality – potentially shorter during low season and longer during peak demand periods in Mak Khaeng Subdistrict.
Mak Khaeng Subdistrict Airbnb Cancellation Policy Trends Analysis (2026)
Flexible
8 listings
29.6% of total
Moderate
5 listings
18.5% of total
Firm
6 listings
22.2% of total
Strict
8 listings
29.6% of total
Cancellation Policy Insights for Mak Khaeng Subdistrict
- The prevailing Airbnb cancellation policy trend in Mak Khaeng Subdistrict is Flexible, used by 29.6% of listings.
- A majority (51.8%) of hosts in Mak Khaeng Subdistrict utilize Firm or Strict policies, indicating a market where hosts prioritize booking security.
Recommendations for Hosts
- Consider adopting a Flexible policy to align with the 29.6% market standard in Mak Khaeng Subdistrict.
- Regularly review your cancellation policy against competitors and market demand shifts in Mak Khaeng Subdistrict.
Mak Khaeng Subdistrict STR Booking Lead Time Analysis (2026)
Average Booking Lead Time by Month
Booking Lead Time Insights for Mak Khaeng Subdistrict
- The overall average booking lead time for vacation rentals in Mak Khaeng Subdistrict is 26 days.
- Guests book furthest in advance for stays during December (average 69 days), likely coinciding with peak travel demand or local events.
- The shortest booking windows occur for stays in April (average 10 days), indicating more last-minute travel plans during this time.
- Seasonally, Winter (49 days avg.) sees the longest lead times, while Summer (15 days avg.) has the shortest, reflecting typical travel planning cycles.
Recommendations for Hosts
- Use the overall average lead time (26 days) as a baseline for your pricing and availability strategy in Mak Khaeng Subdistrict.
- For December stays, consider implementing length-of-stay discounts or slightly higher rates for bookings made less than 69 days out to capitalize on advance planning.
- During April, focus on last-minute booking availability and promotions, as guests book with very short notice (10 days avg.).
- Target marketing efforts for the Winter season well in advance (at least 49 days) to capture early planners.
- Monitor your own booking lead times against these Mak Khaeng Subdistrict averages to identify opportunities for dynamic pricing adjustments.
Popular & Essential Airbnb Amenities in Mak Khaeng Subdistrict (2026)
Amenity Prevalence
Amenity Insights for Mak Khaeng Subdistrict
- Essential amenities in Mak Khaeng Subdistrict that guests expect include: Wifi, Air conditioning, TV. Lacking these (any) could significantly impact bookings.
- Popular amenities like Shampoo, Smoke alarm, Essentials are common but not universal. Offering these can provide a competitive edge.
Recommendations for Hosts
- Ensure your listing includes all essential amenities for Mak Khaeng Subdistrict: Wifi, Air conditioning, TV.
- Prioritize adding missing essentials: TV.
- Consider adding popular differentiators like Shampoo or Smoke alarm to increase appeal.
- Highlight unique or less common amenities you offer (e.g., hot tub, dedicated workspace, EV charger) in your listing description and photos.
- Regularly check competitor amenities in Mak Khaeng Subdistrict to stay competitive.
Mak Khaeng Subdistrict Airbnb Guest Demographics & Profile Analysis (2026)
Guest Profile Summary for Mak Khaeng Subdistrict
- The typical guest profile for Airbnb in Mak Khaeng Subdistrict consists of predominantly international visitors (97%), with top international origins including Germany, typically belonging to the Post-2000s (Gen Z/Alpha) group (50%), primarily speaking English or German.
- Domestic travelers account for 3.1% of guests.
- Key international markets include United States (17.2%) and Germany (14.1%).
- Top languages spoken are English (46.7%) followed by German (13.3%).
- A significant demographic segment is the Post-2000s (Gen Z/Alpha) group, representing 50% of guests.
Recommendations for Hosts
- Focus marketing internationally, particularly towards travelers from Germany.
- Tailor amenities and listing descriptions to appeal to the dominant Post-2000s (Gen Z/Alpha) demographic (e.g., highlight fast WiFi, smart home features, local guides).
- Highlight unique local experiences or amenities relevant to the primary guest profile.
- Consider seasonal promotions aligned with peak travel times for key origin markets.
Nearby Short-Term Rental Market Comparison
How does the Mak Khaeng Subdistrict Airbnb market stack up against its neighbors? Compare key performance metrics like average monthly revenue, ADR, and occupancy rates in surrounding areas to understand the broader regional STR landscape.
| Market | Active Properties | Monthly Revenue | Daily Rate | Avg. Occupancy |
|---|---|---|---|---|
| Vientiane Capital | 156 | $335 | $46.99 | 37% |
| Vientiane | 20 | $266 | $29.40 | 43% |
| Khon Kaen City Municipality | 13 | $228 | $41.88 | 31% |
| Khon Kaen | 23 | $217 | $33.64 | 32% |
| Chiang Khan | 10 | $154 | $112.14 | 14% |
| Vang Vieng | 18 | $149 | $40.60 | 17% |