Baan Klong Son Airbnb Market Analysis 2026: Short Term Rental Data & Vacation Rental Statistics in Trat Province, Thailand
Is Airbnb profitable in Baan Klong Son in 2026? Explore comprehensive Airbnb analytics for Baan Klong Son, Trat Province, Thailand to uncover income potential. This 2026 STR market report for Baan Klong Son, based on AirROI data from February 2025 to January 2026, reveals key trends in the niche market of 124 active listings.
Whether you're considering an Airbnb investment in Baan Klong Son, optimizing your existing vacation rental, or exploring rental arbitrage opportunities, understanding the Baan Klong Son Airbnb data is crucial. Leveraging the low regulation environment is key to maximizing your short term rental income potential. Let's dive into the specifics.
Key Baan Klong Son Airbnb Performance Metrics Overview
Monthly Airbnb Revenue Variations & Income Potential in Baan Klong Son (2026)
Understanding the monthly revenue variations for Airbnb listings in Baan Klong Son is key to maximizing your short term rental income potential. Seasonality significantly impacts earnings. Our analysis, based on data from the past 12 months, shows that the peak revenue month for STRs in Baan Klong Son is typically February, while June often presents the lowest earnings, highlighting opportunities for strategic pricing adjustments during shoulder and low seasons. Explore the typical Airbnb income in Baan Klong Son across different performance tiers:
- Best-in-class properties (Top 10%) achieve $4,950+ monthly, often utilizing dynamic pricing and superior guest experiences.
- Strong performing properties (Top 25%) earn $3,006 or more, indicating effective management and desirable locations/amenities.
- Typical properties (Median) generate around $1,676 per month, representing the average market performance.
- Entry-level properties (Bottom 25%) see earnings around $730, often with potential for optimization.
Average Monthly Airbnb Earnings Trend in Baan Klong Son
Baan Klong Son Airbnb Occupancy Rate Trends (2026)
Maximize your bookings by understanding the Baan Klong Son STR occupancy trends. Seasonal demand shifts significantly influence how often properties are booked. Typically, Februarysees the highest demand (peak season occupancy), while June experiences the lowest (low season). Effective strategies, like adjusting minimum stays or offering promotions, can boost occupancy during slower periods. Here's how different property tiers perform in Baan Klong Son:
- Best-in-class properties (Top 10%) achieve 72%+ occupancy, indicating high desirability and potentially optimized availability.
- Strong performing properties (Top 25%) maintain 52% or higher occupancy, suggesting good market fit and guest satisfaction.
- Typical properties (Median) have an occupancy rate around 31%.
- Entry-level properties (Bottom 25%) average 16% occupancy, potentially facing higher vacancy.
Average Monthly Occupancy Rate Trend in Baan Klong Son
Average Daily Rate (ADR) Airbnb Trends in Baan Klong Son (2026)
Effective short term rental pricing strategy in Baan Klong Son involves understanding monthly ADR fluctuations. The Average Daily Rate (ADR) for Airbnb in Baan Klong Son typically peaks in January and dips lowest during August. Leveraging Airbnb dynamic pricing tools or strategies based on this seasonality can significantly boost revenue. Here's a look at the typical nightly rates achieved:
- Best-in-class properties (Top 10%) command rates of $345+ per night, often due to premium features or locations.
- Strong performing properties (Top 25%) achieve nightly rates of $274 or more.
- Typical properties (Median) charge around $189 per night.
- Entry-level properties (Bottom 25%) earn around $87 per night.
Average Daily Rate (ADR) Trend by Month in Baan Klong Son
Get Live Baan Klong Son Market Intelligence 👇

Explore Real-time Analytics
Airbnb Seasonality Analysis & Trends in Baan Klong Son (2026)
Peak Season (February, March, April)
- Revenue averages $3,312 per month
- Occupancy rates average 53.1%
- Daily rates average $205
Shoulder Season
- Revenue averages $2,091 per month
- Occupancy maintains around 32.2%
- Daily rates hold near $210
Low Season (May, June, September)
- Revenue drops to average $1,509 per month
- Occupancy decreases to average 25.4%
- Daily rates adjust to average $185
Seasonality Insights for Baan Klong Son
- The Airbnb seasonality in Baan Klong Son shows highly seasonal trends requiring careful strategy. While the sections above show seasonal averages, it's also insightful to look at the extremes:
- During the high season, the absolute peak month showcases Baan Klong Son's highest earning potential, with monthly revenues capable of climbing to $3,942, occupancy reaching a high of 65.1%, and ADRs peaking at $245.
- Conversely, the slowest single month of the year, typically falling within the low season, marks the market's lowest point. In this month, revenue might dip to $1,320, occupancy could drop to 23.8%, and ADRs may adjust down to $180.
- Understanding both the seasonal averages and these monthly peaks and troughs in revenue, occupancy, and ADR is crucial for maximizing your Airbnb profit potential in Baan Klong Son.
Seasonal Strategies for Maximizing Profit
- Peak Season: Maximize revenue through premium pricing and potentially longer minimum stays. Ensure high availability.
- Low Season: Offer competitive pricing, special promotions (e.g., extended stay discounts), and flexible cancellation policies. Target off-season travelers like remote workers or budget-conscious guests.
- Shoulder Seasons: Implement dynamic pricing that balances peak and low rates. Target weekend travelers or specific events. Offer slightly more flexible terms than peak season.
- Regularly analyze your own performance against these Baan Klong Son seasonality benchmarks and adjust your pricing and availability strategy accordingly.
Best Areas for Airbnb Investment in Baan Klong Son (2026)
Exploring the top neighborhoods for short-term rentals in Baan Klong Son? This section highlights key areas, outlining why they are attractive for hosts and guests, along with notable local attractions. Consider these locations based on your target guest profile and investment strategy.
| Neighborhood / Area | Why Host Here? (Target Guests & Appeal) | Key Attractions & Landmarks |
|---|---|---|
| Klong Son Beach | A serene beach destination with clear waters, ideal for relaxation and water activities. Popular amongst tourists looking for a peaceful getaway. | Klong Son Beach, Koh Chang National Park, Mu Ko Chang National Park, Snorkeling and diving spots, Local seafood restaurants |
| Koh Chang | Thailand's second largest island known for its beautiful beaches, lush jungles, and vibrant nightlife. A hotspot for travelers seeking adventure and relaxation. | White Sand Beach, Lonely Beach, Koh Chang Waterfall, Bangbao Fishing Village, Koh Chang National Park |
| Koh Mak | A small, tranquil island that offers a peaceful escape with fewer tourists, making it perfect for those looking to unwind in nature. | Koh Mak Beach, Koh Mak Wildlife Sanctuary, Wreck diving sites, Biking around the island, Local beach bars and restaurants |
| Koh Kood | One of Thailand's hidden gems with primal beauty and secluded beaches. Appeals to travelers aiming for exclusivity and nature experiences. | Ao Phra Sawang Beach, Klong Chao Beach, Koh Kood Waterfall, Ta Pho Beach, Fishing villages |
| Bang Bao | A charming fishing village known for its picturesque views and unique wooden pier structure, attracting visitors seeking local culture and seafood. | Bang Bao Pier, Seafood markets, Traditional Thai restaurants, Fishing tours, Boat trips to nearby islands |
| Thammachat Pier | A vital port for ferry services to nearby islands, making it a strategic location for travelers heading to Koh Chang and beyond. | Thammachat Pier, Local food stalls, Transportation hub for island hopping, Beach access nearby, Scenic views |
| Koh Kood's Ao Salad | A laid-back beach area with stunning sunsets and local charm, sought after by tourists looking for relaxation away from crowded spots. | Ao Salad Beach, Local fishing boats, Relaxing beach bars, Sunset watching, kayaking opportunities |
| Trat Town | The capital of Trat Province that offers a mix of local culture, markets, and easy access to the islands, appealing to both short-term and long-term travelers. | Trat Night Market, Local temples, Historical sites, Restaurants serving local cuisine, Access to ferry services |
Understanding Airbnb License Requirements & STR Laws in Baan Klong Son (2026)
While Baan Klong Son, Trat Province, Thailand currently shows low STR regulations, specific Airbnb license requirements might still exist or change. Always verify the latest short term rental regulations and Airbnb license requirements directly with local government authorities for Baan Klong Son to ensure full compliance before hosting.
(Source: AirROI data, 2026, finding no licensed listings among those analyzed)
Top Performing Airbnb Properties in Baan Klong Son (2026)
Benchmark your potential! Explore examples of top-performing Airbnb properties in Baan Klong Sonbased on Trailing Twelve Month (TTM) revenue. Analyze their characteristics, revenue, occupancy rate, and ADR to understand what drives success in this market.

Nirvana Villa by Utalay Koh Chang
Entire Place • 5 bedrooms
Beachfront 5-bedroom Villa - by KohChangVillas
Entire Place • 5 bedrooms

Villa Manipura, beachfront with pool
Entire Place • 3 bedrooms

Private pool and beach/sea view - siam sunset 2D
Entire Place • 4 bedrooms
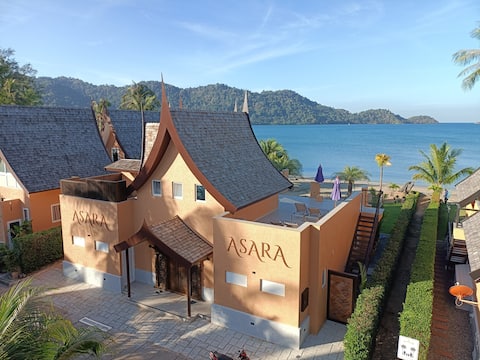
ASARA Beach-Pool Villa (Absolut Beachfront)
Entire Place • 5 bedrooms

Amore Villa by Utalay Koh Chang
Entire Place • 4 bedrooms
Note: Performance varies based on location, size, amenities, seasonality, and management quality. Data reflects the past 12 months.
Top Performing Airbnb Hosts in Baan Klong Son (2026)
Learn from the best! This table showcases top-performing Airbnb hosts in Baan Klong Son based on the number of properties managed and estimated total revenue over the past year. Analyze their scale and performance metrics.
| Host Name | Properties | Grossing Revenue | Stay Reviews | Avg Rating |
|---|---|---|---|---|
| Marina | 12 | $333,485 | 180 | 4.73/5.0 |
| Roland | 17 | $224,389 | 277 | 4.82/5.0 |
| Rongrit | 11 | $179,472 | 63 | 4.65/5.0 |
| Frederik Kjaer | 3 | $174,196 | 84 | 4.90/5.0 |
| Sammy Oscar | 9 | $162,370 | 24 | 4.77/5.0 |
| Clemens | 2 | $79,735 | 103 | 4.80/5.0 |
| Christian | 3 | $75,359 | 40 | 4.78/5.0 |
| Bo | 2 | $69,013 | 93 | 4.88/5.0 |
| Zdenek | 5 | $67,837 | 104 | 4.92/5.0 |
| Chris | 1 | $64,824 | 45 | 4.84/5.0 |
Analyzing the strategies of top hosts, such as their property selection, pricing, and guest communication, can offer valuable lessons for optimizing your own Airbnb operations in Baan Klong Son.
Dive Deeper: Advanced Baan Klong Son STR Market Data (2026)
Ready to unlock more insights? AirROI provides access to advanced metrics and comprehensive Airbnb data for Baan Klong Son. Explore detailed analytics beyond this report to refine your investment strategy, optimize pricing, and maximize your vacation rental profits.
Explore Advanced MetricsBaan Klong Son Short-Term Rental Market Composition (2026): Property & Room Types
Room Type Distribution
Property Type Distribution
Market Composition Insights for Baan Klong Son
- The Baan Klong Son Airbnb market composition is heavily skewed towards Entire Home/Apt listings, which make up 78.2% of the 124 active rentals. This indicates strong guest preference for privacy and space.
- Looking at the property type distribution in Baan Klong Son, House properties are the most common (71.8%), reflecting the local real estate landscape.
- Houses represent a significant 71.8% portion, catering likely to families or larger groups.
- The presence of 14.5% Hotel/Boutique listings indicates integration with traditional hospitality.
- Smaller segments like outdoor/unique (combined 2.4%) offer potential for unique stay experiences.
Baan Klong Son Airbnb Room Capacity Analysis (2026): Bedroom Distribution
Distribution of Listings by Number of Bedrooms
Room Capacity Insights for Baan Klong Son
- The dominant room capacity in Baan Klong Son is 4 bedrooms listings, making up 30.6% of the market. This suggests a strong demand for properties suitable for families or small groups.
- Together, 4 bedrooms and 3 bedrooms properties represent 54.8% of the active Airbnb listings in Baan Klong Son, indicating a high concentration in these sizes.
- A significant 60.4% of listings offer 3+ bedrooms, catering to larger groups and families seeking more space in Baan Klong Son.
Baan Klong Son Vacation Rental Guest Capacity Trends (2026)
Distribution of Listings by Guest Capacity
Guest Capacity Insights for Baan Klong Son
- The most common guest capacity trend in Baan Klong Son vacation rentals is listings accommodating 8+ guests (38.7%). This suggests the primary traveler segment is likely larger groups.
- Properties designed for 8+ guests and 6 guests dominate the Baan Klong Son STR market, accounting for 58.9% of listings.
- 60.5% of properties accommodate 6+ guests, serving the market segment for larger families or group travel in Baan Klong Son.
- On average, properties in Baan Klong Son are equipped to host 5.3 guests.
Baan Klong Son Airbnb Booking Patterns (2026): Available vs. Booked Days
Available Days Distribution
Booked Days Distribution
Booking Pattern Insights for Baan Klong Son
- The most common availability pattern in Baan Klong Son falls within the 271-366 days range, representing 70.2% of listings. This suggests many properties have significant open periods on their calendars.
- Approximately 92.0% of listings show high availability (181+ days open annually), indicating potential for increased bookings or specific owner usage patterns.
- For booked days, the 31-90 days range is most frequent in Baan Klong Son (37.1%), reflecting common guest stay durations or potential owner blocking patterns.
- A notable 11.3% of properties secure long booking periods (181+ days booked per year), highlighting successful long-term rental strategies or significant owner usage.
Baan Klong Son Airbnb Minimum Stay Requirements Analysis
Distribution of Listings by Minimum Night Requirement
1 Night
18 listings
14.5% of total
2 Nights
28 listings
22.6% of total
3 Nights
15 listings
12.1% of total
4-6 Nights
7 listings
5.6% of total
7-29 Nights
4 listings
3.2% of total
30+ Nights
52 listings
41.9% of total
Key Insights
- The most prevalent minimum stay requirement in Baan Klong Son is 30+ Nights, adopted by 41.9% of listings. This highlights the market's preference for longer commitments.
- A significant segment (41.9%) caters to monthly stays (30+ nights) in Baan Klong Son, pointing to opportunities in the extended-stay market.
Recommendations
- Align with the market by considering a 30+ Nights minimum stay, as 41.9% of Baan Klong Son hosts use this setting.
- If feasible, allowing 1-night stays, especially midweek or during low season, could capture last-minute bookings, as only 14.5% currently do.
- Explore offering discounts for stays of 30+ nights to attract the 41.9% of the market seeking extended stays.
- Adjust minimum nights based on seasonality – potentially shorter during low season and longer during peak demand periods in Baan Klong Son.
Baan Klong Son Airbnb Cancellation Policy Trends Analysis (2026)
Super Strict 30 Days
3 listings
2.4% of total
Super Strict 60 Days
4 listings
3.3% of total
Flexible
18 listings
14.6% of total
Moderate
2 listings
1.6% of total
Firm
54 listings
43.9% of total
Strict
42 listings
34.1% of total
Cancellation Policy Insights for Baan Klong Son
- The prevailing Airbnb cancellation policy trend in Baan Klong Son is Firm, used by 43.9% of listings.
- A majority (78.0%) of hosts in Baan Klong Son utilize Firm or Strict policies, indicating a market where hosts prioritize booking security.
Recommendations for Hosts
- Consider adopting a Firm policy to align with the 43.9% market standard in Baan Klong Son.
- With 34.1% using Strict terms, this is a viable option in Baan Klong Son, particularly for high-value properties or during peak demand periods.
- Regularly review your cancellation policy against competitors and market demand shifts in Baan Klong Son.
Baan Klong Son STR Booking Lead Time Analysis (2026)
Average Booking Lead Time by Month
Booking Lead Time Insights for Baan Klong Son
- The overall average booking lead time for vacation rentals in Baan Klong Son is 65 days.
- Guests book furthest in advance for stays during December (average 100 days), likely coinciding with peak travel demand or local events.
- The shortest booking windows occur for stays in June (average 32 days), indicating more last-minute travel plans during this time.
- Seasonally, Winter (89 days avg.) sees the longest lead times, while Summer (46 days avg.) has the shortest, reflecting typical travel planning cycles.
Recommendations for Hosts
- Use the overall average lead time (65 days) as a baseline for your pricing and availability strategy in Baan Klong Son.
- For December stays, consider implementing length-of-stay discounts or slightly higher rates for bookings made less than 100 days out to capitalize on advance planning.
- Target marketing efforts for the Winter season well in advance (at least 89 days) to capture early planners.
- Monitor your own booking lead times against these Baan Klong Son averages to identify opportunities for dynamic pricing adjustments.
Popular & Essential Airbnb Amenities in Baan Klong Son (2026)
Amenity Prevalence
Amenity Insights for Baan Klong Son
- Essential amenities in Baan Klong Son that guests expect include: Wifi, Air conditioning. Lacking these (any) could significantly impact bookings.
- Popular amenities like TV, Free parking on premises, Essentials are common but not universal. Offering these can provide a competitive edge.
Recommendations for Hosts
- Ensure your listing includes all essential amenities for Baan Klong Son: Wifi, Air conditioning.
- Prioritize adding missing essentials: Air conditioning.
- Consider adding popular differentiators like TV or Free parking on premises to increase appeal.
- Highlight unique or less common amenities you offer (e.g., hot tub, dedicated workspace, EV charger) in your listing description and photos.
- Regularly check competitor amenities in Baan Klong Son to stay competitive.
Baan Klong Son Airbnb Guest Demographics & Profile Analysis (2026)
Guest Profile Summary for Baan Klong Son
- The typical guest profile for Airbnb in Baan Klong Son consists of predominantly international visitors (88%), with top international origins including Thailand, typically belonging to the Post-2000s (Gen Z/Alpha) group (50%), primarily speaking English or German.
- Domestic travelers account for 12.3% of guests.
- Key international markets include Germany (17.9%) and Thailand (12.3%).
- Top languages spoken are English (40.4%) followed by German (16.8%).
- A significant demographic segment is the Post-2000s (Gen Z/Alpha) group, representing 50% of guests.
Recommendations for Hosts
- Focus marketing internationally, particularly towards travelers from Thailand.
- Tailor amenities and listing descriptions to appeal to the dominant Post-2000s (Gen Z/Alpha) demographic (e.g., highlight fast WiFi, smart home features, local guides).
- Highlight unique local experiences or amenities relevant to the primary guest profile.
- Consider seasonal promotions aligned with peak travel times for key origin markets.
Nearby Short-Term Rental Market Comparison
How does the Baan Klong Son Airbnb market stack up against its neighbors? Compare key performance metrics like average monthly revenue, ADR, and occupancy rates in surrounding areas to understand the broader regional STR landscape.
| Market | Active Properties | Monthly Revenue | Daily Rate | Avg. Occupancy |
|---|---|---|---|---|
| Haad Khlong Chao | 14 | $1,164 | $136.34 | 31% |
| Sai Thong | 13 | $635 | $75.04 | 40% |
| Hat Khai Muk | 46 | $572 | $97.50 | 30% |
| Klaeng Kachet | 32 | $568 | $103.45 | 27% |
| Baan Dan Mai | 26 | $555 | $112.23 | 32% |
| Prasat Bakong District | 15 | $492 | $100.94 | 26% |
| Baan Klong Prao | 41 | $485 | $70.85 | 40% |
| Ao Noi Na | 10 | $476 | $88.70 | 24% |
| Baan Bai Lan | 47 | $467 | $81.90 | 36% |
| Haad Taphao | 14 | $459 | $129.58 | 21% |