Ko Samui District Airbnb Market Analysis 2026: Short Term Rental Data & Vacation Rental Statistics in Surat Thani, Thailand
Is Airbnb profitable in Ko Samui District in 2026? Explore comprehensive Airbnb analytics for Ko Samui District, Surat Thani, Thailand to uncover income potential. This 2026 STR market report for Ko Samui District, based on AirROI data from February 2025 to January 2026, reveals key trends in the niche market of 48 active listings.
Whether you're considering an Airbnb investment in Ko Samui District, optimizing your existing vacation rental, or exploring rental arbitrage opportunities, understanding the Ko Samui District Airbnb data is crucial. Leveraging the low regulation environment is key to maximizing your short term rental income potential. Let's dive into the specifics.
Key Ko Samui District Airbnb Performance Metrics Overview
Monthly Airbnb Revenue Variations & Income Potential in Ko Samui District (2026)
Understanding the monthly revenue variations for Airbnb listings in Ko Samui District is key to maximizing your short term rental income potential. Seasonality significantly impacts earnings. Our analysis, based on data from the past 12 months, shows that the peak revenue month for STRs in Ko Samui District is typically December, while May often presents the lowest earnings, highlighting opportunities for strategic pricing adjustments during shoulder and low seasons. Explore the typical Airbnb income in Ko Samui District across different performance tiers:
- Best-in-class properties (Top 10%) achieve $10,124+ monthly, often utilizing dynamic pricing and superior guest experiences.
- Strong performing properties (Top 25%) earn $4,422 or more, indicating effective management and desirable locations/amenities.
- Typical properties (Median) generate around $1,824 per month, representing the average market performance.
- Entry-level properties (Bottom 25%) see earnings around $768, often with potential for optimization.
Average Monthly Airbnb Earnings Trend in Ko Samui District
Ko Samui District Airbnb Occupancy Rate Trends (2026)
Maximize your bookings by understanding the Ko Samui District STR occupancy trends. Seasonal demand shifts significantly influence how often properties are booked. Typically, Augustsees the highest demand (peak season occupancy), while May experiences the lowest (low season). Effective strategies, like adjusting minimum stays or offering promotions, can boost occupancy during slower periods. Here's how different property tiers perform in Ko Samui District:
- Best-in-class properties (Top 10%) achieve 78%+ occupancy, indicating high desirability and potentially optimized availability.
- Strong performing properties (Top 25%) maintain 63% or higher occupancy, suggesting good market fit and guest satisfaction.
- Typical properties (Median) have an occupancy rate around 36%.
- Entry-level properties (Bottom 25%) average 19% occupancy, potentially facing higher vacancy.
Average Monthly Occupancy Rate Trend in Ko Samui District
Average Daily Rate (ADR) Airbnb Trends in Ko Samui District (2026)
Effective short term rental pricing strategy in Ko Samui District involves understanding monthly ADR fluctuations. The Average Daily Rate (ADR) for Airbnb in Ko Samui District typically peaks in January and dips lowest during August. Leveraging Airbnb dynamic pricing tools or strategies based on this seasonality can significantly boost revenue. Here's a look at the typical nightly rates achieved:
- Best-in-class properties (Top 10%) command rates of $554+ per night, often due to premium features or locations.
- Strong performing properties (Top 25%) achieve nightly rates of $255 or more.
- Typical properties (Median) charge around $135 per night.
- Entry-level properties (Bottom 25%) earn around $58 per night.
Average Daily Rate (ADR) Trend by Month in Ko Samui District
Get Live Ko Samui District Market Intelligence 👇
Explore Real-time Analytics
Airbnb Seasonality Analysis & Trends in Ko Samui District (2026)
Peak Season (December, November, August)
- Revenue averages $5,157 per month
- Occupancy rates average 50.3%
- Daily rates average $249
Shoulder Season
- Revenue averages $3,073 per month
- Occupancy maintains around 36.8%
- Daily rates hold near $249
Low Season (February, March, April)
- Revenue drops to average $0 per month
- Occupancy decreases to average 0.0%
- Daily rates adjust to average $239
Seasonality Insights for Ko Samui District
- The Airbnb seasonality in Ko Samui District shows highly seasonal trends requiring careful strategy. While the sections above show seasonal averages, it's also insightful to look at the extremes:
- During the high season, the absolute peak month showcases Ko Samui District's highest earning potential, with monthly revenues capable of climbing to $6,302, occupancy reaching a high of 57.3%, and ADRs peaking at $337.
- Conversely, the slowest single month of the year, typically falling within the low season, marks the market's lowest point. In this month, revenue might dip to $0, occupancy could drop to 0.0%, and ADRs may adjust down to $222.
- Understanding both the seasonal averages and these monthly peaks and troughs in revenue, occupancy, and ADR is crucial for maximizing your Airbnb profit potential in Ko Samui District.
Seasonal Strategies for Maximizing Profit
- Peak Season: Maximize revenue through premium pricing and potentially longer minimum stays. Ensure high availability.
- Low Season: Offer competitive pricing, special promotions (e.g., extended stay discounts), and flexible cancellation policies. Target off-season travelers like remote workers or budget-conscious guests.
- Shoulder Seasons: Implement dynamic pricing that balances peak and low rates. Target weekend travelers or specific events. Offer slightly more flexible terms than peak season.
- Regularly analyze your own performance against these Ko Samui District seasonality benchmarks and adjust your pricing and availability strategy accordingly.
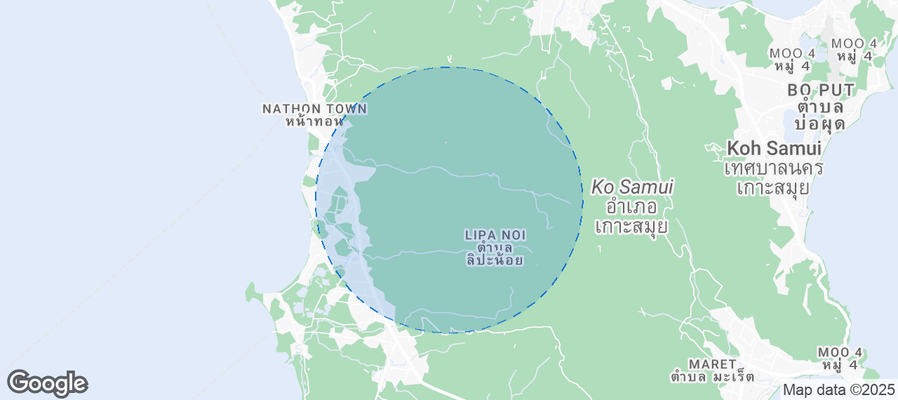
Best Areas for Airbnb Investment in Ko Samui District (2026)
Exploring the top neighborhoods for short-term rentals in Ko Samui District? This section highlights key areas, outlining why they are attractive for hosts and guests, along with notable local attractions. Consider these locations based on your target guest profile and investment strategy.
| Neighborhood / Area | Why Host Here? (Target Guests & Appeal) | Key Attractions & Landmarks |
|---|---|---|
| Chaweng Beach | Chaweng is the most popular beach on the island, known for its vibrant nightlife, shopping, and dining options. It attracts a large number of tourists looking for a mix of relaxation and entertainment. | Chaweng Beach, Central Festival Samui, Black Moon Culture, Ark Bar, Chaweng Walking Street |
| Lamai Beach | Lamai Beach is quieter than Chaweng but still offers great restaurants and bars with a laid-back atmosphere. Ideal for families and couples seeking relaxation. | Lamai Beach, Hin Ta and Hin Yai Rocks, Lamai Night Plaza, Wat Khunaram, Grandfather and Grandmother Rocks |
| Bophut | Bophut is famous for its charming Fisherman’s Village, a blend of traditional Thai and modern amenities. It is popular among tourists looking for a more authentic experience. | Fisherman’s Village, Bophut Beach, Night Market, Bophut Hills, Wat Bophut |
| Maenam | Maenam offers a more serene environment with a beautiful beach, it's ideal for those looking for a quiet getaway. It's popular among long-term travelers and families. | Maenam Beach, Maenam Walking Street, Wat Na Phra Lan, Chinese Temple, Coconut Palm Beach |
| Nathon | Nathon is the main port town of Koh Samui and offers a more local experience. It's great for those who want to explore local culture and cuisine. | Nathon Pier, Nathon Market, Wat Khunaram, Hin Lad Waterfall, Chinese Temple |
| Bang Po | Bang Po is known for its quiet beaches and stunning sunset views. It's popular among travelers seeking peace and tranquility. | Bang Po Beach, Santi Phap Waterfall, Wat Phu Khao Thong, Miskawaan Health Group, Bang Po Fishing Village |
| Taling Ngam | Taling Ngam offers some of the most beautiful beaches and is less touristy, making it ideal for upscale guests looking for luxury and privacy. | Taling Ngam Beach, Lamai Viewpoint, Nikki Beach, Wat Khao Chedi, Sang Sang Beach']},{ |
Understanding Airbnb License Requirements & STR Laws in Ko Samui District (2026)
While Ko Samui District, Surat Thani, Thailand currently shows low STR regulations, specific Airbnb license requirements might still exist or change. Always verify the latest short term rental regulations and Airbnb license requirements directly with local government authorities for Ko Samui District to ensure full compliance before hosting.
(Source: AirROI data, 2026, finding no licensed listings among those analyzed)
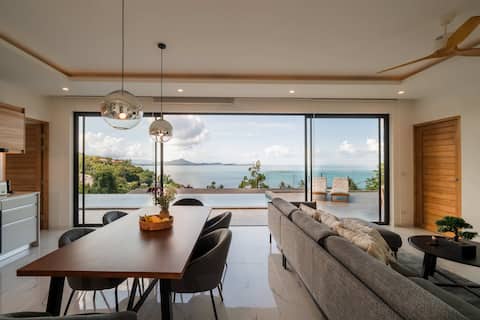
Top Performing Airbnb Properties in Ko Samui District (2026)
Benchmark your potential! Explore examples of top-performing Airbnb properties in Ko Samui Districtbased on Trailing Twelve Month (TTM) revenue. Analyze their characteristics, revenue, occupancy rate, and ADR to understand what drives success in this market.
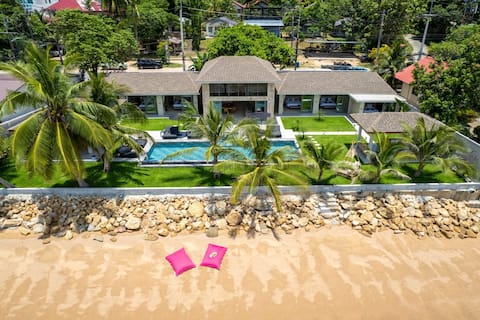
Luxury Private Beachfront Villa Fisherman Village
Entire Place • 6 bedrooms
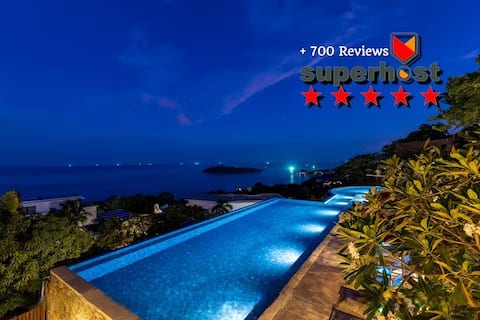
Amaze seaview Villa at Chaweng | 40m Pool
Entire Place • 8 bedrooms

Luxury 6 bedroom beachfront villa. Ko Samui
Entire Place • 6 bedrooms
Staylar Seaview Pool Villa - Coral Cove, Samui CC6
Entire Place • 5 bedrooms
Villa Sea Stone @BV Estates
Entire Place • 3 bedrooms
*3BR Sea View, Infinity Pool and Open Living V196
Entire Place • 3 bedrooms
Note: Performance varies based on location, size, amenities, seasonality, and management quality. Data reflects the past 12 months.
Top Performing Airbnb Hosts in Ko Samui District (2026)
Learn from the best! This table showcases top-performing Airbnb hosts in Ko Samui District based on the number of properties managed and estimated total revenue over the past year. Analyze their scale and performance metrics.
| Host Name | Properties | Grossing Revenue | Stay Reviews | Avg Rating |
|---|---|---|---|---|
| Vanessa | 1 | $142,060 | 5 | 5.00/5.0 |
| Luxy Samui | 1 | $139,913 | 12 | 5.00/5.0 |
| Staylar Villas | 2 | $98,709 | 28 | 4.81/5.0 |
| Siam-CS Management | 4 | $90,700 | 33 | 4.64/5.0 |
| Guillaume | 1 | $79,417 | 1 | Not Rated |
| Anna | 2 | $62,604 | 9 | 5.00/5.0 |
| Inter Property | 1 | $54,135 | 9 | 4.89/5.0 |
| Delphine | 2 | $41,837 | 16 | 5.00/5.0 |
| Emmanuel | 1 | $39,404 | 14 | 5.00/5.0 |
| Sarah | 1 | $35,252 | 14 | 4.79/5.0 |
Analyzing the strategies of top hosts, such as their property selection, pricing, and guest communication, can offer valuable lessons for optimizing your own Airbnb operations in Ko Samui District.
Dive Deeper: Advanced Ko Samui District STR Market Data (2026)
Ready to unlock more insights? AirROI provides access to advanced metrics and comprehensive Airbnb data for Ko Samui District. Explore detailed analytics beyond this report to refine your investment strategy, optimize pricing, and maximize your vacation rental profits.
Explore Advanced MetricsKo Samui District Short-Term Rental Market Composition (2026): Property & Room Types
Room Type Distribution
Property Type Distribution
Market Composition Insights for Ko Samui District
- The Ko Samui District Airbnb market composition is heavily skewed towards Entire Home/Apt listings, which make up 85.4% of the 48 active rentals. This indicates strong guest preference for privacy and space.
- Looking at the property type distribution in Ko Samui District, House properties are the most common (75%), reflecting the local real estate landscape.
- Houses represent a significant 75% portion, catering likely to families or larger groups.
- The presence of 8.3% Hotel/Boutique listings indicates integration with traditional hospitality.
- Smaller segments like outdoor/unique (combined 2.1%) offer potential for unique stay experiences.
Ko Samui District Airbnb Room Capacity Analysis (2026): Bedroom Distribution
Distribution of Listings by Number of Bedrooms
Room Capacity Insights for Ko Samui District
- The dominant room capacity in Ko Samui District is 3 bedrooms listings, making up 27.1% of the market. This suggests a strong demand for properties suitable for families or small groups.
- Together, 3 bedrooms and 1 bedroom properties represent 54.2% of the active Airbnb listings in Ko Samui District, indicating a high concentration in these sizes.
- A significant 41.7% of listings offer 3+ bedrooms, catering to larger groups and families seeking more space in Ko Samui District.
Ko Samui District Vacation Rental Guest Capacity Trends (2026)
Distribution of Listings by Guest Capacity
Guest Capacity Insights for Ko Samui District
- The most common guest capacity trend in Ko Samui District vacation rentals is listings accommodating 6 guests (27.1%). This suggests the primary traveler segment is likely larger groups.
- Properties designed for 6 guests and 4 guests dominate the Ko Samui District STR market, accounting for 52.1% of listings.
- 41.7% of properties accommodate 6+ guests, serving the market segment for larger families or group travel in Ko Samui District.
- On average, properties in Ko Samui District are equipped to host 4.5 guests.
Ko Samui District Airbnb Booking Patterns (2026): Available vs. Booked Days
Available Days Distribution
Booked Days Distribution
Booking Pattern Insights for Ko Samui District
- The most common availability pattern in Ko Samui District falls within the 271-366 days range, representing 66.7% of listings. This suggests many properties have significant open periods on their calendars.
- Approximately 95.9% of listings show high availability (181+ days open annually), indicating potential for increased bookings or specific owner usage patterns.
- For booked days, the 31-90 days range is most frequent in Ko Samui District (35.4%), reflecting common guest stay durations or potential owner blocking patterns.
- A notable 4.2% of properties secure long booking periods (181+ days booked per year), highlighting successful long-term rental strategies or significant owner usage.
Ko Samui District Airbnb Minimum Stay Requirements Analysis
Distribution of Listings by Minimum Night Requirement
1 Night
11 listings
22.9% of total
2 Nights
6 listings
12.5% of total
3 Nights
8 listings
16.7% of total
4-6 Nights
3 listings
6.3% of total
7-29 Nights
5 listings
10.4% of total
30+ Nights
15 listings
31.3% of total
Key Insights
- The most prevalent minimum stay requirement in Ko Samui District is 30+ Nights, adopted by 31.3% of listings. This highlights the market's preference for longer commitments.
- A significant segment (31.3%) caters to monthly stays (30+ nights) in Ko Samui District, pointing to opportunities in the extended-stay market.
Recommendations
- Align with the market by considering a 30+ Nights minimum stay, as 31.3% of Ko Samui District hosts use this setting.
- If feasible, allowing 1-night stays, especially midweek or during low season, could capture last-minute bookings, as only 22.9% currently do.
- Explore offering discounts for stays of 30+ nights to attract the 31.3% of the market seeking extended stays.
- Adjust minimum nights based on seasonality – potentially shorter during low season and longer during peak demand periods in Ko Samui District.
Ko Samui District Airbnb Cancellation Policy Trends Analysis (2026)
Limited
3 listings
6.3% of total
Super Strict 60 Days
2 listings
4.2% of total
Flexible
7 listings
14.6% of total
Moderate
5 listings
10.4% of total
Firm
19 listings
39.6% of total
Strict
12 listings
25% of total
Cancellation Policy Insights for Ko Samui District
- The prevailing Airbnb cancellation policy trend in Ko Samui District is Firm, used by 39.6% of listings.
- A majority (64.6%) of hosts in Ko Samui District utilize Firm or Strict policies, indicating a market where hosts prioritize booking security.
Recommendations for Hosts
- Consider adopting a Firm policy to align with the 39.6% market standard in Ko Samui District.
- Regularly review your cancellation policy against competitors and market demand shifts in Ko Samui District.
Ko Samui District STR Booking Lead Time Analysis (2026)
Average Booking Lead Time by Month
Booking Lead Time Insights for Ko Samui District
- The overall average booking lead time for vacation rentals in Ko Samui District is 31 days.
- Guests book furthest in advance for stays during December (average 69 days), likely coinciding with peak travel demand or local events.
- The shortest booking windows occur for stays in April (average 0 days), indicating more last-minute travel plans during this time.
- Seasonally, Winter (42 days avg.) sees the longest lead times, while Spring (0 days avg.) has the shortest, reflecting typical travel planning cycles.
Recommendations for Hosts
- Use the overall average lead time (31 days) as a baseline for your pricing and availability strategy in Ko Samui District.
- For December stays, consider implementing length-of-stay discounts or slightly higher rates for bookings made less than 69 days out to capitalize on advance planning.
- During April, focus on last-minute booking availability and promotions, as guests book with very short notice (0 days avg.).
- Target marketing efforts for the Winter season well in advance (at least 42 days) to capture early planners.
- Monitor your own booking lead times against these Ko Samui District averages to identify opportunities for dynamic pricing adjustments.
Popular & Essential Airbnb Amenities in Ko Samui District (2026)
Amenity Prevalence
Amenity Insights for Ko Samui District
- Essential amenities in Ko Samui District that guests expect include: Air conditioning, Free parking on premises, TV, Wifi. Lacking these (any) could significantly impact bookings.
- Popular amenities like Kitchen, Bed linens, Hot water are common but not universal. Offering these can provide a competitive edge.
- A pool is a highly desired but not standard amenity, making it a key feature for attracting guests seeking leisure in Ko Samui District.
Recommendations for Hosts
- Ensure your listing includes all essential amenities for Ko Samui District: Air conditioning, Free parking on premises, TV, Wifi.
- Prioritize adding missing essentials: Free parking on premises, TV, Wifi.
- Consider adding popular differentiators like Kitchen or Bed linens to increase appeal.
- Highlight unique or less common amenities you offer (e.g., hot tub, dedicated workspace, EV charger) in your listing description and photos.
- Regularly check competitor amenities in Ko Samui District to stay competitive.
Ko Samui District Airbnb Guest Demographics & Profile Analysis (2026)
Guest Profile Summary for Ko Samui District
- The typical guest profile for Airbnb in Ko Samui District consists of predominantly international visitors (98%), with top international origins including Germany, typically belonging to the Post-2000s (Gen Z/Alpha) group (50%), primarily speaking English or French.
- Domestic travelers account for 2.5% of guests.
- Key international markets include France (19.6%) and Germany (15.8%).
- Top languages spoken are English (42.8%) followed by French (14.9%).
- A significant demographic segment is the Post-2000s (Gen Z/Alpha) group, representing 50% of guests.
Recommendations for Hosts
- Focus marketing internationally, particularly towards travelers from Germany.
- Tailor amenities and listing descriptions to appeal to the dominant Post-2000s (Gen Z/Alpha) demographic (e.g., highlight fast WiFi, smart home features, local guides).
- Highlight unique local experiences or amenities relevant to the primary guest profile.
- Consider seasonal promotions aligned with peak travel times for key origin markets.
Nearby Short-Term Rental Market Comparison
How does the Ko Samui District Airbnb market stack up against its neighbors? Compare key performance metrics like average monthly revenue, ADR, and occupancy rates in surrounding areas to understand the broader regional STR landscape.
| Market | Active Properties | Monthly Revenue | Daily Rate | Avg. Occupancy |
|---|---|---|---|---|
| Baan Thong Po | 135 | $3,724 | $378.37 | 45% |
| Baan Thong Krut | 30 | $3,723 | $633.64 | 39% |
| Baan Taling Ngam | 38 | $3,122 | $392.66 | 36% |
| Baan Chaweng Noi | 333 | $3,038 | $289.57 | 45% |
| Ko Samui | 904 | $2,890 | $332.21 | 43% |
| Tong Yang | 56 | $2,766 | $562.71 | 38% |
| Baan Pang Ka | 15 | $2,734 | $245.69 | 45% |
| Ban Bang Khao | 58 | $2,702 | $405.58 | 38% |
| Baan Hua Thanon | 96 | $2,490 | $255.74 | 48% |
| Choeng Mon | 206 | $2,421 | $376.58 | 38% |