Thong Sala Airbnb Market Analysis 2026: Short Term Rental Data & Vacation Rental Statistics in Surat Thani Province, Thailand
Is Airbnb profitable in Thong Sala in 2026? Explore comprehensive Airbnb analytics for Thong Sala, Surat Thani Province, Thailand to uncover income potential. This 2026 STR market report for Thong Sala, based on AirROI data from February 2025 to January 2026, reveals key trends in the niche market of 37 active listings.
Whether you're considering an Airbnb investment in Thong Sala, optimizing your existing vacation rental, or exploring rental arbitrage opportunities, understanding the Thong Sala Airbnb data is crucial. Leveraging the low regulation environment is key to maximizing your short term rental income potential. Let's dive into the specifics.
Key Thong Sala Airbnb Performance Metrics Overview
Monthly Airbnb Revenue Variations & Income Potential in Thong Sala (2026)
Understanding the monthly revenue variations for Airbnb listings in Thong Sala is key to maximizing your short term rental income potential. Seasonality significantly impacts earnings. Our analysis, based on data from the past 12 months, shows that the peak revenue month for STRs in Thong Sala is typically February, while June often presents the lowest earnings, highlighting opportunities for strategic pricing adjustments during shoulder and low seasons. Explore the typical Airbnb income in Thong Sala across different performance tiers:
- Best-in-class properties (Top 10%) achieve $2,392+ monthly, often utilizing dynamic pricing and superior guest experiences.
- Strong performing properties (Top 25%) earn $1,294 or more, indicating effective management and desirable locations/amenities.
- Typical properties (Median) generate around $726 per month, representing the average market performance.
- Entry-level properties (Bottom 25%) see earnings around $335, often with potential for optimization.
Average Monthly Airbnb Earnings Trend in Thong Sala
Thong Sala Airbnb Occupancy Rate Trends (2026)
Maximize your bookings by understanding the Thong Sala STR occupancy trends. Seasonal demand shifts significantly influence how often properties are booked. Typically, Februarysees the highest demand (peak season occupancy), while June experiences the lowest (low season). Effective strategies, like adjusting minimum stays or offering promotions, can boost occupancy during slower periods. Here's how different property tiers perform in Thong Sala:
- Best-in-class properties (Top 10%) achieve 78%+ occupancy, indicating high desirability and potentially optimized availability.
- Strong performing properties (Top 25%) maintain 61% or higher occupancy, suggesting good market fit and guest satisfaction.
- Typical properties (Median) have an occupancy rate around 38%.
- Entry-level properties (Bottom 25%) average 19% occupancy, potentially facing higher vacancy.
Average Monthly Occupancy Rate Trend in Thong Sala
Average Daily Rate (ADR) Airbnb Trends in Thong Sala (2026)
Effective short term rental pricing strategy in Thong Sala involves understanding monthly ADR fluctuations. The Average Daily Rate (ADR) for Airbnb in Thong Sala typically peaks in January and dips lowest during June. Leveraging Airbnb dynamic pricing tools or strategies based on this seasonality can significantly boost revenue. Here's a look at the typical nightly rates achieved:
- Best-in-class properties (Top 10%) command rates of $194+ per night, often due to premium features or locations.
- Strong performing properties (Top 25%) achieve nightly rates of $101 or more.
- Typical properties (Median) charge around $70 per night.
- Entry-level properties (Bottom 25%) earn around $42 per night.
Average Daily Rate (ADR) Trend by Month in Thong Sala
Get Live Thong Sala Market Intelligence 👇

Explore Real-time Analytics
Airbnb Seasonality Analysis & Trends in Thong Sala (2026)
Peak Season (February, March, January)
- Revenue averages $1,430 per month
- Occupancy rates average 53.1%
- Daily rates average $121
Shoulder Season
- Revenue averages $965 per month
- Occupancy maintains around 37.2%
- Daily rates hold near $100
Low Season (June, October, November)
- Revenue drops to average $733 per month
- Occupancy decreases to average 33.8%
- Daily rates adjust to average $117
Seasonality Insights for Thong Sala
- The Airbnb seasonality in Thong Sala shows highly seasonal trends requiring careful strategy. While the sections above show seasonal averages, it's also insightful to look at the extremes:
- During the high season, the absolute peak month showcases Thong Sala's highest earning potential, with monthly revenues capable of climbing to $1,563, occupancy reaching a high of 69.4%, and ADRs peaking at $182.
- Conversely, the slowest single month of the year, typically falling within the low season, marks the market's lowest point. In this month, revenue might dip to $557, occupancy could drop to 25.3%, and ADRs may adjust down to $69.
- Understanding both the seasonal averages and these monthly peaks and troughs in revenue, occupancy, and ADR is crucial for maximizing your Airbnb profit potential in Thong Sala.
Seasonal Strategies for Maximizing Profit
- Peak Season: Maximize revenue through premium pricing and potentially longer minimum stays. Ensure high availability.
- Low Season: Offer competitive pricing, special promotions (e.g., extended stay discounts), and flexible cancellation policies. Target off-season travelers like remote workers or budget-conscious guests.
- Shoulder Seasons: Implement dynamic pricing that balances peak and low rates. Target weekend travelers or specific events. Offer slightly more flexible terms than peak season.
- Regularly analyze your own performance against these Thong Sala seasonality benchmarks and adjust your pricing and availability strategy accordingly.
Best Areas for Airbnb Investment in Thong Sala (2026)
Exploring the top neighborhoods for short-term rentals in Thong Sala? This section highlights key areas, outlining why they are attractive for hosts and guests, along with notable local attractions. Consider these locations based on your target guest profile and investment strategy.
| Neighborhood / Area | Why Host Here? (Target Guests & Appeal) | Key Attractions & Landmarks |
|---|---|---|
| Thong Sala Beach | The main hub for ferries to Koh Phangan with a vibrant atmosphere, beautiful sunsets, and proximity to dining and shopping. Ideal for tourists looking for convenience and relaxation. | Thong Sala Night Market, Thong Sala Beach, Phangan Island tours, Local shops and cafes, Beachfront bars |
| Haad Rin | Famous for the Full Moon Party, Haad Rin attracts a young, lively crowd looking for nightlife and beach parties. A lucrative spot for hosting or investing due to its popularity. | Haad Rin Beach, Full Moon Party, Bars and nightlife, Water sports activities, Beach clubs |
| Sri Thanu | Known for its laid-back vibe and wellness retreats, Sri Thanu is popular among health-conscious travelers and yogis. It offers a mix of relaxation and cultural experiences. | Yoga retreats, Cafes and wellness centers, Sri Thanu Beach, Local markets, Dharma Kaya Meditation Center |
| Bottle Beach | A hidden gem accessible by boat, Bottle Beach is idyllic and serene, attracting travelers looking for peace and quiet away from the crowds. | Bottle Beach, Snorkeling spots, Nature trails, Relaxed beach bars, Secluded atmosphere |
| Chaloklum Bay | A charming fishing village with beautiful beaches, perfect for families and those looking for a less commercialized experience. Offers a close-knit community feel. | Chaloklum Beach, Fishing village experience, Local seafood restaurants, Diving and snorkeling spots, Scenic views |
| Mae Haad | Known for its natural beauty and the famous Koh Ma sandbar, Mae Haad is a perfect location for snorkeling and beach activities. Attracts families and couples alike. | Mae Haad Beach, Koh Ma, Snorkeling, Beachfront restaurants, Scenic viewpoints |
| Wok Tum | Situated between Thong Sala and Haad Rin, Wok Tum offers a quiet atmosphere with easy access to both entertainment and relaxation, appealing to a wide range of tourists. | Wok Tum Beach, Local bars and restaurants, Yoga classes, Scenic walking paths, Sunset views |
| Ban Tai | A tranquil area known for its beautiful beaches and proximity to various local attractions, making it a great option for families and peace-seekers looking to escape the hustle. | Ban Tai Beach, Local markets, Beachfront accommodations, Nature tours, Cultural experiences |
Understanding Airbnb License Requirements & STR Laws in Thong Sala (2026)
While Thong Sala, Surat Thani Province, Thailand currently shows low STR regulations, specific Airbnb license requirements might still exist or change. Always verify the latest short term rental regulations and Airbnb license requirements directly with local government authorities for Thong Sala to ensure full compliance before hosting.
(Source: AirROI data, 2026, finding no licensed listings among those analyzed)
Top Performing Airbnb Properties in Thong Sala (2026)
Benchmark your potential! Explore examples of top-performing Airbnb properties in Thong Salabased on Trailing Twelve Month (TTM) revenue. Analyze their characteristics, revenue, occupancy rate, and ADR to understand what drives success in this market.
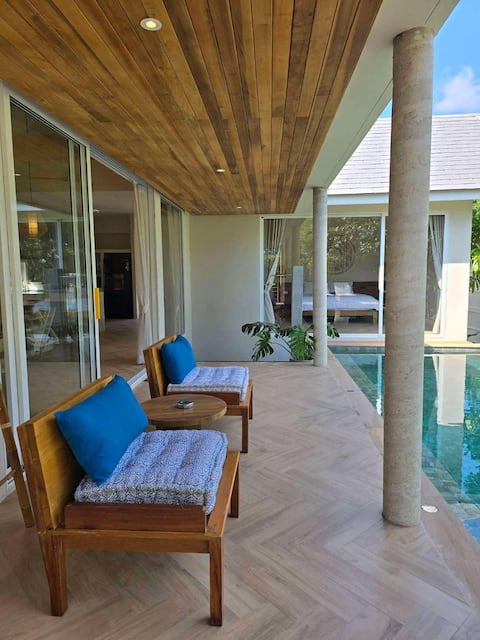
Thiti Private Pool Villa
Entire Place • 2 bedrooms
Casa Eden • Double King Bed • Heart of Thong Sala
Entire Place • 2 bedrooms

Cozy Home in a Lush Garden
Entire Place • 2 bedrooms
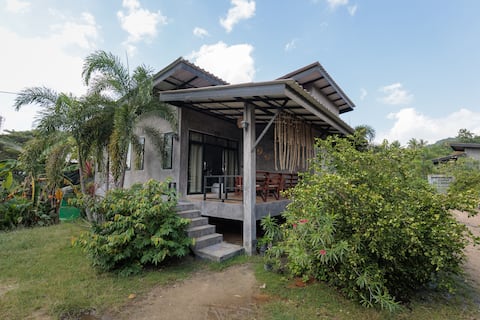
Tropical Cozy Home with Porch & Fish Pond
Entire Place • 2 bedrooms
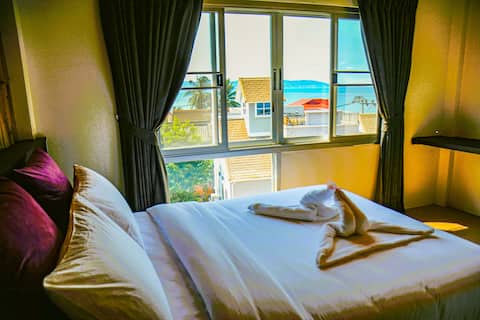
Modern Seaview 1BR Retreat w/ Free Coworking
Entire Place • 1 bedroom
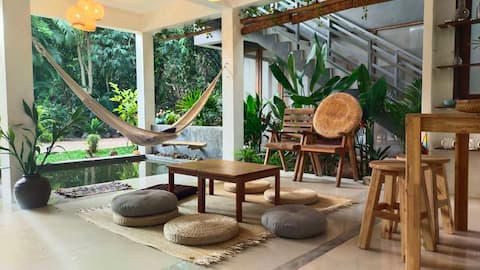
Relax and Recharge in a Spacious Jungle House
Entire Place • 1 bedroom
Note: Performance varies based on location, size, amenities, seasonality, and management quality. Data reflects the past 12 months.
Top Performing Airbnb Hosts in Thong Sala (2026)
Learn from the best! This table showcases top-performing Airbnb hosts in Thong Sala based on the number of properties managed and estimated total revenue over the past year. Analyze their scale and performance metrics.
| Host Name | Properties | Grossing Revenue | Stay Reviews | Avg Rating |
|---|---|---|---|---|
| Barry | 6 | $56,599 | 117 | 4.62/5.0 |
| Pantaree | 1 | $54,615 | 26 | 5.00/5.0 |
| Clothilde | 3 | $49,631 | 110 | 4.82/5.0 |
| Julia | 6 | $30,647 | 286 | 4.94/5.0 |
| Mimi | 6 | $29,979 | 115 | 4.45/5.0 |
| Akaris Property Co, LTD | 1 | $25,544 | 19 | 4.89/5.0 |
| Ilia | 2 | $17,466 | 23 | 4.65/5.0 |
| Mary | 1 | $12,432 | 14 | 4.71/5.0 |
| Sunshine | 3 | $10,473 | 87 | 4.48/5.0 |
| Sofia | 1 | $7,598 | 30 | 4.63/5.0 |
Analyzing the strategies of top hosts, such as their property selection, pricing, and guest communication, can offer valuable lessons for optimizing your own Airbnb operations in Thong Sala.
Dive Deeper: Advanced Thong Sala STR Market Data (2026)
Ready to unlock more insights? AirROI provides access to advanced metrics and comprehensive Airbnb data for Thong Sala. Explore detailed analytics beyond this report to refine your investment strategy, optimize pricing, and maximize your vacation rental profits.
Explore Advanced MetricsThong Sala Short-Term Rental Market Composition (2026): Property & Room Types
Room Type Distribution
Property Type Distribution
Market Composition Insights for Thong Sala
- The Thong Sala Airbnb market composition is heavily skewed towards Entire Home/Apt listings, which make up 83.8% of the 37 active rentals. This indicates strong guest preference for privacy and space.
- Looking at the property type distribution in Thong Sala, Apartment/Condo properties are the most common (45.9%), reflecting the local real estate landscape.
- Houses represent a significant 43.2% portion, catering likely to families or larger groups.
- The presence of 10.8% Hotel/Boutique listings indicates integration with traditional hospitality.
Thong Sala Airbnb Room Capacity Analysis (2026): Bedroom Distribution
Distribution of Listings by Number of Bedrooms
Room Capacity Insights for Thong Sala
- The dominant room capacity in Thong Sala is 1 bedroom listings, making up 81.1% of the market. This suggests a strong demand for properties suitable for couples or solo travelers.
- Together, 1 bedroom and 2 bedrooms properties represent 94.6% of the active Airbnb listings in Thong Sala, indicating a high concentration in these sizes.
- With over half the market (81.1%) consisting of studios or 1-bedroom units, Thong Sala is particularly well-suited for individuals or couples.
- Listings with 3+ bedrooms (2.7%) represent a smaller niche, potentially indicating an underserved market for larger group accommodations in Thong Sala.
Thong Sala Vacation Rental Guest Capacity Trends (2026)
Distribution of Listings by Guest Capacity
Guest Capacity Insights for Thong Sala
- The most common guest capacity trend in Thong Sala vacation rentals is listings accommodating 2 guests (70.3%). This suggests the primary traveler segment is likely couples or solo travelers.
- Properties designed for 2 guests and 4 guests dominate the Thong Sala STR market, accounting for 89.2% of listings.
- A significant 73.0% of listings cater specifically to 1-2 guests, highlighting strong demand from couples and solo travelers in Thong Sala.
- Listings for large groups (6+ guests) are relatively rare (2.7%), potentially indicating an opportunity for hosts targeting this segment in Thong Sala.
- On average, properties in Thong Sala are equipped to host 2.5 guests.
Thong Sala Airbnb Booking Patterns (2026): Available vs. Booked Days
Available Days Distribution
Booked Days Distribution
Booking Pattern Insights for Thong Sala
- The most common availability pattern in Thong Sala falls within the 271-366 days range, representing 54.1% of listings. This suggests many properties have significant open periods on their calendars.
- Approximately 86.5% of listings show high availability (181+ days open annually), indicating potential for increased bookings or specific owner usage patterns.
- For booked days, the 31-90 days range is most frequent in Thong Sala (37.8%), reflecting common guest stay durations or potential owner blocking patterns.
- A notable 13.5% of properties secure long booking periods (181+ days booked per year), highlighting successful long-term rental strategies or significant owner usage.
Thong Sala Airbnb Minimum Stay Requirements Analysis
Distribution of Listings by Minimum Night Requirement
1 Night
11 listings
29.7% of total
2 Nights
13 listings
35.1% of total
3 Nights
1 listings
2.7% of total
4-6 Nights
2 listings
5.4% of total
30+ Nights
10 listings
27% of total
Key Insights
- The most prevalent minimum stay requirement in Thong Sala is 2 Nights, adopted by 35.1% of listings. This highlights the market's preference for shorter, flexible bookings.
- A strong majority (64.8%) of the Thong Sala Airbnb data shows acceptance of very short stays (1-2 nights), indicating a dynamic, high-turnover market.
- A significant segment (27%) caters to monthly stays (30+ nights) in Thong Sala, pointing to opportunities in the extended-stay market.
Recommendations
- Align with the market by considering a 2 Nights minimum stay, as 35.1% of Thong Sala hosts use this setting.
- If feasible, allowing 1-night stays, especially midweek or during low season, could capture last-minute bookings, as only 29.7% currently do.
- Explore offering discounts for stays of 30+ nights to attract the 27% of the market seeking extended stays.
- Adjust minimum nights based on seasonality – potentially shorter during low season and longer during peak demand periods in Thong Sala.
Thong Sala Airbnb Cancellation Policy Trends Analysis (2026)
Flexible
1 listings
2.7% of total
Moderate
5 listings
13.5% of total
Firm
17 listings
45.9% of total
Strict
14 listings
37.8% of total
Cancellation Policy Insights for Thong Sala
- The prevailing Airbnb cancellation policy trend in Thong Sala is Firm, used by 45.9% of listings.
- A majority (83.7%) of hosts in Thong Sala utilize Firm or Strict policies, indicating a market where hosts prioritize booking security.
Recommendations for Hosts
- Consider adopting a Firm policy to align with the 45.9% market standard in Thong Sala.
- With 37.8% using Strict terms, this is a viable option in Thong Sala, particularly for high-value properties or during peak demand periods.
- Regularly review your cancellation policy against competitors and market demand shifts in Thong Sala.
Thong Sala STR Booking Lead Time Analysis (2026)
Average Booking Lead Time by Month
Booking Lead Time Insights for Thong Sala
- The overall average booking lead time for vacation rentals in Thong Sala is 33 days.
- Guests book furthest in advance for stays during December (average 60 days), likely coinciding with peak travel demand or local events.
- The shortest booking windows occur for stays in April (average 15 days), indicating more last-minute travel plans during this time.
- Seasonally, Winter (51 days avg.) sees the longest lead times, while Spring (18 days avg.) has the shortest, reflecting typical travel planning cycles.
Recommendations for Hosts
- Use the overall average lead time (33 days) as a baseline for your pricing and availability strategy in Thong Sala.
- For December stays, consider implementing length-of-stay discounts or slightly higher rates for bookings made less than 60 days out to capitalize on advance planning.
- Target marketing efforts for the Winter season well in advance (at least 51 days) to capture early planners.
- Monitor your own booking lead times against these Thong Sala averages to identify opportunities for dynamic pricing adjustments.
Popular & Essential Airbnb Amenities in Thong Sala (2026)
Amenity Prevalence
Amenity Insights for Thong Sala
- Essential amenities in Thong Sala that guests expect include: Air conditioning, Wifi. Lacking these (any) could significantly impact bookings.
- Popular amenities like Free parking on premises, TV, Essentials are common but not universal. Offering these can provide a competitive edge.
Recommendations for Hosts
- Ensure your listing includes all essential amenities for Thong Sala: Air conditioning, Wifi.
- Consider adding popular differentiators like Free parking on premises or TV to increase appeal.
- Highlight unique or less common amenities you offer (e.g., hot tub, dedicated workspace, EV charger) in your listing description and photos.
- Regularly check competitor amenities in Thong Sala to stay competitive.
Thong Sala Airbnb Guest Demographics & Profile Analysis (2026)
Guest Profile Summary for Thong Sala
- The typical guest profile for Airbnb in Thong Sala consists of predominantly international visitors (99%), with top international origins including United Kingdom, typically belonging to the Post-2000s (Gen Z/Alpha) group (50%), primarily speaking English or German.
- Domestic travelers account for 0.8% of guests.
- Key international markets include Germany (33.3%) and United Kingdom (12.7%).
- Top languages spoken are English (44.9%) followed by German (16.8%).
- A significant demographic segment is the Post-2000s (Gen Z/Alpha) group, representing 50% of guests.
Recommendations for Hosts
- Focus marketing internationally, particularly towards travelers from United Kingdom.
- Tailor amenities and listing descriptions to appeal to the dominant Post-2000s (Gen Z/Alpha) demographic (e.g., highlight fast WiFi, smart home features, local guides).
- Highlight unique local experiences or amenities relevant to the primary guest profile.
- Consider seasonal promotions aligned with peak travel times for key origin markets.
Nearby Short-Term Rental Market Comparison
How does the Thong Sala Airbnb market stack up against its neighbors? Compare key performance metrics like average monthly revenue, ADR, and occupancy rates in surrounding areas to understand the broader regional STR landscape.
| Market | Active Properties | Monthly Revenue | Daily Rate | Avg. Occupancy |
|---|---|---|---|---|
| Pa Khlok | 77 | $5,306 | $839.72 | 30% |
| Baan Thong Po | 135 | $3,724 | $378.37 | 45% |
| Baan Thong Krut | 30 | $3,723 | $633.64 | 39% |
| Baan Taling Ngam | 38 | $3,122 | $392.66 | 36% |
| Baan Chaweng Noi | 333 | $3,038 | $289.57 | 45% |
| Ko Samui | 904 | $2,890 | $332.21 | 43% |
| Ban Khlong Son | 25 | $2,793 | $334.17 | 38% |
| Tong Yang | 56 | $2,766 | $562.71 | 38% |
| Baan Pang Ka | 15 | $2,734 | $245.69 | 45% |
| Ban Bang Khao | 58 | $2,702 | $405.58 | 38% |