Phet Pha-ngan Airbnb Market Analysis 2026: Short Term Rental Data & Vacation Rental Statistics in Surat Thani Province, Thailand
Is Airbnb profitable in Phet Pha-ngan in 2026? Explore comprehensive Airbnb analytics for Phet Pha-ngan, Surat Thani Province, Thailand to uncover income potential. This 2026 STR market report for Phet Pha-ngan, based on AirROI data from February 2025 to January 2026, reveals key trends in the niche market of 48 active listings.
Whether you're considering an Airbnb investment in Phet Pha-ngan, optimizing your existing vacation rental, or exploring rental arbitrage opportunities, understanding the Phet Pha-ngan Airbnb data is crucial. Leveraging the low regulation environment is key to maximizing your short term rental income potential. Let's dive into the specifics.
Key Phet Pha-ngan Airbnb Performance Metrics Overview
Monthly Airbnb Revenue Variations & Income Potential in Phet Pha-ngan (2026)
Understanding the monthly revenue variations for Airbnb listings in Phet Pha-ngan is key to maximizing your short term rental income potential. Seasonality significantly impacts earnings. Our analysis, based on data from the past 12 months, shows that the peak revenue month for STRs in Phet Pha-ngan is typically January, while May often presents the lowest earnings, highlighting opportunities for strategic pricing adjustments during shoulder and low seasons. Explore the typical Airbnb income in Phet Pha-ngan across different performance tiers:
- Best-in-class properties (Top 10%) achieve $6,436+ monthly, often utilizing dynamic pricing and superior guest experiences.
- Strong performing properties (Top 25%) earn $3,472 or more, indicating effective management and desirable locations/amenities.
- Typical properties (Median) generate around $1,532 per month, representing the average market performance.
- Entry-level properties (Bottom 25%) see earnings around $634, often with potential for optimization.
Average Monthly Airbnb Earnings Trend in Phet Pha-ngan
Phet Pha-ngan Airbnb Occupancy Rate Trends (2026)
Maximize your bookings by understanding the Phet Pha-ngan STR occupancy trends. Seasonal demand shifts significantly influence how often properties are booked. Typically, Februarysees the highest demand (peak season occupancy), while October experiences the lowest (low season). Effective strategies, like adjusting minimum stays or offering promotions, can boost occupancy during slower periods. Here's how different property tiers perform in Phet Pha-ngan:
- Best-in-class properties (Top 10%) achieve 84%+ occupancy, indicating high desirability and potentially optimized availability.
- Strong performing properties (Top 25%) maintain 69% or higher occupancy, suggesting good market fit and guest satisfaction.
- Typical properties (Median) have an occupancy rate around 48%.
- Entry-level properties (Bottom 25%) average 22% occupancy, potentially facing higher vacancy.
Average Monthly Occupancy Rate Trend in Phet Pha-ngan
Average Daily Rate (ADR) Airbnb Trends in Phet Pha-ngan (2026)
Effective short term rental pricing strategy in Phet Pha-ngan involves understanding monthly ADR fluctuations. The Average Daily Rate (ADR) for Airbnb in Phet Pha-ngan typically peaks in January and dips lowest during May. Leveraging Airbnb dynamic pricing tools or strategies based on this seasonality can significantly boost revenue. Here's a look at the typical nightly rates achieved:
- Best-in-class properties (Top 10%) command rates of $338+ per night, often due to premium features or locations.
- Strong performing properties (Top 25%) achieve nightly rates of $177 or more.
- Typical properties (Median) charge around $91 per night.
- Entry-level properties (Bottom 25%) earn around $58 per night.
Average Daily Rate (ADR) Trend by Month in Phet Pha-ngan
Get Live Phet Pha-ngan Market Intelligence 👇
Explore Real-time Analytics
Airbnb Seasonality Analysis & Trends in Phet Pha-ngan (2026)
Peak Season (January, December, August)
- Revenue averages $3,609 per month
- Occupancy rates average 46.6%
- Daily rates average $194
Shoulder Season
- Revenue averages $2,773 per month
- Occupancy maintains around 54.4%
- Daily rates hold near $151
Low Season (May, October, November)
- Revenue drops to average $1,688 per month
- Occupancy decreases to average 35.4%
- Daily rates adjust to average $149
Seasonality Insights for Phet Pha-ngan
- The Airbnb seasonality in Phet Pha-ngan shows highly seasonal trends requiring careful strategy. While the sections above show seasonal averages, it's also insightful to look at the extremes:
- During the high season, the absolute peak month showcases Phet Pha-ngan's highest earning potential, with monthly revenues capable of climbing to $4,049, occupancy reaching a high of 69.4%, and ADRs peaking at $230.
- Conversely, the slowest single month of the year, typically falling within the low season, marks the market's lowest point. In this month, revenue might dip to $1,486, occupancy could drop to 33.5%, and ADRs may adjust down to $130.
- Understanding both the seasonal averages and these monthly peaks and troughs in revenue, occupancy, and ADR is crucial for maximizing your Airbnb profit potential in Phet Pha-ngan.
Seasonal Strategies for Maximizing Profit
- Peak Season: Maximize revenue through premium pricing and potentially longer minimum stays. Ensure high availability.
- Low Season: Offer competitive pricing, special promotions (e.g., extended stay discounts), and flexible cancellation policies. Target off-season travelers like remote workers or budget-conscious guests.
- Shoulder Seasons: Implement dynamic pricing that balances peak and low rates. Target weekend travelers or specific events. Offer slightly more flexible terms than peak season.
- Regularly analyze your own performance against these Phet Pha-ngan seasonality benchmarks and adjust your pricing and availability strategy accordingly.
Best Areas for Airbnb Investment in Phet Pha-ngan (2026)
Exploring the top neighborhoods for short-term rentals in Phet Pha-ngan? This section highlights key areas, outlining why they are attractive for hosts and guests, along with notable local attractions. Consider these locations based on your target guest profile and investment strategy.
| Neighborhood / Area | Why Host Here? (Target Guests & Appeal) | Key Attractions & Landmarks |
|---|---|---|
| Haad Rin | Famous for its Full Moon Party, Haad Rin attracts tourists looking for nightlife and beach fun. It's a vibrant area that hosts a variety of events, making it a popular destination for party-goers. | Full Moon Party, Haad Rin Beach, Sunset Viewpoint, Local Bars and Clubs, Fire Show Locations |
| Thong Nai Pan | Known for its stunning beaches and picturesque landscape, Thong Nai Pan offers a more relaxed vibe, attracting families and couples looking for a tranquil getaway. | Thong Nai Pan Noi Beach, Thong Nai Pan Yai Beach, Waterfalls (Than Sadet National Park), Yoga Retreats, Local Markets |
| Baan Tai | Baan Tai is a central location close to the main ferry port and offers a mix of nightlife and quieter beach spots. It's great for those looking to explore the island and its attractions. | Baan Tai Beach, Black Moon Party, Local Restaurants, Art and Craft Shops, Beachfront Bars |
| Chaloklum | A lovely fishing village that offers a serene atmosphere, Chaloklum is perfect for travelers looking for a more authentic Thai experience, with beautiful beaches and local culture. | Chaloklum Beach, Fishing Village, Local Seafood Restaurants, Snorkeling and Diving Spots, Viewpoint Hikes |
| Koh Ma | Known for its natural beauty and opportunities for snorkeling, Koh Ma is a small island connected by a sandbar with Koh Pha Ngan, attracting nature lovers and divers. | Koh Ma Beach, Snorkeling Spots, Diving Schools, Coral Reefs, Beach Bars |
| Salad Beach | A peaceful beach area known for its stunning sunsets, Salad Beach attracts families and couples looking for a quiet retreat with crystal-clear waters. | Salad Beach, Kayaking, Snorkeling Tours, Beachfront Restaurants, Sunset Viewpoints |
| Wok Tum | Wok Tum offers a mix of relaxed beachfront living and local amenities, perfect for those wanting to escape the busier tourist spots while still enjoying the island's beauty. | Wok Tum Beach, Local Shops, Restaurants and Cafés, Yoga and Wellness Retreats, Sunset Spots |
| Srithanu | A quieter area popular with yogis and wellness seekers, Srithanu has numerous retreats and is known for its tranquil atmosphere, attracting those looking for relaxation and spirituality. | Yoga Studios, Meditation Centers, Local Cafés, Natural Beauty, Srithanu Beach |
Understanding Airbnb License Requirements & STR Laws in Phet Pha-ngan (2026)
While Phet Pha-ngan, Surat Thani Province, Thailand currently shows low STR regulations, specific Airbnb license requirements might still exist or change. Always verify the latest short term rental regulations and Airbnb license requirements directly with local government authorities for Phet Pha-ngan to ensure full compliance before hosting.
(Source: AirROI data, 2026, finding no licensed listings among those analyzed)
Top Performing Airbnb Properties in Phet Pha-ngan (2026)
Benchmark your potential! Explore examples of top-performing Airbnb properties in Phet Pha-nganbased on Trailing Twelve Month (TTM) revenue. Analyze their characteristics, revenue, occupancy rate, and ADR to understand what drives success in this market.
The Dreaming View Villa- Sea view luxury 4BR villa
Entire Place • 4 bedrooms
THE MIRROR OF THE SEA LUXURY 3 BR VILLA HAAD YAO
Entire Place • 3 bedrooms

House of the Rising Sun
Entire Place • 3 bedrooms
BellaRose _ SeaView, private, close to the beach
Entire Place • 2 bedrooms
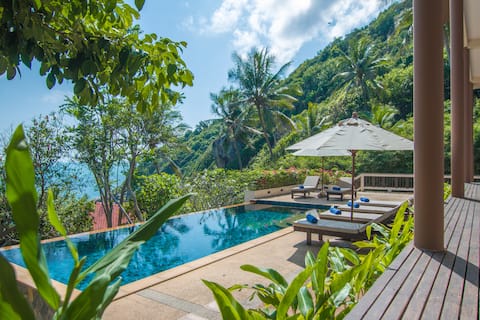
Baan Napa - Luxury Clifftop Villa
Entire Place • 4 bedrooms
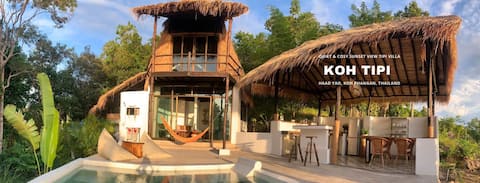
KOH TIPI, Cosy Sunset View Villa
Entire Place • 1 bedroom
Note: Performance varies based on location, size, amenities, seasonality, and management quality. Data reflects the past 12 months.
Top Performing Airbnb Hosts in Phet Pha-ngan (2026)
Learn from the best! This table showcases top-performing Airbnb hosts in Phet Pha-ngan based on the number of properties managed and estimated total revenue over the past year. Analyze their scale and performance metrics.
| Host Name | Properties | Grossing Revenue | Stay Reviews | Avg Rating |
|---|---|---|---|---|
| Patrick | 2 | $278,566 | 91 | 4.95/5.0 |
| Mana | 5 | $144,672 | 385 | 4.87/5.0 |
| Alexey | 5 | $84,934 | 113 | 4.82/5.0 |
| Patricia | 1 | $67,881 | 9 | 5.00/5.0 |
| BellaRose | 1 | $61,486 | 27 | 4.85/5.0 |
| Ian | 1 | $60,416 | 68 | 4.76/5.0 |
| Morgane | 1 | $45,126 | 36 | 4.75/5.0 |
| Andy & Boom | 2 | $43,197 | 76 | 4.66/5.0 |
| Neenit | 5 | $41,611 | 206 | 4.92/5.0 |
| Secret | 2 | $30,866 | 2 | Not Rated |
Analyzing the strategies of top hosts, such as their property selection, pricing, and guest communication, can offer valuable lessons for optimizing your own Airbnb operations in Phet Pha-ngan.
Dive Deeper: Advanced Phet Pha-ngan STR Market Data (2026)
Ready to unlock more insights? AirROI provides access to advanced metrics and comprehensive Airbnb data for Phet Pha-ngan. Explore detailed analytics beyond this report to refine your investment strategy, optimize pricing, and maximize your vacation rental profits.
Explore Advanced MetricsPhet Pha-ngan Short-Term Rental Market Composition (2026): Property & Room Types
Room Type Distribution
Property Type Distribution
Market Composition Insights for Phet Pha-ngan
- The Phet Pha-ngan Airbnb market composition is heavily skewed towards Entire Home/Apt listings, which make up 87.5% of the 48 active rentals. This indicates strong guest preference for privacy and space.
- Looking at the property type distribution in Phet Pha-ngan, House properties are the most common (68.8%), reflecting the local real estate landscape.
- Houses represent a significant 68.8% portion, catering likely to families or larger groups.
- The presence of 6.3% Hotel/Boutique listings indicates integration with traditional hospitality.
- Smaller segments like unique stays (combined 4.2%) offer potential for unique stay experiences.
Phet Pha-ngan Airbnb Room Capacity Analysis (2026): Bedroom Distribution
Distribution of Listings by Number of Bedrooms
Room Capacity Insights for Phet Pha-ngan
- The dominant room capacity in Phet Pha-ngan is 1 bedroom listings, making up 62.5% of the market. This suggests a strong demand for properties suitable for couples or solo travelers.
- Together, 1 bedroom and 2 bedrooms properties represent 83.3% of the active Airbnb listings in Phet Pha-ngan, indicating a high concentration in these sizes.
- With over half the market (62.5%) consisting of studios or 1-bedroom units, Phet Pha-ngan is particularly well-suited for individuals or couples.
Phet Pha-ngan Vacation Rental Guest Capacity Trends (2026)
Distribution of Listings by Guest Capacity
Guest Capacity Insights for Phet Pha-ngan
- The most common guest capacity trend in Phet Pha-ngan vacation rentals is listings accommodating 2 guests (52.1%). This suggests the primary traveler segment is likely couples or solo travelers.
- Properties designed for 2 guests and 4 guests dominate the Phet Pha-ngan STR market, accounting for 75.0% of listings.
- A significant 52.1% of listings cater specifically to 1-2 guests, highlighting strong demand from couples and solo travelers in Phet Pha-ngan.
- 12.6% of properties accommodate 6+ guests, serving the market segment for larger families or group travel in Phet Pha-ngan.
- On average, properties in Phet Pha-ngan are equipped to host 3.2 guests.
Phet Pha-ngan Airbnb Booking Patterns (2026): Available vs. Booked Days
Available Days Distribution
Booked Days Distribution
Booking Pattern Insights for Phet Pha-ngan
- The most common availability pattern in Phet Pha-ngan falls within the 271-366 days range, representing 41.7% of listings. This suggests many properties have significant open periods on their calendars.
- Approximately 70.9% of listings show high availability (181+ days open annually), indicating potential for increased bookings or specific owner usage patterns.
- For booked days, the 181-270 days range is most frequent in Phet Pha-ngan (31.3%), reflecting common guest stay durations or potential owner blocking patterns.
- A notable 31.3% of properties secure long booking periods (181+ days booked per year), highlighting successful long-term rental strategies or significant owner usage.
Phet Pha-ngan Airbnb Minimum Stay Requirements Analysis
Distribution of Listings by Minimum Night Requirement
1 Night
15 listings
31.3% of total
2 Nights
7 listings
14.6% of total
3 Nights
6 listings
12.5% of total
4-6 Nights
4 listings
8.3% of total
7-29 Nights
3 listings
6.3% of total
30+ Nights
13 listings
27.1% of total
Key Insights
- The most prevalent minimum stay requirement in Phet Pha-ngan is 1 Night, adopted by 31.3% of listings. This highlights the market's preference for shorter, flexible bookings.
- A significant segment (27.1%) caters to monthly stays (30+ nights) in Phet Pha-ngan, pointing to opportunities in the extended-stay market.
Recommendations
- Align with the market by considering a 1 Night minimum stay, as 31.3% of Phet Pha-ngan hosts use this setting.
- Explore offering discounts for stays of 30+ nights to attract the 27.1% of the market seeking extended stays.
- Adjust minimum nights based on seasonality – potentially shorter during low season and longer during peak demand periods in Phet Pha-ngan.
Phet Pha-ngan Airbnb Cancellation Policy Trends Analysis (2026)
Super Strict 60 Days
1 listings
2.3% of total
Flexible
5 listings
11.6% of total
Moderate
3 listings
7% of total
Firm
20 listings
46.5% of total
Strict
14 listings
32.6% of total
Cancellation Policy Insights for Phet Pha-ngan
- The prevailing Airbnb cancellation policy trend in Phet Pha-ngan is Firm, used by 46.5% of listings.
- A majority (79.1%) of hosts in Phet Pha-ngan utilize Firm or Strict policies, indicating a market where hosts prioritize booking security.
Recommendations for Hosts
- Consider adopting a Firm policy to align with the 46.5% market standard in Phet Pha-ngan.
- With 32.6% using Strict terms, this is a viable option in Phet Pha-ngan, particularly for high-value properties or during peak demand periods.
- Regularly review your cancellation policy against competitors and market demand shifts in Phet Pha-ngan.
Phet Pha-ngan STR Booking Lead Time Analysis (2026)
Average Booking Lead Time by Month
Booking Lead Time Insights for Phet Pha-ngan
- The overall average booking lead time for vacation rentals in Phet Pha-ngan is 60 days.
- Guests book furthest in advance for stays during January (average 116 days), likely coinciding with peak travel demand or local events.
- The shortest booking windows occur for stays in May (average 32 days), indicating more last-minute travel plans during this time.
- Seasonally, Winter (91 days avg.) sees the longest lead times, while Fall (43 days avg.) has the shortest, reflecting typical travel planning cycles.
Recommendations for Hosts
- Use the overall average lead time (60 days) as a baseline for your pricing and availability strategy in Phet Pha-ngan.
- For January stays, consider implementing length-of-stay discounts or slightly higher rates for bookings made less than 116 days out to capitalize on advance planning.
- Target marketing efforts for the Winter season well in advance (at least 91 days) to capture early planners.
- Monitor your own booking lead times against these Phet Pha-ngan averages to identify opportunities for dynamic pricing adjustments.
Popular & Essential Airbnb Amenities in Phet Pha-ngan (2026)
Amenity Prevalence
Amenity Insights for Phet Pha-ngan
- Essential amenities in Phet Pha-ngan that guests expect include: Free parking on premises, Wifi. Lacking these (any) could significantly impact bookings.
- Popular amenities like Air conditioning, Essentials, Kitchen are common but not universal. Offering these can provide a competitive edge.
Recommendations for Hosts
- Ensure your listing includes all essential amenities for Phet Pha-ngan: Free parking on premises, Wifi.
- Prioritize adding missing essentials: Wifi.
- Consider adding popular differentiators like Air conditioning or Essentials to increase appeal.
- Highlight unique or less common amenities you offer (e.g., hot tub, dedicated workspace, EV charger) in your listing description and photos.
- Regularly check competitor amenities in Phet Pha-ngan to stay competitive.
Phet Pha-ngan Airbnb Guest Demographics & Profile Analysis (2026)
Guest Profile Summary for Phet Pha-ngan
- The typical guest profile for Airbnb in Phet Pha-ngan consists of predominantly international visitors (99%), with top international origins including France, typically belonging to the Post-2000s (Gen Z/Alpha) group (50%), primarily speaking English or German.
- Domestic travelers account for 1.1% of guests.
- Key international markets include Germany (31.6%) and France (10.2%).
- Top languages spoken are English (38.5%) followed by German (19.2%).
- A significant demographic segment is the Post-2000s (Gen Z/Alpha) group, representing 50% of guests.
Recommendations for Hosts
- Focus marketing internationally, particularly towards travelers from France.
- Tailor amenities and listing descriptions to appeal to the dominant Post-2000s (Gen Z/Alpha) demographic (e.g., highlight fast WiFi, smart home features, local guides).
- Highlight unique local experiences or amenities relevant to the primary guest profile.
- Consider seasonal promotions aligned with peak travel times for key origin markets.
Nearby Short-Term Rental Market Comparison
How does the Phet Pha-ngan Airbnb market stack up against its neighbors? Compare key performance metrics like average monthly revenue, ADR, and occupancy rates in surrounding areas to understand the broader regional STR landscape.
| Market | Active Properties | Monthly Revenue | Daily Rate | Avg. Occupancy |
|---|---|---|---|---|
| Baan Thong Po | 135 | $3,724 | $378.37 | 45% |
| Baan Thong Krut | 30 | $3,723 | $633.64 | 39% |
| Baan Taling Ngam | 38 | $3,122 | $392.66 | 36% |
| Baan Chaweng Noi | 333 | $3,038 | $289.57 | 45% |
| Ko Samui | 904 | $2,890 | $332.21 | 43% |
| Tong Yang | 56 | $2,766 | $562.71 | 38% |
| Baan Pang Ka | 15 | $2,734 | $245.69 | 45% |
| Ban Bang Khao | 58 | $2,702 | $405.58 | 38% |
| Baan Hua Thanon | 96 | $2,490 | $255.74 | 48% |
| Choeng Mon | 206 | $2,421 | $376.58 | 38% |