Racha Thewa Subdistrict Airbnb Market Analysis 2025: Short Term Rental Data & Vacation Rental Statistics in Samut Prakan Province, Thailand
Is Airbnb profitable in Racha Thewa Subdistrict in 2025? Explore comprehensive Airbnb analytics for Racha Thewa Subdistrict, Samut Prakan Province, Thailand to uncover income potential. This 2025 STR market report for Racha Thewa Subdistrict, based on AirROI data from November 2024 to October 2025, reveals key trends in the niche market of 18 active listings.
Whether you're considering an Airbnb investment in Racha Thewa Subdistrict, optimizing your existing vacation rental, or exploring rental arbitrage opportunities, understanding the Racha Thewa Subdistrict Airbnb data is crucial. Leveraging the low regulation environment is key to maximizing your short term rental income potential. Let's dive into the specifics.
Key Racha Thewa Subdistrict Airbnb Performance Metrics Overview
Monthly Airbnb Revenue Variations & Income Potential in Racha Thewa Subdistrict (2025)
Understanding the monthly revenue variations for Airbnb listings in Racha Thewa Subdistrict is key to maximizing your short term rental income potential. Seasonality significantly impacts earnings. Our analysis, based on data from the past 12 months, shows that the peak revenue month for STRs in Racha Thewa Subdistrict is typically April, while October often presents the lowest earnings, highlighting opportunities for strategic pricing adjustments during shoulder and low seasons. Explore the typical Airbnb income in Racha Thewa Subdistrict across different performance tiers:
- Best-in-class properties (Top 10%) achieve $1,087+ monthly, often utilizing dynamic pricing and superior guest experiences.
- Strong performing properties (Top 25%) earn $406 or more, indicating effective management and desirable locations/amenities.
- Typical properties (Median) generate around $188 per month, representing the average market performance.
- Entry-level properties (Bottom 25%) see earnings around $78, often with potential for optimization.
Average Monthly Airbnb Earnings Trend in Racha Thewa Subdistrict
Racha Thewa Subdistrict Airbnb Occupancy Rate Trends (2025)
Maximize your bookings by understanding the Racha Thewa Subdistrict STR occupancy trends. Seasonal demand shifts significantly influence how often properties are booked. Typically, Marchsees the highest demand (peak season occupancy), while September experiences the lowest (low season). Effective strategies, like adjusting minimum stays or offering promotions, can boost occupancy during slower periods. Here's how different property tiers perform in Racha Thewa Subdistrict:
- Best-in-class properties (Top 10%) achieve 59%+ occupancy, indicating high desirability and potentially optimized availability.
- Strong performing properties (Top 25%) maintain 41% or higher occupancy, suggesting good market fit and guest satisfaction.
- Typical properties (Median) have an occupancy rate around 21%.
- Entry-level properties (Bottom 25%) average 9% occupancy, potentially facing higher vacancy.
Average Monthly Occupancy Rate Trend in Racha Thewa Subdistrict
Average Daily Rate (ADR) Airbnb Trends in Racha Thewa Subdistrict (2025)
Effective short term rental pricing strategy in Racha Thewa Subdistrict involves understanding monthly ADR fluctuations. The Average Daily Rate (ADR) for Airbnb in Racha Thewa Subdistrict typically peaks in June and dips lowest during March. Leveraging Airbnb dynamic pricing tools or strategies based on this seasonality can significantly boost revenue. Here's a look at the typical nightly rates achieved:
- Best-in-class properties (Top 10%) command rates of $95+ per night, often due to premium features or locations.
- Strong performing properties (Top 25%) achieve nightly rates of $61 or more.
- Typical properties (Median) charge around $33 per night.
- Entry-level properties (Bottom 25%) earn around $21 per night.
Average Daily Rate (ADR) Trend by Month in Racha Thewa Subdistrict
Get Live Racha Thewa Subdistrict Market Intelligence 👇

Explore Real-time Analytics
Airbnb Seasonality Analysis & Trends in Racha Thewa Subdistrict (2025)
Peak Season (April, February, June)
- Revenue averages $501 per month
- Occupancy rates average 33.5%
- Daily rates average $46
Shoulder Season
- Revenue averages $442 per month
- Occupancy maintains around 29.3%
- Daily rates hold near $46
Low Season (August, October, November)
- Revenue drops to average $279 per month
- Occupancy decreases to average 22.3%
- Daily rates adjust to average $47
Seasonality Insights for Racha Thewa Subdistrict
- The Airbnb seasonality in Racha Thewa Subdistrict shows moderate seasonality with distinct peak and low periods. While the sections above show seasonal averages, it's also insightful to look at the extremes:
- During the high season, the absolute peak month showcases Racha Thewa Subdistrict's highest earning potential, with monthly revenues capable of climbing to $513, occupancy reaching a high of 39.5%, and ADRs peaking at $49.
- Conversely, the slowest single month of the year, typically falling within the low season, marks the market's lowest point. In this month, revenue might dip to $231, occupancy could drop to 16.2%, and ADRs may adjust down to $45.
- Understanding both the seasonal averages and these monthly peaks and troughs in revenue, occupancy, and ADR is crucial for maximizing your Airbnb profit potential in Racha Thewa Subdistrict.
Seasonal Strategies for Maximizing Profit
- Peak Season: Maximize revenue through premium pricing and potentially longer minimum stays. Ensure high availability.
- Low Season: Offer competitive pricing, special promotions (e.g., extended stay discounts), and flexible cancellation policies. Target off-season travelers like remote workers or budget-conscious guests.
- Shoulder Seasons: Implement dynamic pricing that balances peak and low rates. Target weekend travelers or specific events. Offer slightly more flexible terms than peak season.
- Regularly analyze your own performance against these Racha Thewa Subdistrict seasonality benchmarks and adjust your pricing and availability strategy accordingly.
Best Areas for Airbnb Investment in Racha Thewa Subdistrict (2025)
Exploring the top neighborhoods for short-term rentals in Racha Thewa Subdistrict? This section highlights key areas, outlining why they are attractive for hosts and guests, along with notable local attractions. Consider these locations based on your target guest profile and investment strategy.
| Neighborhood / Area | Why Host Here? (Target Guests & Appeal) | Key Attractions & Landmarks |
|---|---|---|
| Racha Thewa Center | A bustling hub with a mix of residential and commercial spaces, attracting both tourists and business travelers. | Local Markets, Restaurants, Parks, Temples, Shopping Malls |
| Bang Phli Yai | Known for its proximity to Suvarnabhumi Airport and local attractions, ideal for short-term stays for travelers. | Wat Bang Phli Yai Nai, The Royal Golf Course, Local Bird Parks |
| Bang Phli Nok | A charming area with scenic lakes and traditional Thai culture, appealing to those seeking relaxation and local experiences. | Lakeside Parks, Cultural Festivals |
| Wat Ta Fame | A peaceful area with beautiful temples and nature, great for guests looking for tranquility after exploring the city. | Wat Ta Fame Temple, Natural Reserves, Local Cuisine Spots |
| Bang SaoThong | A growing region with increasing tourist interest, still relatively undiscovered and offering a local experience. | Traditional Thai Villages, Cultural Sites |
| Pak Khlong | A commercial area that attracts business travelers, especially those visiting nearby industries. | Local Markets, Factories, Business Centers |
| Samut Prakan Aquarium | Popular for families and educational trips, providing access to nature and marine experiences. | Samut Prakan Aquarium, Nearby Parks, Family Activities |
| King Rama IX Park | A large urban park with gardens and recreational activities, perfect for families and outdoor enthusiasts. | Beautiful Gardens, Walking and Biking Tracks, Parks Events |
Understanding Airbnb License Requirements & STR Laws in Racha Thewa Subdistrict (2025)
While Racha Thewa Subdistrict, Samut Prakan Province, Thailand currently shows low STR regulations, specific Airbnb license requirements might still exist or change. Always verify the latest short term rental regulations and Airbnb license requirements directly with local government authorities for Racha Thewa Subdistrict to ensure full compliance before hosting.
(Source: AirROI data, 2025, finding no licensed listings among those analyzed)
Top Performing Airbnb Properties in Racha Thewa Subdistrict (2025)
Benchmark your potential! Explore examples of top-performing Airbnb properties in Racha Thewa Subdistrictbased on Trailing Twelve Month (TTM) revenue. Analyze their characteristics, revenue, occupancy rate, and ADR to understand what drives success in this market.

AnnaHome5@Latkrabang
Entire Place • 3 bedrooms
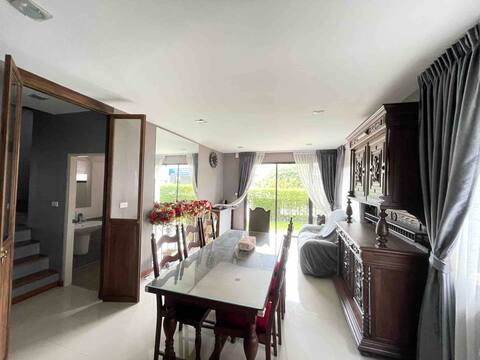
Charming Retreat home & pool minutes to airport
Entire Place • 2 bedrooms

AM01: Bang Na/1 Bedroom/BTS Bang Na/Pool & Gym
Entire Place • 1 bedroom
Cozy room for Fam or group
Private Room • 2 bedrooms
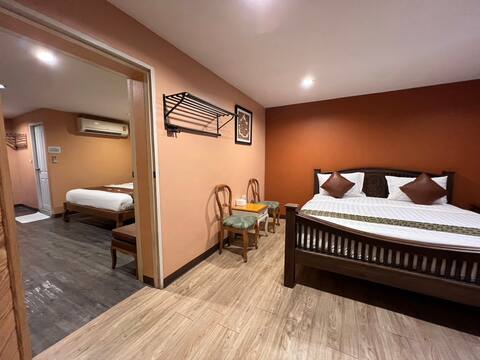
Daily resort near Suvarnabhumi Airport
Private Room • 1 bedroom

Accommodation near Suvarnabhumi Airport, airport shuttle service
Private Room • 1 bedroom
Note: Performance varies based on location, size, amenities, seasonality, and management quality. Data reflects the past 12 months.
Top Performing Airbnb Hosts in Racha Thewa Subdistrict (2025)
Learn from the best! This table showcases top-performing Airbnb hosts in Racha Thewa Subdistrict based on the number of properties managed and estimated total revenue over the past year. Analyze their scale and performance metrics.
| Host Name | Properties | Grossing Revenue | Stay Reviews | Avg Rating |
|---|---|---|---|---|
| Nannapas | 1 | $21,361 | 78 | 4.95/5.0 |
| Chatkarin | 1 | $11,498 | 20 | 4.90/5.0 |
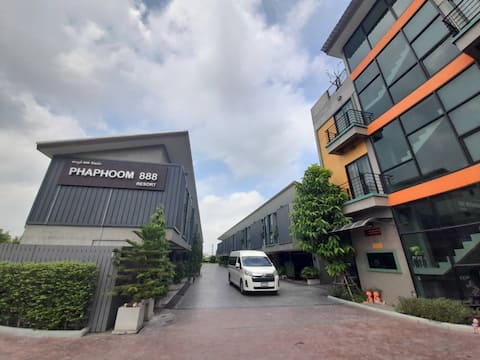
| Phaphoom | 4 | $10,261 | 43 | 4.72/5.0 |
| Phaphoom888 | 3 | $9,106 | 83 | 4.53/5.0 |
| Butler | 1 | $6,400 | 30 | 4.73/5.0 |
| Supakit | 1 | $1,681 | 1 | Not Rated |
| Patty | 1 | $1,416 | 28 | 4.86/5.0 |
| Best Bed | 1 | $1,279 | 203 | 4.47/5.0 |
| Host #222157479 | 1 | $1,066 | 10 | 4.80/5.0 |
| Num | 1 | $978 | 62 | 4.40/5.0 |
Analyzing the strategies of top hosts, such as their property selection, pricing, and guest communication, can offer valuable lessons for optimizing your own Airbnb operations in Racha Thewa Subdistrict.
Dive Deeper: Advanced Racha Thewa Subdistrict STR Market Data (2025)
Ready to unlock more insights? AirROI provides access to advanced metrics and comprehensive Airbnb data for Racha Thewa Subdistrict. Explore detailed analytics beyond this report to refine your investment strategy, optimize pricing, and maximize your vacation rental profits.
Explore Advanced MetricsRacha Thewa Subdistrict Short-Term Rental Market Composition (2025): Property & Room Types
Room Type Distribution
Property Type Distribution
Market Composition Insights for Racha Thewa Subdistrict
- The Racha Thewa Subdistrict Airbnb market composition is heavily skewed towards Private Room listings, which make up 61.1% of the 18 active rentals. This indicates strong guest preference for privacy and space.
- Looking at the property type distribution in Racha Thewa Subdistrict, Hotel/Boutique properties are the most common (61.1%), reflecting the local real estate landscape.
- Houses represent a significant 27.8% portion, catering likely to families or larger groups.
- The presence of 61.1% Hotel/Boutique listings indicates integration with traditional hospitality.
Racha Thewa Subdistrict Airbnb Room Capacity Analysis (2025): Bedroom Distribution
Distribution of Listings by Number of Bedrooms
Room Capacity Insights for Racha Thewa Subdistrict
- The dominant room capacity in Racha Thewa Subdistrict is 1 bedroom listings, making up 61.1% of the market. This suggests a strong demand for properties suitable for couples or solo travelers.
- Together, 1 bedroom and 3 bedrooms properties represent 77.8% of the active Airbnb listings in Racha Thewa Subdistrict, indicating a high concentration in these sizes.
- With over half the market (61.1%) consisting of studios or 1-bedroom units, Racha Thewa Subdistrict is particularly well-suited for individuals or couples.
- A significant 22.3% of listings offer 3+ bedrooms, catering to larger groups and families seeking more space in Racha Thewa Subdistrict.
Racha Thewa Subdistrict Vacation Rental Guest Capacity Trends (2025)
Distribution of Listings by Guest Capacity
Guest Capacity Insights for Racha Thewa Subdistrict
- The most common guest capacity trend in Racha Thewa Subdistrict vacation rentals is listings accommodating 2 guests (55.6%). This suggests the primary traveler segment is likely couples or solo travelers.
- Properties designed for 2 guests and 8+ guests dominate the Racha Thewa Subdistrict STR market, accounting for 66.7% of listings.
- A significant 55.6% of listings cater specifically to 1-2 guests, highlighting strong demand from couples and solo travelers in Racha Thewa Subdistrict.
- 22.3% of properties accommodate 6+ guests, serving the market segment for larger families or group travel in Racha Thewa Subdistrict.
- On average, properties in Racha Thewa Subdistrict are equipped to host 3.4 guests.
Racha Thewa Subdistrict Airbnb Booking Patterns (2025): Available vs. Booked Days
Available Days Distribution
Booked Days Distribution
Booking Pattern Insights for Racha Thewa Subdistrict
- The most common availability pattern in Racha Thewa Subdistrict falls within the 271-366 days range, representing 61.1% of listings. This suggests many properties have significant open periods on their calendars.
- Approximately 88.9% of listings show high availability (181+ days open annually), indicating potential for increased bookings or specific owner usage patterns.
- For booked days, the 1-30 days range is most frequent in Racha Thewa Subdistrict (33.3%), reflecting common guest stay durations or potential owner blocking patterns.
- A notable 11.1% of properties secure long booking periods (181+ days booked per year), highlighting successful long-term rental strategies or significant owner usage.
Racha Thewa Subdistrict Airbnb Minimum Stay Requirements Analysis
Distribution of Listings by Minimum Night Requirement
1 Night
13 listings
76.5% of total
3 Nights
1 listings
5.9% of total
4-6 Nights
2 listings
11.8% of total
7-29 Nights
1 listings
5.9% of total
Key Insights
- The most prevalent minimum stay requirement in Racha Thewa Subdistrict is 1 Night, adopted by 76.5% of listings. This highlights the market's preference for shorter, flexible bookings.
- A strong majority (76.5%) of the Racha Thewa Subdistrict Airbnb data shows acceptance of very short stays (1-2 nights), indicating a dynamic, high-turnover market.
Recommendations
- Align with the market by considering a 1 Night minimum stay, as 76.5% of Racha Thewa Subdistrict hosts use this setting.
- Adjust minimum nights based on seasonality – potentially shorter during low season and longer during peak demand periods in Racha Thewa Subdistrict.
Racha Thewa Subdistrict Airbnb Cancellation Policy Trends Analysis (2025)
Flexible
8 listings
47.1% of total
Moderate
7 listings
41.2% of total
Firm
1 listings
5.9% of total
Strict
1 listings
5.9% of total
Cancellation Policy Insights for Racha Thewa Subdistrict
- The prevailing Airbnb cancellation policy trend in Racha Thewa Subdistrict is Flexible, used by 47.1% of listings.
- The market strongly favors guest-friendly terms, with 88.3% of listings offering Flexible or Moderate policies. This suggests guests in Racha Thewa Subdistrict may expect booking flexibility.
- Strict cancellation policies are quite rare (5.9%), potentially making listings with this policy less competitive unless justified by high demand or property type.
Recommendations for Hosts
- Consider adopting a Flexible policy to align with the 47.1% market standard in Racha Thewa Subdistrict.
- Using a Strict policy might deter some guests, as only 5.9% of listings use it. Evaluate if potential revenue protection outweighs possible lower booking rates.
- Regularly review your cancellation policy against competitors and market demand shifts in Racha Thewa Subdistrict.
Racha Thewa Subdistrict STR Booking Lead Time Analysis (2025)
Average Booking Lead Time by Month
Booking Lead Time Insights for Racha Thewa Subdistrict
- The overall average booking lead time for vacation rentals in Racha Thewa Subdistrict is 23 days.
- Guests book furthest in advance for stays during October (average 39 days), likely coinciding with peak travel demand or local events.
- The shortest booking windows occur for stays in September (average 14 days), indicating more last-minute travel plans during this time.
- Seasonally, Winter (26 days avg.) sees the longest lead times, while Spring (21 days avg.) has the shortest, reflecting typical travel planning cycles.
Recommendations for Hosts
- Use the overall average lead time (23 days) as a baseline for your pricing and availability strategy in Racha Thewa Subdistrict.
- For October stays, consider implementing length-of-stay discounts or slightly higher rates for bookings made less than 39 days out to capitalize on advance planning.
- During September, focus on last-minute booking availability and promotions, as guests book with very short notice (14 days avg.).
- Target marketing efforts for the Winter season well in advance (at least 26 days) to capture early planners.
- Monitor your own booking lead times against these Racha Thewa Subdistrict averages to identify opportunities for dynamic pricing adjustments.
Popular & Essential Airbnb Amenities in Racha Thewa Subdistrict (2025)
Amenity Prevalence
Amenity Insights for Racha Thewa Subdistrict
- Essential amenities in Racha Thewa Subdistrict that guests expect include: Wifi, Air conditioning. Lacking these (any) could significantly impact bookings.
- Popular amenities like Free parking on premises, TV, Hair dryer are common but not universal. Offering these can provide a competitive edge.
Recommendations for Hosts
- Ensure your listing includes all essential amenities for Racha Thewa Subdistrict: Wifi, Air conditioning.
- Consider adding popular differentiators like Free parking on premises or TV to increase appeal.
- Highlight unique or less common amenities you offer (e.g., hot tub, dedicated workspace, EV charger) in your listing description and photos.
- Regularly check competitor amenities in Racha Thewa Subdistrict to stay competitive.
Racha Thewa Subdistrict Airbnb Guest Demographics & Profile Analysis (2025)
Guest Profile Summary for Racha Thewa Subdistrict
- The typical guest profile for Airbnb in Racha Thewa Subdistrict consists of predominantly international visitors (97%), with top international origins including United States, typically belonging to the Post-2000s (Gen Z/Alpha) group (50%), primarily speaking English or German.
- Domestic travelers account for 2.6% of guests.
- Key international markets include Canada (16.9%) and United States (13%).
- Top languages spoken are English (53.8%) followed by German (7.7%).
- A significant demographic segment is the Post-2000s (Gen Z/Alpha) group, representing 50% of guests.
Recommendations for Hosts
- Focus marketing internationally, particularly towards travelers from United States.
- Tailor amenities and listing descriptions to appeal to the dominant Post-2000s (Gen Z/Alpha) demographic (e.g., highlight fast WiFi, smart home features, local guides).
- Highlight unique local experiences or amenities relevant to the primary guest profile.
- Consider seasonal promotions aligned with peak travel times for key origin markets.
Nearby Short-Term Rental Market Comparison
How does the Racha Thewa Subdistrict Airbnb market stack up against its neighbors? Compare key performance metrics like average monthly revenue, ADR, and occupancy rates in surrounding areas to understand the broader regional STR landscape.
| Market | Active Properties | Monthly Revenue | Daily Rate | Avg. Occupancy |
|---|---|---|---|---|
| Huai Yai | 42 | $1,948 | $333.90 | 32% |
| Ban Malai Thap Tai | 11 | $1,804 | $276.99 | 33% |
| Nong Pla Lai | 13 | $1,796 | $250.79 | 33% |
| Pattaya | 142 | $1,563 | $248.15 | 35% |
| Ban Nong Hiang | 55 | $1,462 | $221.12 | 38% |
| Bang Lamung | 19 | $1,338 | $272.68 | 24% |
| Na Chom Thian | 180 | $1,315 | $217.50 | 34% |
| Nong Prue | 49 | $1,259 | $217.18 | 31% |
| Khao Chi Chan | 84 | $1,156 | $221.58 | 30% |
| Ban Nong Bua | 36 | $1,144 | $206.06 | 29% |