เทศบาลนครลำปาง Airbnb Market Analysis 2026: Short Term Rental Data & Vacation Rental Statistics in Lampang Province, Thailand
Is Airbnb profitable in เทศบาลนครลำปาง in 2026? Explore comprehensive Airbnb analytics for เทศบาลนครลำปาง, Lampang Province, Thailand to uncover income potential. This 2026 STR market report for เทศบาลนครลำปาง, based on AirROI data from February 2025 to January 2026, reveals key trends in the niche market of 25 active listings.
Whether you're considering an Airbnb investment in เทศบาลนครลำปาง, optimizing your existing vacation rental, or exploring rental arbitrage opportunities, understanding the เทศบาลนครลำปาง Airbnb data is crucial. Leveraging the low regulation environment is key to maximizing your short term rental income potential. Let's dive into the specifics.
Key เทศบาลนครลำปาง Airbnb Performance Metrics Overview
Monthly Airbnb Revenue Variations & Income Potential in เทศบาลนครลำปาง (2026)
Understanding the monthly revenue variations for Airbnb listings in เทศบาลนครลำปาง is key to maximizing your short term rental income potential. Seasonality significantly impacts earnings. Our analysis, based on data from the past 12 months, shows that the peak revenue month for STRs in เทศบาลนครลำปาง is typically December, while May often presents the lowest earnings, highlighting opportunities for strategic pricing adjustments during shoulder and low seasons. Explore the typical Airbnb income in เทศบาลนครลำปาง across different performance tiers:
- Best-in-class properties (Top 10%) achieve $686+ monthly, often utilizing dynamic pricing and superior guest experiences.
- Strong performing properties (Top 25%) earn $363 or more, indicating effective management and desirable locations/amenities.
- Typical properties (Median) generate around $162 per month, representing the average market performance.
- Entry-level properties (Bottom 25%) see earnings around $87, often with potential for optimization.
Average Monthly Airbnb Earnings Trend in เทศบาลนครลำปาง
เทศบาลน��ครลำปาง Airbnb Occupancy Rate Trends (2026)
Maximize your bookings by understanding the เทศบาลนครลำปาง STR occupancy trends. Seasonal demand shifts significantly influence how often properties are booked. Typically, Decembersees the highest demand (peak season occupancy), while May experiences the lowest (low season). Effective strategies, like adjusting minimum stays or offering promotions, can boost occupancy during slower periods. Here's how different property tiers perform in เทศบาลนครลำปาง:
- Best-in-class properties (Top 10%) achieve 49%+ occupancy, indicating high desirability and potentially optimized availability.
- Strong performing properties (Top 25%) maintain 32% or higher occupancy, suggesting good market fit and guest satisfaction.
- Typical properties (Median) have an occupancy rate around 17%.
- Entry-level properties (Bottom 25%) average 10% occupancy, potentially facing higher vacancy.
Average Monthly Occupancy Rate Trend in เทศบาลนครลำปาง
Average Daily Rate (ADR) Airbnb Trends in เทศบาลนครลำปาง (2026)
Effective short term rental pricing strategy in เทศบาลนครลำปาง involves understanding monthly ADR fluctuations. The Average Daily Rate (ADR) for Airbnb in เทศบาลนครลำปาง typically peaks in January and dips lowest during March. Leveraging Airbnb dynamic pricing tools or strategies based on this seasonality can significantly boost revenue. Here's a look at the typical nightly rates achieved:
- Best-in-class properties (Top 10%) command rates of $63+ per night, often due to premium features or locations.
- Strong performing properties (Top 25%) achieve nightly rates of $44 or more.
- Typical properties (Median) charge around $30 per night.
- Entry-level properties (Bottom 25%) earn around $22 per night.
Average Daily Rate (ADR) Trend by Month in เทศบาลนครลำปาง
Get Live เทศบาลนครลำปาง Market Intelligence 👇

Explore Real-time Analytics
Airbnb Seasonality Analysis & Trends in เทศบาลนครลำปาง (2026)
Peak Season (December, January, November)
- Revenue averages $379 per month
- Occupancy rates average 30.4%
- Daily rates average $38
Shoulder Season
- Revenue averages $275 per month
- Occupancy maintains around 22.6%
- Daily rates hold near $37
Low Season (May, June, September)
- Revenue drops to average $176 per month
- Occupancy decreases to average 16.0%
- Daily rates adjust to average $37
Seasonality Insights for เทศบาลนครลำปาง
- The Airbnb seasonality in เทศบาลนครลำปาง shows highly seasonal trends requiring careful strategy. While the sections above show seasonal averages, it's also insightful to look at the extremes:
- During the high season, the absolute peak month showcases เทศบาลนครลำปาง's highest earning potential, with monthly revenues capable of climbing to $429, occupancy reaching a high of 37.1%, and ADRs peaking at $38.
- Conversely, the slowest single month of the year, typically falling within the low season, marks the market's lowest point. In this month, revenue might dip to $166, occupancy could drop to 15.1%, and ADRs may adjust down to $36.
- Understanding both the seasonal averages and these monthly peaks and troughs in revenue, occupancy, and ADR is crucial for maximizing your Airbnb profit potential in เทศบาลนครลำปาง.
Seasonal Strategies for Maximizing Profit
- Peak Season: Maximize revenue through premium pricing and potentially longer minimum stays. Ensure high availability.
- Low Season: Offer competitive pricing, special promotions (e.g., extended stay discounts), and flexible cancellation policies. Target off-season travelers like remote workers or budget-conscious guests.
- Shoulder Seasons: Implement dynamic pricing that balances peak and low rates. Target weekend travelers or specific events. Offer slightly more flexible terms than peak season.
- Regularly analyze your own performance against these เทศบาลนครลำปาง seasonality benchmarks and adjust your pricing and availability strategy accordingly.
Best Areas for Airbnb Investment in เทศบาลนครลำปาง (2026)
Exploring the top neighborhoods for short-term rentals in เทศบาลนครลำปาง? This section highlights key areas, outlining why they are attractive for hosts and guests, along with notable local attractions. Consider these locations based on your target guest profile and investment strategy.
| Neighborhood / Area | Why Host Here? (Target Guests & Appeal) | Key Attractions & Landmarks |
|---|---|---|
| เมืองลำปาง (Lampang City) | The capital of Lampang Province, known for its rich culture and history. Great location for travelers interested in local attractions and markets. | Wat Phra That Lampang Luang, Lampang Railway Station, Lampang Night Market, Elephant Conservation Center, Wat Si Rong Mueang |
| ป่าตัน (Pa Tan) | A peaceful area close to nature, popular among those looking for retreats and nature excursions. Ideal for eco-tourism and relaxation. | Doi Khun Tan National Park, Kwan Phayao, Rice fields, Local hill tribe villages |
| อำเภอเมือง (Muang District) | A strategic location close to major roads and transportation hubs, ideal for visitors traveling around Lampang. | Lampang Museum, Wat Chedi Sao, King Cobra Village |
| ลำปาง (Lampang) | A vibrant area with a mix of local markets and traditional architecture, perfect for cultural experiences and local cuisine. | Lampang Lantern Festival, Mae Moh Mine, Art Street |
| วัดพระแก้ว (Wat Phra Kaew) | A historic and spiritual area attracting visitors interested in Thai Buddhism and architecture. | Wat Phra Kaew, Local festivals, Temple architecture |
| เขลางค์นคร (Khelang Nakorn) | A bustling area that offers a variety of dining and shopping experiences for tourists. | CentralPlaza Lampang, Local dining spots, Shopping districts |
| ปางหวาย (Pang Wai) | Tranquil village atmosphere, popular among travelers wanting to escape the city life and explore rural Thailand. | Natural scenery, Local farms, Cultural interactions |
| โครงการสวนสาธารณะ (Public Park Project) | New development area with potential for tourism and outdoor activities, suitable for family-friendly stays. | Park facilities, Outdoor events, Local community activities |
Understanding Airbnb License Requirements & STR Laws in เทศบาลนครลำปาง (2026)
While เทศบาลนครลำปาง, Lampang Province, Thailand currently shows low STR regulations, specific Airbnb license requirements might still exist or change. Always verify the latest short term rental regulations and Airbnb license requirements directly with local government authorities for เทศบาลนครลำปาง to ensure full compliance before hosting.
(Source: AirROI data, 2026, finding no licensed listings among those analyzed)
Top Performing Airbnb Properties in เทศบาลนครลำปาง (2026)
Benchmark your potential! Explore examples of top-performing Airbnb properties in เทศบาลนครลำปางbased on Trailing Twelve Month (TTM) revenue. Analyze their characteristics, revenue, occupancy rate, and ADR to understand what drives success in this market.

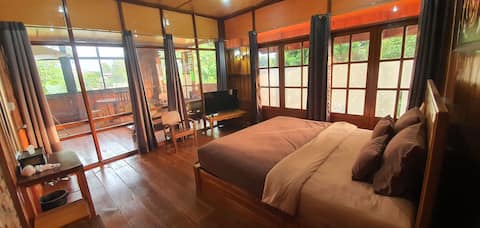
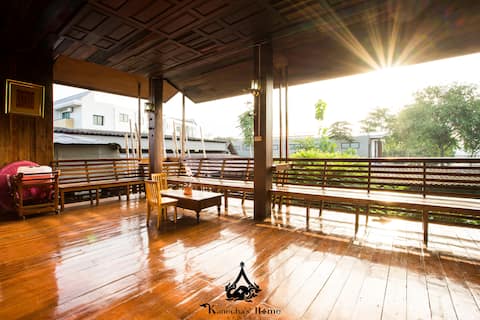
Kanecha's Home Lampang (Water Front House)
Entire Place • 2 bedrooms
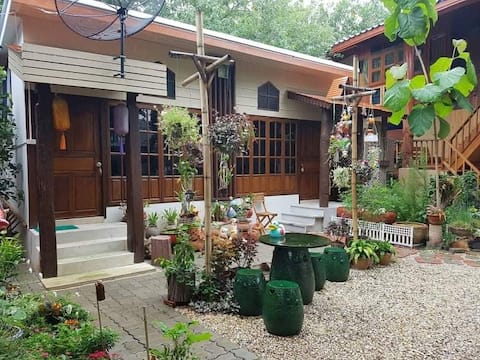
Kanecha's Home (Teak House)
Private Room • 1 bedroom
Kanecha's Home Lampang (Double King Room)-Green
Private Room • N/A

Karpenter Premier Garden View
Private Room • 1 bedroom

SKY - Fong Lee CC Lampang
Private Room • N/A
Kanecha's Home Lampang (Wooden House, Upper Floor)
Entire Place • 2 bedrooms
Note: Performance varies based on location, size, amenities, seasonality, and management quality. Data reflects the past 12 months.
Top Performing Airbnb Hosts in เทศบาลนครลำปาง (2026)
Learn from the best! This table showcases top-performing Airbnb hosts in เทศบาลนครลำปาง based on the number of properties managed and estimated total revenue over the past year. Analyze their scale and performance metrics.
| Host Name | Properties | Grossing Revenue | Stay Reviews | Avg Rating |
|---|---|---|---|---|
| Kanokrak | 11 | $32,006 | 146 | 4.85/5.0 |
| Fong Lee CC | 3 | $6,622 | 14 | 5.00/5.0 |
| Nisit | 1 | $3,954 | 1 | Not Rated |
| Pangsuree | 1 | $2,382 | 1 | Not Rated |
| Jintana | 3 | $2,298 | 24 | 4.90/5.0 |
| Sansanee | 2 | $1,007 | 16 | 4.64/5.0 |
| Anucha | 1 | $336 | 2 | Not Rated |
| Host #459698546 | 1 | $172 | 2 | Not Rated |
| Zoey Lee | 1 | $150 | 1 | Not Rated |
| Zoey Lee | 1 | $103 | 1 | Not Rated |
Analyzing the strategies of top hosts, such as their property selection, pricing, and guest communication, can offer valuable lessons for optimizing your own Airbnb operations in เทศบาลนครลำปาง.
Dive Deeper: Advanced เทศบาลนครลำปาง STR Market Data (2026)
Ready to unlock more insights? AirROI provides access to advanced metrics and comprehensive Airbnb data for เทศบาลนครลำปาง. Explore detailed analytics beyond this report to refine your investment strategy, optimize pricing, and maximize your vacation rental profits.
Explore Advanced Metricsเทศบาลนครลำปาง Short-Term Rental Market Composition (2026): Property & Room Types
Room Type Distribution
Property Type Distribution
Market Composition Insights for เทศบาลนครลำปาง
- The เทศบาลนครลำปาง Airbnb market composition is heavily skewed towards Private Room listings, which make up 84% of the 25 active rentals. This indicates strong guest preference for privacy and space.
- Looking at the property type distribution in เทศบาลนครลำปาง, House properties are the most common (40%), reflecting the local real estate landscape.
- Houses represent a significant 40% portion, catering likely to families or larger groups.
- The presence of 36% Hotel/Boutique listings indicates integration with traditional hospitality.
เทศบาลนครลำปาง Airbnb Room Capacity Analysis (2026): Bedroom Distribution
Distribution of Listings by Number of Bedrooms
Room Capacity Insights for เทศบาลนครลำปาง
- The dominant room capacity in เทศบาลนครลำปาง is 1 bedroom listings, making up 40% of the market. This suggests a strong demand for properties suitable for couples or solo travelers.
- Together, 1 bedroom and 2 bedrooms properties represent 52.0% of the active Airbnb listings in เทศบาลนครลำปาง, indicating a high concentration in these sizes.
เทศบาลนครลำปาง Vacation Rental Guest Capacity Trends (2026)
Distribution of Listings by Guest Capacity
Guest Capacity Insights for เทศบาลนครลำปาง
- The most common guest capacity trend in เทศบาลนครลำปาง vacation rentals is listings accommodating 2 guests (32%). This suggests the primary traveler segment is likely couples or solo travelers.
- Properties designed for 2 guests and 3 guests dominate the เทศบาลนครลำปาง STR market, accounting for 48.0% of listings.
- On average, properties in เทศบาลนครลำปาง are equipped to host 1.5 guests.
เทศบาลนครลำปาง Airbnb Booking Patterns (2026): Available vs. Booked Days
Available Days Distribution
Booked Days Distribution
Booking Pattern Insights for เทศบาลนครลำปาง
- The most common availability pattern in เทศบาลนครลำปาง falls within the 271-366 days range, representing 88% of listings. This suggests many properties have significant open periods on their calendars.
- Approximately 100.0% of listings show high availability (181+ days open annually), indicating potential for increased bookings or specific owner usage patterns.
- For booked days, the 1-30 days range is most frequent in เทศบาลนครลำปาง (48%), reflecting common guest stay durations or potential owner blocking patterns.
เทศบาลนครลำปาง Airbnb Minimum Stay Requirements Analysis
Distribution of Listings by Minimum Night Requirement
1 Night
25 listings
100% of total
Key Insights
- The most prevalent minimum stay requirement in เทศบาลนครลำปาง is 1 Night, adopted by 100% of listings. This highlights the market's preference for shorter, flexible bookings.
- A strong majority (100.0%) of the เทศบาลนครลำปาง Airbnb data shows acceptance of very short stays (1-2 nights), indicating a dynamic, high-turnover market.
Recommendations
- Align with the market by considering a 1 Night minimum stay, as 100% of เทศบาลนครลำปาง hosts use this setting.
- Adjust minimum nights based on seasonality – potentially shorter during low season and longer during peak demand periods in เทศบาลนครลำปาง.
เทศบาลนครลำปาง Airbnb Cancellation Policy Trends Analysis (2026)
Flexible
4 listings
16.7% of total
Moderate
19 listings
79.2% of total
Strict
1 listings
4.2% of total
Cancellation Policy Insights for เทศบาลนครลำปาง
- The prevailing Airbnb cancellation policy trend in เทศบาลนครลำปาง is Moderate, used by 79.2% of listings.
- The market strongly favors guest-friendly terms, with 95.9% of listings offering Flexible or Moderate policies. This suggests guests in เทศบาลนครลำปาง may expect booking flexibility.
- Strict cancellation policies are quite rare (4.2%), potentially making listings with this policy less competitive unless justified by high demand or property type.
Recommendations for Hosts
- Consider adopting a Moderate policy to align with the 79.2% market standard in เทศบาลนครลำปาง.
- Using a Strict policy might deter some guests, as only 4.2% of listings use it. Evaluate if potential revenue protection outweighs possible lower booking rates.
- Regularly review your cancellation policy against competitors and market demand shifts in เทศบาลนครลำปาง.
เทศบาลนครลำปาง STR Booking Lead Time Analysis (2026)
Average Booking Lead Time by Month
Booking Lead Time Insights for เทศบาลนครลำปาง
- The overall average booking lead time for vacation rentals in เทศบาลนครลำปาง is 45 days.
- Guests book furthest in advance for stays during June (average 91 days), likely coinciding with peak travel demand or local events.
- The shortest booking windows occur for stays in September (average 31 days), indicating more last-minute travel plans during this time.
- Seasonally, Summer (60 days avg.) sees the longest lead times, while Spring (42 days avg.) has the shortest, reflecting typical travel planning cycles.
Recommendations for Hosts
- Use the overall average lead time (45 days) as a baseline for your pricing and availability strategy in เทศบาลนครลำปาง.
- For June stays, consider implementing length-of-stay discounts or slightly higher rates for bookings made less than 91 days out to capitalize on advance planning.
- Target marketing efforts for the Summer season well in advance (at least 60 days) to capture early planners.
- Monitor your own booking lead times against these เทศบาลนครลำปาง averages to identify opportunities for dynamic pricing adjustments.
Popular & Essential Airbnb Amenities in เทศบาลนครลำปาง (2026)
Amenity Prevalence
Amenity Insights for เทศบาลนครลำปาง
- Essential amenities in เทศบาลนครลำปาง that guests expect include: Free parking on premises, Air conditioning. Lacking these (any) could significantly impact bookings.
- Popular amenities like TV, Wifi, Hair dryer are common but not universal. Offering these can provide a competitive edge.
- Warning: Wifi is not universally provided but is considered essential globally. Ensure reliable Wifi is offered.
Recommendations for Hosts
- Ensure your listing includes all essential amenities for เทศบาลนครลำปาง: Free parking on premises, Air conditioning.
- Prioritize adding missing essentials: Free parking on premises, Air conditioning.
- Consider adding popular differentiators like TV or Wifi to increase appeal.
- Highlight unique or less common amenities you offer (e.g., hot tub, dedicated workspace, EV charger) in your listing description and photos.
- Regularly check competitor amenities in เทศบาลนครลำปาง to stay competitive.
เทศบาลนครลำปาง Airbnb Guest Demographics & Profile Analysis (2026)
Guest Profile Summary for เทศบาลนครลำปาง
- The typical guest profile for Airbnb in เทศบาลนครลำปาง consists of predominantly international visitors (77%), with top international origins including Thailand, typically belonging to the Post-2000s (Gen Z/Alpha) group (50%), primarily speaking English or French.
- Domestic travelers account for 22.7% of guests.
- Key international markets include United States (31.8%) and Thailand (22.7%).
- Top languages spoken are English (46.7%) followed by French (20%).
- A significant demographic segment is the Post-2000s (Gen Z/Alpha) group, representing 50% of guests.
Recommendations for Hosts
- Focus marketing internationally, particularly towards travelers from Thailand.
- Tailor amenities and listing descriptions to appeal to the dominant Post-2000s (Gen Z/Alpha) demographic (e.g., highlight fast WiFi, smart home features, local guides).
- Highlight unique local experiences or amenities relevant to the primary guest profile.
- Consider seasonal promotions aligned with peak travel times for key origin markets.
Nearby Short-Term Rental Market Comparison
How does the เทศบาลนครลำปาง Airbnb market stack up against its neighbors? Compare key performance metrics like average monthly revenue, ADR, and occupancy rates in surrounding areas to understand the broader regional STR landscape.
| Market | Active Properties | Monthly Revenue | Daily Rate | Avg. Occupancy |
|---|---|---|---|---|
| San Phranet | 10 | $1,693 | $253.12 | 37% |
| Mae Rim | 11 | $1,196 | $171.86 | 32% |
| Tambon Si Phum | 29 | $1,166 | $81.79 | 47% |
| Ban Muang Kung | 10 | $1,033 | $172.00 | 29% |
| Don Keow Village | 23 | $1,023 | $137.65 | 33% |
| Si Phum | 23 | $959 | $108.01 | 50% |
| Ban Tom | 11 | $930 | $141.78 | 34% |
| Ban Pong | 13 | $907 | $180.20 | 29% |
| Nong Hoi | 194 | $830 | $77.75 | 45% |
| Ban Rong Ruea Kham | 19 | $826 | $110.36 | 35% |