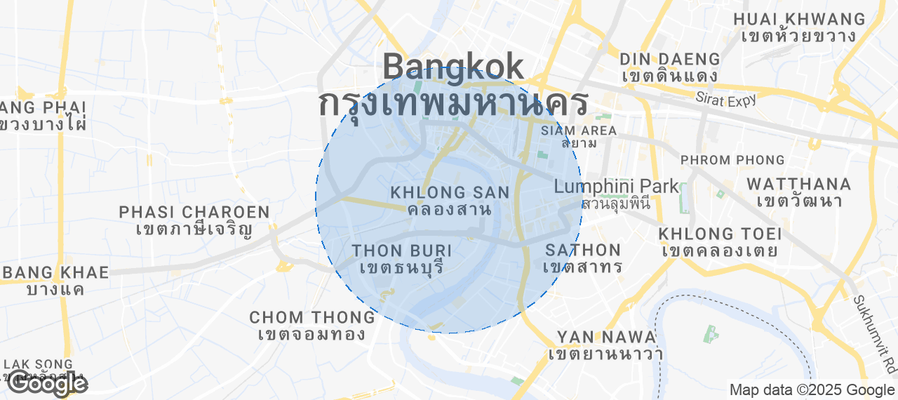
Khet Khlong San Airbnb Market Analysis 2026: Short Term Rental Data & Vacation Rental Statistics in Krung Thep Maha Nakhon, Thailand
Is Airbnb profitable in Khet Khlong San in 2026? Explore comprehensive Airbnb analytics for Khet Khlong San, Krung Thep Maha Nakhon, Thailand to uncover income potential. This 2026 STR market report for Khet Khlong San, based on AirROI data from February 2025 to January 2026, reveals key trends in the niche market of 60 active listings.
Whether you're considering an Airbnb investment in Khet Khlong San, optimizing your existing vacation rental, or exploring rental arbitrage opportunities, understanding the Khet Khlong San Airbnb data is crucial. Leveraging the low regulation environment is key to maximizing your short term rental income potential. Let's dive into the specifics.
Key Khet Khlong San Airbnb Performance Metrics Overview
Monthly Airbnb Revenue Variations & Income Potential in Khet Khlong San (2026)
Understanding the monthly revenue variations for Airbnb listings in Khet Khlong San is key to maximizing your short term rental income potential. Seasonality significantly impacts earnings. Our analysis, based on data from the past 12 months, shows that the peak revenue month for STRs in Khet Khlong San is typically December, while May often presents the lowest earnings, highlighting opportunities for strategic pricing adjustments during shoulder and low seasons. Explore the typical Airbnb income in Khet Khlong San across different performance tiers:
- Best-in-class properties (Top 10%) achieve $1,000+ monthly, often utilizing dynamic pricing and superior guest experiences.
- Strong performing properties (Top 25%) earn $656 or more, indicating effective management and desirable locations/amenities.
- Typical properties (Median) generate around $433 per month, representing the average market performance.
- Entry-level properties (Bottom 25%) see earnings around $221, often with potential for optimization.
Average Monthly Airbnb Earnings Trend in Khet Khlong San
Khet Khlong San Airbnb Occupancy Rate Trends (2026)
Maximize your bookings by understanding the Khet Khlong San STR occupancy trends. Seasonal demand shifts significantly influence how often properties are booked. Typically, Decembersees the highest demand (peak season occupancy), while May experiences the lowest (low season). Effective strategies, like adjusting minimum stays or offering promotions, can boost occupancy during slower periods. Here's how different property tiers perform in Khet Khlong San:
- Best-in-class properties (Top 10%) achieve 80%+ occupancy, indicating high desirability and potentially optimized availability.
- Strong performing properties (Top 25%) maintain 70% or higher occupancy, suggesting good market fit and guest satisfaction.
- Typical properties (Median) have an occupancy rate around 52%.
- Entry-level properties (Bottom 25%) average 25% occupancy, potentially facing higher vacancy.
Average Monthly Occupancy Rate Trend in Khet Khlong San
Average Daily Rate (ADR) Airbnb Trends in Khet Khlong San (2026)
Effective short term rental pricing strategy in Khet Khlong San involves understanding monthly ADR fluctuations. The Average Daily Rate (ADR) for Airbnb in Khet Khlong San typically peaks in December and dips lowest during July. Leveraging Airbnb dynamic pricing tools or strategies based on this seasonality can significantly boost revenue. Here's a look at the typical nightly rates achieved:
- Best-in-class properties (Top 10%) command rates of $49+ per night, often due to premium features or locations.
- Strong performing properties (Top 25%) achieve nightly rates of $34 or more.
- Typical properties (Median) charge around $24 per night.
- Entry-level properties (Bottom 25%) earn around $21 per night.
Average Daily Rate (ADR) Trend by Month in Khet Khlong San
Get Live Khet Khlong San Market Intelligence 👇
Explore Real-time Analytics
Airbnb Seasonality Analysis & Trends in Khet Khlong San (2026)
Peak Season (December, January, November)
- Revenue averages $833 per month
- Occupancy rates average 54.3%
- Daily rates average $43
Shoulder Season
- Revenue averages $504 per month
- Occupancy maintains around 45.5%
- Daily rates hold near $33
Low Season (February, March, April)
- Revenue drops to average $0 per month
- Occupancy decreases to average 0.0%
- Daily rates adjust to average $32
Seasonality Insights for Khet Khlong San
- The Airbnb seasonality in Khet Khlong San shows highly seasonal trends requiring careful strategy. While the sections above show seasonal averages, it's also insightful to look at the extremes:
- During the high season, the absolute peak month showcases Khet Khlong San's highest earning potential, with monthly revenues capable of climbing to $961, occupancy reaching a high of 61.2%, and ADRs peaking at $44.
- Conversely, the slowest single month of the year, typically falling within the low season, marks the market's lowest point. In this month, revenue might dip to $0, occupancy could drop to 0.0%, and ADRs may adjust down to $30.
- Understanding both the seasonal averages and these monthly peaks and troughs in revenue, occupancy, and ADR is crucial for maximizing your Airbnb profit potential in Khet Khlong San.
Seasonal Strategies for Maximizing Profit
- Peak Season: Maximize revenue through premium pricing and potentially longer minimum stays. Ensure high availability.
- Low Season: Offer competitive pricing, special promotions (e.g., extended stay discounts), and flexible cancellation policies. Target off-season travelers like remote workers or budget-conscious guests.
- Shoulder Seasons: Implement dynamic pricing that balances peak and low rates. Target weekend travelers or specific events. Offer slightly more flexible terms than peak season.
- Regularly analyze your own performance against these Khet Khlong San seasonality benchmarks and adjust your pricing and availability strategy accordingly.
Best Areas for Airbnb Investment in Khet Khlong San (2026)
Exploring the top neighborhoods for short-term rentals in Khet Khlong San? This section highlights key areas, outlining why they are attractive for hosts and guests, along with notable local attractions. Consider these locations based on your target guest profile and investment strategy.
| Neighborhood / Area | Why Host Here? (Target Guests & Appeal) | Key Attractions & Landmarks |
|---|---|---|
| Khlong San Riverside | Beautiful riverside location that offers stunning views of the Chao Phraya River and easy access to cultural hotspots. It attracts tourists looking for a blend of relaxation and sightseeing. | Asiatique The Riverfront, Icon Siam, Wat Arun, River City Bangkok, Ferry rides along the Chao Phraya River |
| Taksin | A bustling area with a mix of business and residential spaces. Great for both business travelers and tourists due to its central location and access to public transportation. | Taksin Bridge, Sky Bar at Lebua, Sathorn Pier, Bangkok Flower Market, Chao Phraya River Boat Tours |
| Chinatown | One of the oldest and most vibrant neighborhoods in Bangkok, famous for its street food and rich history. Attractive for those seeking authentic cultural experiences. | Yaowarat Road, Wat Traimit, Chinatown Street Markets, Pak Khlong Talat, Golden Buddha |
| Wongwian Yai | An emerging neighborhood popular with locals and tourists alike. Offers a mix of local lifestyle and accessibility to explore further attractions in Bangkok. | Wongwian Yai Skytrain Station, Local markets, Wat Kallaya, Bangkok Noi Canal, Cultural exhibitions |
| Bangkok Yai | A growing area with a traditional vibe, ideal for travelers looking for a peaceful retreat while still being close to major attractions. | Phutthamonthon, Wat Phra Si Mahathat, Local canal tours, Green parks, Traditional Thai food stalls |
| Charan Sanitwong | A vibrant neighborhood favored by locals with plenty of eateries and local shopping. It's becoming more popular with tourists and offers affordable stays. | Charan Sanitwong Street Market, Local temples, Jatujak Park, Canal Kawinan, Ministries of Education and Culture |
| Phasi Charoen | Known for its unique canals and quiet atmosphere. Great for those looking to experience a less touristy side of Bangkok without sacrificing convenience. | Phasi Charoen Canal, Wat Luang Por Khao, Bangkok's quiet parks, Local fishing villages, Traditional Thai restaurants |
| Khlong San Community Market | A hidden gem where travelers can explore local cuisine and crafts. It’s popular for its authentic shopping atmosphere and friendly locals. | Khlong San Community Market, Wat Yai Chai Mongkhon, Local handicrafts stalls, Street food options, Cultural workshops |
Understanding Airbnb License Requirements & STR Laws in Khet Khlong San (2026)
While Khet Khlong San, Krung Thep Maha Nakhon, Thailand currently shows low STR regulations, specific Airbnb license requirements might still exist or change. Always verify the latest short term rental regulations and Airbnb license requirements directly with local government authorities for Khet Khlong San to ensure full compliance before hosting.
(Source: AirROI data, 2026, finding no licensed listings among those analyzed)
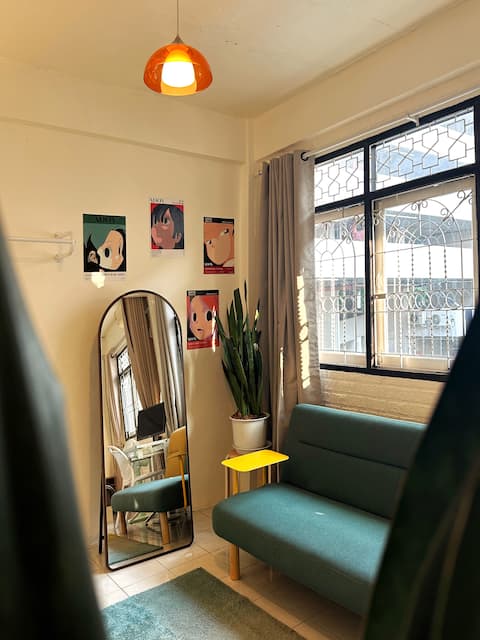
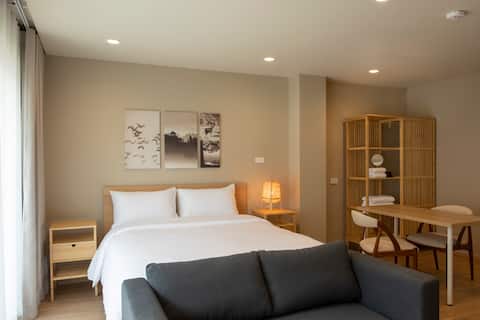
Top Performing Airbnb Properties in Khet Khlong San (2026)
Benchmark your potential! Explore examples of top-performing Airbnb properties in Khet Khlong Sanbased on Trailing Twelve Month (TTM) revenue. Analyze their characteristics, revenue, occupancy rate, and ADR to understand what drives success in this market.
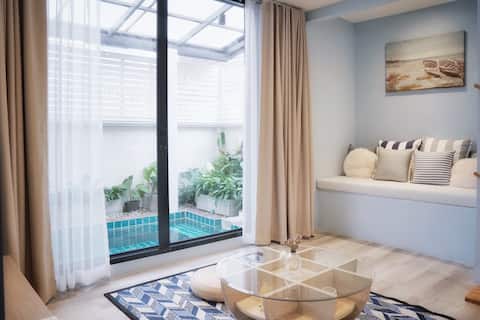
Homey 3 br with pool, 1 stop from Iconsiam
Entire Place • 3 bedrooms
Spacious Garden Home near Iconsiam & River
Entire Place • 3 bedrooms

Spacious Retreat—Private Floor Near BTS&Iconsiam
Private Room • N/A
Warm, Private Room Near Iconsiam&BTS
Private Room • N/A

Peaceful Rooftop Hideaway Near BTS & Iconsiam
Private Room • N/A
(D201) 3 Beds for 4-6 guests+kitchen(whole floor)
Entire Place • N/A
Note: Performance varies based on location, size, amenities, seasonality, and management quality. Data reflects the past 12 months.
Top Performing Airbnb Hosts in Khet Khlong San (2026)
Learn from the best! This table showcases top-performing Airbnb hosts in Khet Khlong San based on the number of properties managed and estimated total revenue over the past year. Analyze their scale and performance metrics.
| Host Name | Properties | Grossing Revenue | Stay Reviews | Avg Rating |
|---|---|---|---|---|
| Thidaporn | 1 | $57,002 | 27 | 5.00/5.0 |
| Tararat | 11 | $43,071 | 201 | 4.95/5.0 |
| Kanitta | 3 | $23,894 | 181 | 4.98/5.0 |
| Dan | 14 | $20,649 | 32 | 4.79/5.0 |
| Jittirat | 10 | $17,965 | 214 | 4.68/5.0 |
| Natboonthawat | 1 | $14,559 | 46 | 4.89/5.0 |
| Vicky | 4 | $13,050 | 59 | 4.93/5.0 |
| Sontana | 2 | $6,538 | 5 | 5.00/5.0 |
| Hana | 3 | $5,918 | 11 | 4.67/5.0 |
| ICe | 4 | $4,594 | 8 | 5.00/5.0 |
Analyzing the strategies of top hosts, such as their property selection, pricing, and guest communication, can offer valuable lessons for optimizing your own Airbnb operations in Khet Khlong San.
Dive Deeper: Advanced Khet Khlong San STR Market Data (2026)
Ready to unlock more insights? AirROI provides access to advanced metrics and comprehensive Airbnb data for Khet Khlong San. Explore detailed analytics beyond this report to refine your investment strategy, optimize pricing, and maximize your vacation rental profits.
Explore Advanced MetricsKhet Khlong San Short-Term Rental Market Composition (2026): Property & Room Types
Room Type Distribution
Property Type Distribution
Market Composition Insights for Khet Khlong San
- The Khet Khlong San Airbnb market composition is heavily skewed towards Entire Home/Apt listings, which make up 76.7% of the 60 active rentals. This indicates strong guest preference for privacy and space.
- Looking at the property type distribution in Khet Khlong San, Apartment/Condo properties are the most common (91.7%), reflecting the local real estate landscape.
Khet Khlong San Airbnb Room Capacity Analysis (2026): Bedroom Distribution
Distribution of Listings by Number of Bedrooms
Room Capacity Insights for Khet Khlong San
- The dominant room capacity in Khet Khlong San is 1 bedroom listings, making up 66.7% of the market. This suggests a strong demand for properties suitable for couples or solo travelers.
- Together, 1 bedroom and 3 bedrooms properties represent 70.0% of the active Airbnb listings in Khet Khlong San, indicating a high concentration in these sizes.
- With over half the market (66.7%) consisting of studios or 1-bedroom units, Khet Khlong San is particularly well-suited for individuals or couples.
- Listings with 3+ bedrooms (3.3%) represent a smaller niche, potentially indicating an underserved market for larger group accommodations in Khet Khlong San.
Khet Khlong San Vacation Rental Guest Capacity Trends (2026)
Distribution of Listings by Guest Capacity
Guest Capacity Insights for Khet Khlong San
- The most common guest capacity trend in Khet Khlong San vacation rentals is listings accommodating 2 guests (61.7%). This suggests the primary traveler segment is likely couples or solo travelers.
- Properties designed for 2 guests and 3 guests dominate the Khet Khlong San STR market, accounting for 68.4% of listings.
- A significant 61.7% of listings cater specifically to 1-2 guests, highlighting strong demand from couples and solo travelers in Khet Khlong San.
- On average, properties in Khet Khlong San are equipped to host 1.9 guests.
Khet Khlong San Airbnb Booking Patterns (2026): Available vs. Booked Days
Available Days Distribution
Booked Days Distribution
Booking Pattern Insights for Khet Khlong San
- The most common availability pattern in Khet Khlong San falls within the 271-366 days range, representing 50% of listings. This suggests many properties have significant open periods on their calendars.
- Approximately 90.0% of listings show high availability (181+ days open annually), indicating potential for increased bookings or specific owner usage patterns.
- For booked days, the 91-180 days range is most frequent in Khet Khlong San (36.7%), reflecting common guest stay durations or potential owner blocking patterns.
- A notable 15.0% of properties secure long booking periods (181+ days booked per year), highlighting successful long-term rental strategies or significant owner usage.
Khet Khlong San Airbnb Minimum Stay Requirements Analysis
Distribution of Listings by Minimum Night Requirement
1 Night
4 listings
6.7% of total
2 Nights
14 listings
23.3% of total
3 Nights
1 listings
1.7% of total
4-6 Nights
11 listings
18.3% of total
7-29 Nights
23 listings
38.3% of total
30+ Nights
7 listings
11.7% of total
Key Insights
- The most prevalent minimum stay requirement in Khet Khlong San is 7-29 Nights, adopted by 38.3% of listings. This highlights the market's preference for shorter, flexible bookings.
- A significant segment (11.7%) caters to monthly stays (30+ nights) in Khet Khlong San, pointing to opportunities in the extended-stay market.
Recommendations
- Align with the market by considering a 7-29 Nights minimum stay, as 38.3% of Khet Khlong San hosts use this setting.
- If feasible, allowing 1-night stays, especially midweek or during low season, could capture last-minute bookings, as only 6.7% currently do.
- Explore offering discounts for stays of 30+ nights to attract the 11.7% of the market seeking extended stays.
- Adjust minimum nights based on seasonality – potentially shorter during low season and longer during peak demand periods in Khet Khlong San.
Khet Khlong San Airbnb Cancellation Policy Trends Analysis (2026)
Flexible
22 listings
36.7% of total
Moderate
8 listings
13.3% of total
Firm
24 listings
40% of total
Strict
6 listings
10% of total
Cancellation Policy Insights for Khet Khlong San
- The prevailing Airbnb cancellation policy trend in Khet Khlong San is Firm, used by 40% of listings.
- There's a relatively balanced mix between guest-friendly (50.0%) and stricter (50.0%) policies, offering choices for different guest needs.
Recommendations for Hosts
- Consider adopting a Firm policy to align with the 40% market standard in Khet Khlong San.
- Using a Strict policy might deter some guests, as only 10% of listings use it. Evaluate if potential revenue protection outweighs possible lower booking rates.
- Regularly review your cancellation policy against competitors and market demand shifts in Khet Khlong San.
Khet Khlong San STR Booking Lead Time Analysis (2026)
Average Booking Lead Time by Month
Booking Lead Time Insights for Khet Khlong San
- The overall average booking lead time for vacation rentals in Khet Khlong San is 17 days.
- Guests book furthest in advance for stays during January (average 31 days), likely coinciding with peak travel demand or local events.
- The shortest booking windows occur for stays in April (average 0 days), indicating more last-minute travel plans during this time.
- Seasonally, Fall (21 days avg.) sees the longest lead times, while Spring (0 days avg.) has the shortest, reflecting typical travel planning cycles.
Recommendations for Hosts
- Use the overall average lead time (17 days) as a baseline for your pricing and availability strategy in Khet Khlong San.
- For January stays, consider implementing length-of-stay discounts or slightly higher rates for bookings made less than 31 days out to capitalize on advance planning.
- During April, focus on last-minute booking availability and promotions, as guests book with very short notice (0 days avg.).
- Target marketing efforts for the Fall season well in advance (at least 21 days) to capture early planners.
- Monitor your own booking lead times against these Khet Khlong San averages to identify opportunities for dynamic pricing adjustments.
Popular & Essential Airbnb Amenities in Khet Khlong San (2026)
Amenity Prevalence
Amenity Insights for Khet Khlong San
- Essential amenities in Khet Khlong San that guests expect include: Wifi, Air conditioning. Lacking these (any) could significantly impact bookings.
- Popular amenities like Washer, TV, Shampoo are common but not universal. Offering these can provide a competitive edge.
Recommendations for Hosts
- Ensure your listing includes all essential amenities for Khet Khlong San: Wifi, Air conditioning.
- Prioritize adding missing essentials: Air conditioning.
- Consider adding popular differentiators like Washer or TV to increase appeal.
- Highlight unique or less common amenities you offer (e.g., hot tub, dedicated workspace, EV charger) in your listing description and photos.
- Regularly check competitor amenities in Khet Khlong San to stay competitive.
Khet Khlong San Airbnb Guest Demographics & Profile Analysis (2026)
Guest Profile Summary for Khet Khlong San
- The typical guest profile for Airbnb in Khet Khlong San consists of predominantly international visitors (98%), with top international origins including Philippines, typically belonging to the Post-2000s (Gen Z/Alpha) group (50%), primarily speaking English or Spanish.
- Domestic travelers account for 2.4% of guests.
- Key international markets include United States (10.1%) and Philippines (9.8%).
- Top languages spoken are English (42.7%) followed by Spanish (7.1%).
- A significant demographic segment is the Post-2000s (Gen Z/Alpha) group, representing 50% of guests.
Recommendations for Hosts
- Focus marketing internationally, particularly towards travelers from Philippines.
- Tailor amenities and listing descriptions to appeal to the dominant Post-2000s (Gen Z/Alpha) demographic (e.g., highlight fast WiFi, smart home features, local guides).
- Highlight unique local experiences or amenities relevant to the primary guest profile.
- Consider seasonal promotions aligned with peak travel times for key origin markets.
Nearby Short-Term Rental Market Comparison
How does the Khet Khlong San Airbnb market stack up against its neighbors? Compare key performance metrics like average monthly revenue, ADR, and occupancy rates in surrounding areas to understand the broader regional STR landscape.
| Market | Active Properties | Monthly Revenue | Daily Rate | Avg. Occupancy |
|---|---|---|---|---|
| Huai Yai | 36 | $1,984 | $287.17 | 32% |
| Nong Pla Lai | 13 | $1,685 | $240.23 | 31% |
| Ban Malai Thap Tai | 10 | $1,519 | $255.38 | 28% |
| Khet Bang Rak | 35 | $1,299 | $104.31 | 50% |
| Ban Nong Hiang | 56 | $1,169 | $216.74 | 37% |
| Ban Nong Bua | 34 | $1,162 | $179.93 | 28% |
| Bang Lamung | 16 | $1,089 | $242.13 | 25% |
| Pathum Wan | 27 | $1,083 | $106.21 | 48% |
| Khao Chi Chan | 71 | $1,028 | $216.66 | 27% |
| Suan Luang | 14 | $951 | $79.56 | 53% |