Hengchun Airbnb Market Analysis 2026: Short Term Rental Data & Vacation Rental Statistics in Pingtung County, Taiwan
Is Airbnb profitable in Hengchun in 2026? Explore comprehensive Airbnb analytics for Hengchun, Pingtung County, Taiwan to uncover income potential. This 2026 STR market report for Hengchun, based on AirROI data from February 2025 to January 2026, reveals key trends in the market of 535 active listings.
Whether you're considering an Airbnb investment in Hengchun, optimizing your existing vacation rental, or exploring rental arbitrage opportunities, understanding the Hengchun Airbnb data is crucial. Leveraging the low regulation environment is key to maximizing your short term rental income potential. Let's dive into the specifics.
Key Hengchun Airbnb Performance Metrics Overview
Monthly Airbnb Revenue Variations & Income Potential in Hengchun (2026)
Understanding the monthly revenue variations for Airbnb listings in Hengchun is key to maximizing your short term rental income potential. Seasonality significantly impacts earnings. Our analysis, based on data from the past 12 months, shows that the peak revenue month for STRs in Hengchun is typically August, while February often presents the lowest earnings, highlighting opportunities for strategic pricing adjustments during shoulder and low seasons. Explore the typical Airbnb income in Hengchun across different performance tiers:
- Best-in-class properties (Top 10%) achieve $2,455+ monthly, often utilizing dynamic pricing and superior guest experiences.
- Strong performing properties (Top 25%) earn $1,079 or more, indicating effective management and desirable locations/amenities.
- Typical properties (Median) generate around $451 per month, representing the average market performance.
- Entry-level properties (Bottom 25%) see earnings around $182, often with potential for optimization.
Average Monthly Airbnb Earnings Trend in Hengchun
Hengchun Airbnb Occupancy Rate Trends (2026)
Maximize your bookings by understanding the Hengchun STR occupancy trends. Seasonal demand shifts significantly influence how often properties are booked. Typically, Augustsees the highest demand (peak season occupancy), while February experiences the lowest (low season). Effective strategies, like adjusting minimum stays or offering promotions, can boost occupancy during slower periods. Here's how different property tiers perform in Hengchun:
- Best-in-class properties (Top 10%) achieve 39%+ occupancy, indicating high desirability and potentially optimized availability.
- Strong performing properties (Top 25%) maintain 27% or higher occupancy, suggesting good market fit and guest satisfaction.
- Typical properties (Median) have an occupancy rate around 14%.
- Entry-level properties (Bottom 25%) average 7% occupancy, potentially facing higher vacancy.
Average Monthly Occupancy Rate Trend in Hengchun
Average Daily Rate (ADR) Airbnb Trends in Hengchun (2026)
Effective short term rental pricing strategy in Hengchun involves understanding monthly ADR fluctuations. The Average Daily Rate (ADR) for Airbnb in Hengchun typically peaks in August and dips lowest during November. Leveraging Airbnb dynamic pricing tools or strategies based on this seasonality can significantly boost revenue. Here's a look at the typical nightly rates achieved:
- Best-in-class properties (Top 10%) command rates of $355+ per night, often due to premium features or locations.
- Strong performing properties (Top 25%) achieve nightly rates of $176 or more.
- Typical properties (Median) charge around $88 per night.
- Entry-level properties (Bottom 25%) earn around $53 per night.
Average Daily Rate (ADR) Trend by Month in Hengchun
Get Live Hengchun Market Intelligence 👇

Explore Real-time Analytics
Airbnb Seasonality Analysis & Trends in Hengchun (2026)
Peak Season (August, July, October)
- Revenue averages $1,283 per month
- Occupancy rates average 22.1%
- Daily rates average $161
Shoulder Season
- Revenue averages $936 per month
- Occupancy maintains around 18.5%
- Daily rates hold near $155
Low Season (January, February, November)
- Revenue drops to average $732 per month
- Occupancy decreases to average 16.7%
- Daily rates adjust to average $152
Seasonality Insights for Hengchun
- The Airbnb seasonality in Hengchun shows highly seasonal trends requiring careful strategy. While the sections above show seasonal averages, it's also insightful to look at the extremes:
- During the high season, the absolute peak month showcases Hengchun's highest earning potential, with monthly revenues capable of climbing to $1,479, occupancy reaching a high of 23.3%, and ADRs peaking at $165.
- Conversely, the slowest single month of the year, typically falling within the low season, marks the market's lowest point. In this month, revenue might dip to $711, occupancy could drop to 15.9%, and ADRs may adjust down to $150.
- Understanding both the seasonal averages and these monthly peaks and troughs in revenue, occupancy, and ADR is crucial for maximizing your Airbnb profit potential in Hengchun.
Seasonal Strategies for Maximizing Profit
- Peak Season: Maximize revenue through premium pricing and potentially longer minimum stays. Ensure high availability.
- Low Season: Offer competitive pricing, special promotions (e.g., extended stay discounts), and flexible cancellation policies. Target off-season travelers like remote workers or budget-conscious guests.
- Shoulder Seasons: Implement dynamic pricing that balances peak and low rates. Target weekend travelers or specific events. Offer slightly more flexible terms than peak season.
- Regularly analyze your own performance against these Hengchun seasonality benchmarks and adjust your pricing and availability strategy accordingly.
Best Areas for Airbnb Investment in Hengchun (2026)
Exploring the top neighborhoods for short-term rentals in Hengchun? This section highlights key areas, outlining why they are attractive for hosts and guests, along with notable local attractions. Consider these locations based on your target guest profile and investment strategy.
| Neighborhood / Area | Why Host Here? (Target Guests & Appeal) | Key Attractions & Landmarks |
|---|---|---|
| Kenting National Park | Renowned for its stunning natural beauty, Kenting National Park is a hotspot for tourists seeking outdoor adventure and relaxation. Its beaches, tropical climate and variety of activities make it a prime location for Airbnb hosting. | Kenting Beach, Eluanbi Lighthouse, Maobitou Park, Sichongxi Hot Springs, Kenting Night Market |
| Hengchun Old Town | Culturally rich and historic, Hengchun Old Town offers a glimpse into Taiwan's past with its ancient city walls and temples. It's a favored spot for travelers looking for quaint charm and local experiences. | Hengchun Ancient City, Kenting Street Night Market, Chuhuo Scenic Area, Hengchun Presbyterian Church, South Bay |
| White Sand Beach | Known for its soft, white sand and crystal clear waters, this area is a favorite among beachgoers and water sports enthusiasts. It offers a laid-back atmosphere for visitors. | White Sand Beach, Water sports activities, Camping sites, Scuba diving spots, Sunset viewing points |
| Nanwan (South Bay) | This area features a beautiful beach that is popular for swimming, sunbathing, and water sports. It attracts both families and young travelers looking for beach activities. | Nanwan Beach, Water sports rental shops, Local eateries, Sunset viewing spots, Scenic viewpoints |
| Sichongxi Hot Springs | Famous for its natural hot springs and therapeutic waters, this locale provides a unique relaxation experience for tourists, ideal for wellness-focused Airbnb listings. | Sichongxi Hot Springs, Hot Spring Resort, Nature hiking trails, Local food vendors, Wellness retreats |
| Cape Eluanbi | This scenic cape is home to the Eluanbi Lighthouse and offers breathtaking views of the coastline. Perfect for tourists who enjoy hiking and photography. | Eluanbi Lighthouse, Tropical hiking trails, Breathtaking viewpoints, Coastal walking paths, Natural scenery |
| Xiaowan Beach | A quiet beach that is less crowded, making it ideal for families and couples seeking a peaceful getaway. It's great for relaxing and enjoying nature. | Xiaowan Beach, Picnic areas, Snorkeling spots, Calm waters, Scenic views |
| Kenting Night Market | A vibrant and bustling night market that showcases local food, handicrafts, and culture. A must-visit for those wanting to experience local Taiwanese nightlife. | Kenting Night Market, Street food stalls, Local crafts, Entertainment options, Shopping for souvenirs |
Understanding Airbnb License Requirements & STR Laws in Hengchun (2026)
While Hengchun, Pingtung County, Taiwan currently shows low STR regulations, specific Airbnb license requirements might still exist or change. Always verify the latest short term rental regulations and Airbnb license requirements directly with local government authorities for Hengchun to ensure full compliance before hosting.
(Source: AirROI data, 2026, finding no licensed listings among those analyzed)
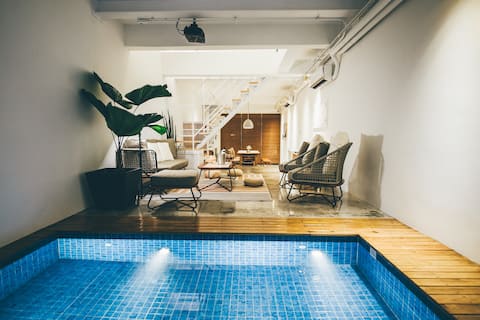
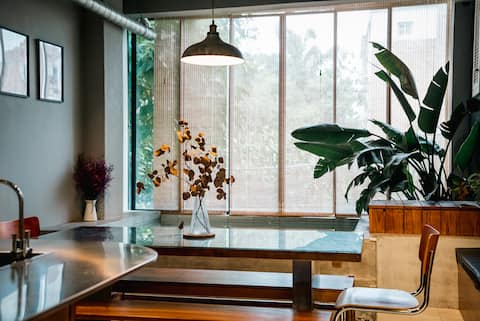
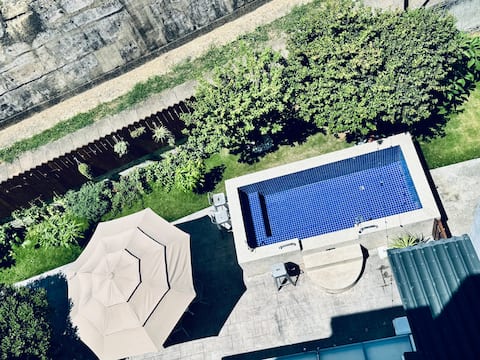
Top Performing Airbnb Properties in Hengchun (2026)
Benchmark your potential! Explore examples of top-performing Airbnb properties in Hengchunbased on Trailing Twelve Month (TTM) revenue. Analyze their characteristics, revenue, occupancy rate, and ADR to understand what drives success in this market.

Hibiscus | Hengchun Kenting 8 - 13 people three rooms | Warm water pool | Open kitchen | Bathtub |
Entire Place • 3 bedrooms
Daymaker | Hengchun Kenting 8 - 18 people | Warm water pool | Kitchen projection area | BBQ area | K
Entire Place • 5 bedrooms
Begonia | Hengchun Kenting | 6-13 people three-bedroom private house | Starry terrace | Play pool |
Entire Place • 3 bedrooms

Early Summer Days | Hengchun Kenting 6 - 14 people two-room private house | Warm water pool | BBQ ar
Entire Place • 2 bedrooms

Kenting/Hengchun/Manzhou/KTV/barbecue/mahjong/pool/breakfast KT.S Villa full sea view 16 people priv
Entire Place • 6 bedrooms
Kenting | Sun Island 10-12 people new private building homestay
Entire Place • 4 bedrooms
Note: Performance varies based on location, size, amenities, seasonality, and management quality. Data reflects the past 12 months.
Top Performing Airbnb Hosts in Hengchun (2026)
Learn from the best! This table showcases top-performing Airbnb hosts in Hengchun based on the number of properties managed and estimated total revenue over the past year. Analyze their scale and performance metrics.
| Host Name | Properties | Grossing Revenue | Stay Reviews | Avg Rating |
|---|---|---|---|---|
| 阿建 | 4 | $314,716 | 179 | 4.95/5.0 |
| 小華 | 13 | $251,376 | 112 | 4.89/5.0 |
| 敬泓 | 3 | $101,242 | 3 | Not Rated |
| 老余 | 3 | $100,656 | 6 | 5.00/5.0 |
| Ms.N | 6 | $99,322 | 13 | 5.00/5.0 |
| 艾蜜堡 | 8 | $95,260 | 384 | 4.98/5.0 |
| 岳倫 | 11 | $89,511 | 119 | 4.66/5.0 |
| Hsin Han | 3 | $85,826 | 34 | 5.00/5.0 |
| 莎莉 | 7 | $81,474 | 174 | 4.93/5.0 |
| 旻鴻 | 8 | $80,623 | 61 | 4.96/5.0 |
Analyzing the strategies of top hosts, such as their property selection, pricing, and guest communication, can offer valuable lessons for optimizing your own Airbnb operations in Hengchun.
Dive Deeper: Advanced Hengchun STR Market Data (2026)
Ready to unlock more insights? AirROI provides access to advanced metrics and comprehensive Airbnb data for Hengchun. Explore detailed analytics beyond this report to refine your investment strategy, optimize pricing, and maximize your vacation rental profits.
Explore Advanced MetricsHengchun Short-Term Rental Market Composition (2026): Property & Room Types
Room Type Distribution
Property Type Distribution
Market Composition Insights for Hengchun
- The Hengchun Airbnb market composition is heavily skewed towards Private Room listings, which make up 66.4% of the 535 active rentals. This indicates strong guest preference for privacy and space.
- Looking at the property type distribution in Hengchun, House properties are the most common (44.1%), reflecting the local real estate landscape.
- Houses represent a significant 44.1% portion, catering likely to families or larger groups.
- The presence of 34.4% Hotel/Boutique listings indicates integration with traditional hospitality.
- Smaller segments like others, outdoor/unique, unique stays (combined 9.6%) offer potential for unique stay experiences.
Hengchun Airbnb Room Capacity Analysis (2026): Bedroom Distribution
Distribution of Listings by Number of Bedrooms
Room Capacity Insights for Hengchun
- The dominant room capacity in Hengchun is 1 bedroom listings, making up 44.1% of the market. This suggests a strong demand for properties suitable for couples or solo travelers.
- Together, 1 bedroom and 2 bedrooms properties represent 51.8% of the active Airbnb listings in Hengchun, indicating a high concentration in these sizes.
Hengchun Vacation Rental Guest Capacity Trends (2026)
Distribution of Listings by Guest Capacity
Guest Capacity Insights for Hengchun
- The most common guest capacity trend in Hengchun vacation rentals is listings accommodating 2 guests (22.8%). This suggests the primary traveler segment is likely couples or solo travelers.
- Properties designed for 2 guests and 8+ guests dominate the Hengchun STR market, accounting for 41.5% of listings.
- 23.8% of properties accommodate 6+ guests, serving the market segment for larger families or group travel in Hengchun.
- On average, properties in Hengchun are equipped to host 3.0 guests.
Hengchun Airbnb Booking Patterns (2026): Available vs. Booked Days
Available Days Distribution
Booked Days Distribution
Booking Pattern Insights for Hengchun
- The most common availability pattern in Hengchun falls within the 271-366 days range, representing 89.2% of listings. This suggests many properties have significant open periods on their calendars.
- Approximately 99.3% of listings show high availability (181+ days open annually), indicating potential for increased bookings or specific owner usage patterns.
- For booked days, the 1-30 days range is most frequent in Hengchun (50.3%), reflecting common guest stay durations or potential owner blocking patterns.
- A notable 0.7% of properties secure long booking periods (181+ days booked per year), highlighting successful long-term rental strategies or significant owner usage.
Hengchun Airbnb Minimum Stay Requirements Analysis
Distribution of Listings by Minimum Night Requirement
1 Night
493 listings
92.1% of total
2 Nights
8 listings
1.5% of total
3 Nights
1 listings
0.2% of total
4-6 Nights
4 listings
0.7% of total
7-29 Nights
1 listings
0.2% of total
30+ Nights
28 listings
5.2% of total
Key Insights
- The most prevalent minimum stay requirement in Hengchun is 1 Night, adopted by 92.1% of listings. This highlights the market's preference for shorter, flexible bookings.
- A strong majority (93.6%) of the Hengchun Airbnb data shows acceptance of very short stays (1-2 nights), indicating a dynamic, high-turnover market.
Recommendations
- Align with the market by considering a 1 Night minimum stay, as 92.1% of Hengchun hosts use this setting.
- Explore offering discounts for stays of 30+ nights to attract the 5.2% of the market seeking extended stays.
- Adjust minimum nights based on seasonality – potentially shorter during low season and longer during peak demand periods in Hengchun.
Hengchun Airbnb Cancellation Policy Trends Analysis (2026)
Super Strict 30 Days
2 listings
0.4% of total
Limited
16 listings
3% of total
Flexible
60 listings
11.2% of total
Moderate
134 listings
25% of total
Firm
262 listings
49% of total
Strict
61 listings
11.4% of total
Cancellation Policy Insights for Hengchun
- The prevailing Airbnb cancellation policy trend in Hengchun is Firm, used by 49% of listings.
- A majority (60.4%) of hosts in Hengchun utilize Firm or Strict policies, indicating a market where hosts prioritize booking security.
Recommendations for Hosts
- Consider adopting a Firm policy to align with the 49% market standard in Hengchun.
- Using a Strict policy might deter some guests, as only 11.4% of listings use it. Evaluate if potential revenue protection outweighs possible lower booking rates.
- Regularly review your cancellation policy against competitors and market demand shifts in Hengchun.
Hengchun STR Booking Lead Time Analysis (2026)
Average Booking Lead Time by Month
Booking Lead Time Insights for Hengchun
- The overall average booking lead time for vacation rentals in Hengchun is 57 days.
- Guests book furthest in advance for stays during November (average 79 days), likely coinciding with peak travel demand or local events.
- The shortest booking windows occur for stays in June (average 24 days), indicating more last-minute travel plans during this time.
- Seasonally, Fall (67 days avg.) sees the longest lead times, while Summer (34 days avg.) has the shortest, reflecting typical travel planning cycles.
Recommendations for Hosts
- Use the overall average lead time (57 days) as a baseline for your pricing and availability strategy in Hengchun.
- For November stays, consider implementing length-of-stay discounts or slightly higher rates for bookings made less than 79 days out to capitalize on advance planning.
- Target marketing efforts for the Fall season well in advance (at least 67 days) to capture early planners.
- Monitor your own booking lead times against these Hengchun averages to identify opportunities for dynamic pricing adjustments.
Popular & Essential Airbnb Amenities in Hengchun (2026)
Amenity Prevalence
Amenity Insights for Hengchun
- Essential amenities in Hengchun that guests expect include: Air conditioning, Wifi. Lacking these (any) could significantly impact bookings.
- Popular amenities like Hair dryer, TV, Shampoo are common but not universal. Offering these can provide a competitive edge.
Recommendations for Hosts
- Ensure your listing includes all essential amenities for Hengchun: Air conditioning, Wifi.
- Prioritize adding missing essentials: Air conditioning, Wifi.
- Consider adding popular differentiators like Hair dryer or TV to increase appeal.
- Highlight unique or less common amenities you offer (e.g., hot tub, dedicated workspace, EV charger) in your listing description and photos.
- Regularly check competitor amenities in Hengchun to stay competitive.
Hengchun Airbnb Guest Demographics & Profile Analysis (2026)
Guest Profile Summary for Hengchun
- The typical guest profile for Airbnb in Hengchun consists of a mix of domestic (37%) and international guests, with top international origins including United States, typically belonging to the Post-2000s (Gen Z/Alpha) group (50%), primarily speaking English or Chinese.
- Domestic travelers account for 37.2% of guests.
- Key international markets include Taiwan (37.2%) and United States (11.7%).
- Top languages spoken are English (38.8%) followed by Chinese (29.2%).
- A significant demographic segment is the Post-2000s (Gen Z/Alpha) group, representing 50% of guests.
Recommendations for Hosts
- Focus marketing internationally, particularly towards travelers from United States.
- Tailor amenities and listing descriptions to appeal to the dominant Post-2000s (Gen Z/Alpha) demographic (e.g., highlight fast WiFi, smart home features, local guides).
- Highlight unique local experiences or amenities relevant to the primary guest profile.
- Consider seasonal promotions aligned with peak travel times for key origin markets.
Nearby Short-Term Rental Market Comparison
How does the Hengchun Airbnb market stack up against its neighbors? Compare key performance metrics like average monthly revenue, ADR, and occupancy rates in surrounding areas to understand the broader regional STR landscape.
| Market | Active Properties | Monthly Revenue | Daily Rate | Avg. Occupancy |
|---|---|---|---|---|
| Manzhou | 10 | $901 | $183.36 | 28% |
| Kaohsiung | 739 | $612 | $81.01 | 33% |
| Donghe | 60 | $495 | $106.02 | 20% |
| Xiaoliuqiu | 76 | $472 | $107.69 | 20% |
| Taitung City | 300 | $350 | $91.36 | 20% |
| Pingtung City | 25 | $292 | $53.43 | 30% |
| Orchid Island | 31 | $286 | $71.48 | 22% |
| Dongang | 25 | $268 | $77.22 | 20% |
| Beinan | 22 | $267 | $69.60 | 18% |
| Green Island | 41 | $243 | $79.97 | 18% |