Saas-Grund Airbnb Market Analysis 2026: Short Term Rental Data & Vacation Rental Statistics in Wallis, Switzerland
Is Airbnb profitable in Saas-Grund in 2026? Explore comprehensive Airbnb analytics for Saas-Grund, Wallis, Switzerland to uncover income potential. This 2026 STR market report for Saas-Grund, based on AirROI data from February 2025 to January 2026, reveals key trends in the niche market of 81 active listings.
Whether you're considering an Airbnb investment in Saas-Grund, optimizing your existing vacation rental, or exploring rental arbitrage opportunities, understanding the Saas-Grund Airbnb data is crucial. Leveraging the low regulation environment is key to maximizing your short term rental income potential. Let's dive into the specifics.
Key Saas-Grund Airbnb Performance Metrics Overview
Monthly Airbnb Revenue Variations & Income Potential in Saas-Grund (2026)
Understanding the monthly revenue variations for Airbnb listings in Saas-Grund is key to maximizing your short term rental income potential. Seasonality significantly impacts earnings. Our analysis, based on data from the past 12 months, shows that the peak revenue month for STRs in Saas-Grund is typically February, while November often presents the lowest earnings, highlighting opportunities for strategic pricing adjustments during shoulder and low seasons. Explore the typical Airbnb income in Saas-Grund across different performance tiers:
- Best-in-class properties (Top 10%) achieve $3,591+ monthly, often utilizing dynamic pricing and superior guest experiences.
- Strong performing properties (Top 25%) earn $2,513 or more, indicating effective management and desirable locations/amenities.
- Typical properties (Median) generate around $1,613 per month, representing the average market performance.
- Entry-level properties (Bottom 25%) see earnings around $954, often with potential for optimization.
Average Monthly Airbnb Earnings Trend in Saas-Grund
Saas-Grund Airbnb Occupancy Rate Trends (2026)
Maximize your bookings by understanding the Saas-Grund STR occupancy trends. Seasonal demand shifts significantly influence how often properties are booked. Typically, Februarysees the highest demand (peak season occupancy), while May experiences the lowest (low season). Effective strategies, like adjusting minimum stays or offering promotions, can boost occupancy during slower periods. Here's how different property tiers perform in Saas-Grund:
- Best-in-class properties (Top 10%) achieve 75%+ occupancy, indicating high desirability and potentially optimized availability.
- Strong performing properties (Top 25%) maintain 55% or higher occupancy, suggesting good market fit and guest satisfaction.
- Typical properties (Median) have an occupancy rate around 32%.
- Entry-level properties (Bottom 25%) average 15% occupancy, potentially facing higher vacancy.
Average Monthly Occupancy Rate Trend in Saas-Grund
Average Daily Rate (ADR) Airbnb Trends in Saas-Grund (2026)
Effective short term rental pricing strategy in Saas-Grund involves understanding monthly ADR fluctuations. The Average Daily Rate (ADR) for Airbnb in Saas-Grund typically peaks in December and dips lowest during April. Leveraging Airbnb dynamic pricing tools or strategies based on this seasonality can significantly boost revenue. Here's a look at the typical nightly rates achieved:
- Best-in-class properties (Top 10%) command rates of $378+ per night, often due to premium features or locations.
- Strong performing properties (Top 25%) achieve nightly rates of $235 or more.
- Typical properties (Median) charge around $172 per night.
- Entry-level properties (Bottom 25%) earn around $130 per night.
Average Daily Rate (ADR) Trend by Month in Saas-Grund
Get Live Saas-Grund Market Intelligence 👇

Explore Real-time Analytics
Airbnb Seasonality Analysis & Trends in Saas-Grund (2026)
Peak Season (February, December, August)
- Revenue averages $2,733 per month
- Occupancy rates average 45.3%
- Daily rates average $219
Shoulder Season
- Revenue averages $1,962 per month
- Occupancy maintains around 38.8%
- Daily rates hold near $208
Low Season (May, October, November)
- Revenue drops to average $1,103 per month
- Occupancy decreases to average 25.6%
- Daily rates adjust to average $213
Seasonality Insights for Saas-Grund
- The Airbnb seasonality in Saas-Grund shows highly seasonal trends requiring careful strategy. While the sections above show seasonal averages, it's also insightful to look at the extremes:
- During the high season, the absolute peak month showcases Saas-Grund's highest earning potential, with monthly revenues capable of climbing to $3,029, occupancy reaching a high of 58.5%, and ADRs peaking at $239.
- Conversely, the slowest single month of the year, typically falling within the low season, marks the market's lowest point. In this month, revenue might dip to $862, occupancy could drop to 22.4%, and ADRs may adjust down to $194.
- Understanding both the seasonal averages and these monthly peaks and troughs in revenue, occupancy, and ADR is crucial for maximizing your Airbnb profit potential in Saas-Grund.
Seasonal Strategies for Maximizing Profit
- Peak Season: Maximize revenue through premium pricing and potentially longer minimum stays. Ensure high availability.
- Low Season: Offer competitive pricing, special promotions (e.g., extended stay discounts), and flexible cancellation policies. Target off-season travelers like remote workers or budget-conscious guests.
- Shoulder Seasons: Implement dynamic pricing that balances peak and low rates. Target weekend travelers or specific events. Offer slightly more flexible terms than peak season.
- Regularly analyze your own performance against these Saas-Grund seasonality benchmarks and adjust your pricing and availability strategy accordingly.
Best Areas for Airbnb Investment in Saas-Grund (2026)
Exploring the top neighborhoods for short-term rentals in Saas-Grund? This section highlights key areas, outlining why they are attractive for hosts and guests, along with notable local attractions. Consider these locations based on your target guest profile and investment strategy.
| Neighborhood / Area | Why Host Here? (Target Guests & Appeal) | Key Attractions & Landmarks |
|---|---|---|
| Saas-Fee | A popular destination known as the 'Pearl of the Alps' for its stunning alpine scenery, Saas-Fee offers year-round skiing and hiking opportunities. This charming village attracts both winter sports enthusiasts and summer travelers looking for outdoor adventures. | Skiing in Saas-Fee, Saas-Fee Mountain Railways, Hiking to the Allalin Glacier, Saastal valley, Cheesemaking in Saas-Fee, Mountain biking routes |
| Saas-Grund | Saas-Grund serves as a gateway to the Saas Valley, combining stunning mountain views with access to skiing and hiking trails. It is a more budget-friendly option compared to its neighboring village, making it attractive for families and groups. | Ski areas in Saas-Grund, Alpin Poia Ski Lift, Hiking trails around Saas-Grund, Saaser Museum, Winter and summer sports activities, Local Swiss cuisine |
| Saas Almagell | This picturesque village is known for its tranquil environment and is ideal for families seeking a peaceful getaway. It offers a mix of nature activities and traditional Swiss charm, appealing to both tourists and locals. | Skiing and snowboarding, Hiking to the Mattmark Reservoir, Saas-Almagell village walks, Local culinary festivals, Almageller hut |
| Längflue | A serene neighborhood in the Saas Valley with easy access to winter sports and summer hiking. Längflue is great for those who appreciate nature and want to escape the busier tourist spots. | Panoramic views of the mountain ranges, Hiking paths and trails, Access to ski lifts, Wildlife spotting opportunities, Photography spots |
| Hohsaas | Famous for its breathtaking views, Hohsaas offers access to some of the best cable cars in the region. It is ideal for adventure seekers who love the outdoors. | Hohsaas cable car, Alpine climbing, Views of the Mischabel range, Mountain biking, Family-friendly walks |
| Furggstalden | A quieter alternative with stunning views, Furggstalden provides a perfect location for those wanting to enjoy nature without the crowds, appealing to hikers and skiers alike. | Scenic mountain views, Quiet hiking trails, Local wildlife, Photography opportunities, Access to Valsaun ski area |
| Mattmark | Nestled near the Mattmark Reservoir, this area is popular for its beautiful scenery and outdoor activities. It attracts nature lovers and outdoor enthusiasts throughout the year. | Mattmark Reservoir, Hiking routes, Scenic boat trips, Fishing in the reservoir, Summer and winter sports options |
| Randa | A nearby village that serves as a wonderful retreat, known for its peaceful surroundings and access to the nearby Zermatt area. Popular with hikers and those looking to escape the busyness of larger towns. | Access to Zermatt, Beautiful hiking trails, Trekking routes to the Matterhorn, Local cheese tastings, Historical sites |
Understanding Airbnb License Requirements & STR Laws in Saas-Grund (2026)
While Saas-Grund, Wallis, Switzerland currently shows low STR regulations, specific Airbnb license requirements might still exist or change. Always verify the latest short term rental regulations and Airbnb license requirements directly with local government authorities for Saas-Grund to ensure full compliance before hosting.
(Source: AirROI data, 2026, based on 1% licensed listings)
Top Performing Airbnb Properties in Saas-Grund (2026)
Benchmark your potential! Explore examples of top-performing Airbnb properties in Saas-Grundbased on Trailing Twelve Month (TTM) revenue. Analyze their characteristics, revenue, occupancy rate, and ADR to understand what drives success in this market.
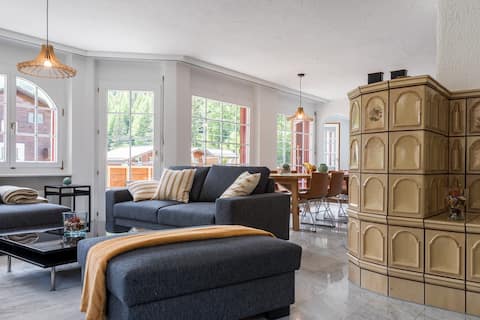
Casa Antares with 5 bedrooms and 3 bathrooms
Entire Place • 5 bedrooms

Pavilion with 3 bedrooms and 2 bathrooms
Entire Place • 3 bedrooms

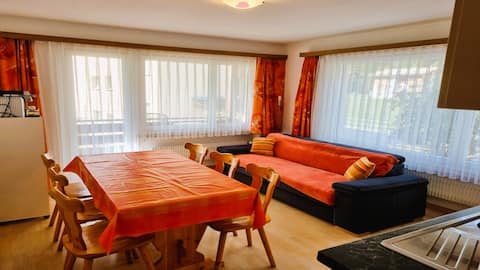
Spacious apartment in the middle of the Saaser mountain world
Entire Place • 3 bedrooms
Apartments Atlas Wohng. 4
Entire Place • 3 bedrooms

E2 cozy apartment on the 2nd floor
Entire Place • 2 bedrooms

Apartment in old house Berghalde in Saas Grund.
Entire Place • 2 bedrooms
Note: Performance varies based on location, size, amenities, seasonality, and management quality. Data reflects the past 12 months.
Top Performing Airbnb Hosts in Saas-Grund (2026)
Learn from the best! This table showcases top-performing Airbnb hosts in Saas-Grund based on the number of properties managed and estimated total revenue over the past year. Analyze their scale and performance metrics.
| Host Name | Properties | Grossing Revenue | Stay Reviews | Avg Rating |
|---|---|---|---|---|
| Christoph - Interhome Group | 14 | $166,752 | 38 | 4.88/5.0 |
| Montela | 5 | $148,934 | 90 | 4.70/5.0 |
| Gilles | 5 | $102,184 | 486 | 4.90/5.0 |
| Edgar | 4 | $71,097 | 578 | 4.90/5.0 |
| Alex | 3 | $65,666 | 30 | 4.42/5.0 |
| Juanita | 5 | $55,686 | 118 | 4.93/5.0 |
| Regula | 2 | $48,684 | 41 | 4.96/5.0 |
| Martina - Interhome | 8 | $48,133 | 22 | 4.58/5.0 |
| Rinaldo | 2 | $43,121 | 32 | 4.96/5.0 |
| Felicitas | 1 | $35,868 | 128 | 4.91/5.0 |
Analyzing the strategies of top hosts, such as their property selection, pricing, and guest communication, can offer valuable lessons for optimizing your own Airbnb operations in Saas-Grund.
Dive Deeper: Advanced Saas-Grund STR Market Data (2026)
Ready to unlock more insights? AirROI provides access to advanced metrics and comprehensive Airbnb data for Saas-Grund. Explore detailed analytics beyond this report to refine your investment strategy, optimize pricing, and maximize your vacation rental profits.
Explore Advanced MetricsSaas-Grund Short-Term Rental Market Composition (2026): Property & Room Types
Room Type Distribution
Property Type Distribution
Market Composition Insights for Saas-Grund
- The Saas-Grund Airbnb market composition is heavily skewed towards Entire Home/Apt listings, which make up 96.3% of the 81 active rentals. This indicates strong guest preference for privacy and space.
- Looking at the property type distribution in Saas-Grund, Apartment/Condo properties are the most common (81.5%), reflecting the local real estate landscape.
- Smaller segments like hotel/boutique (combined 3.7%) offer potential for unique stay experiences.
Saas-Grund Airbnb Room Capacity Analysis (2026): Bedroom Distribution
Distribution of Listings by Number of Bedrooms
Room Capacity Insights for Saas-Grund
- The dominant room capacity in Saas-Grund is 2 bedrooms listings, making up 35.8% of the market. This suggests a strong demand for properties suitable for couples or solo travelers.
- Together, 2 bedrooms and 1 bedroom properties represent 61.7% of the active Airbnb listings in Saas-Grund, indicating a high concentration in these sizes.
Saas-Grund Vacation Rental Guest Capacity Trends (2026)
Distribution of Listings by Guest Capacity
Guest Capacity Insights for Saas-Grund
- The most common guest capacity trend in Saas-Grund vacation rentals is listings accommodating 4 guests (23.5%). This suggests the primary traveler segment is likely small families or groups.
- Properties designed for 4 guests and 6 guests dominate the Saas-Grund STR market, accounting for 47.0% of listings.
- 33.4% of properties accommodate 6+ guests, serving the market segment for larger families or group travel in Saas-Grund.
- On average, properties in Saas-Grund are equipped to host 4.4 guests.
Saas-Grund Airbnb Booking Patterns (2026): Available vs. Booked Days
Available Days Distribution
Booked Days Distribution
Booking Pattern Insights for Saas-Grund
- The most common availability pattern in Saas-Grund falls within the 271-366 days range, representing 66.7% of listings. This suggests many properties have significant open periods on their calendars.
- Approximately 84.0% of listings show high availability (181+ days open annually), indicating potential for increased bookings or specific owner usage patterns.
- For booked days, the 31-90 days range is most frequent in Saas-Grund (33.3%), reflecting common guest stay durations or potential owner blocking patterns.
- A notable 16.1% of properties secure long booking periods (181+ days booked per year), highlighting successful long-term rental strategies or significant owner usage.
Saas-Grund Airbnb Minimum Stay Requirements Analysis
Distribution of Listings by Minimum Night Requirement
1 Night
16 listings
19.8% of total
2 Nights
17 listings
21% of total
3 Nights
4 listings
4.9% of total
4-6 Nights
9 listings
11.1% of total
7-29 Nights
1 listings
1.2% of total
30+ Nights
34 listings
42% of total
Key Insights
- The most prevalent minimum stay requirement in Saas-Grund is 30+ Nights, adopted by 42% of listings. This highlights the market's preference for longer commitments.
- A significant segment (42%) caters to monthly stays (30+ nights) in Saas-Grund, pointing to opportunities in the extended-stay market.
Recommendations
- Align with the market by considering a 30+ Nights minimum stay, as 42% of Saas-Grund hosts use this setting.
- If feasible, allowing 1-night stays, especially midweek or during low season, could capture last-minute bookings, as only 19.8% currently do.
- Explore offering discounts for stays of 30+ nights to attract the 42% of the market seeking extended stays.
- Adjust minimum nights based on seasonality – potentially shorter during low season and longer during peak demand periods in Saas-Grund.
Saas-Grund Airbnb Cancellation Policy Trends Analysis (2026)
Super Strict 60 Days
2 listings
2.5% of total
Limited
5 listings
6.2% of total
Flexible
6 listings
7.4% of total
Moderate
17 listings
21% of total
Firm
40 listings
49.4% of total
Strict
11 listings
13.6% of total
Cancellation Policy Insights for Saas-Grund
- The prevailing Airbnb cancellation policy trend in Saas-Grund is Firm, used by 49.4% of listings.
- A majority (63.0%) of hosts in Saas-Grund utilize Firm or Strict policies, indicating a market where hosts prioritize booking security.
Recommendations for Hosts
- Consider adopting a Firm policy to align with the 49.4% market standard in Saas-Grund.
- Using a Strict policy might deter some guests, as only 13.6% of listings use it. Evaluate if potential revenue protection outweighs possible lower booking rates.
- Regularly review your cancellation policy against competitors and market demand shifts in Saas-Grund.
Saas-Grund STR Booking Lead Time Analysis (2026)
Average Booking Lead Time by Month
Booking Lead Time Insights for Saas-Grund
- The overall average booking lead time for vacation rentals in Saas-Grund is 94 days.
- Guests book furthest in advance for stays during February (average 136 days), likely coinciding with peak travel demand or local events.
- The shortest booking windows occur for stays in June (average 44 days), indicating more last-minute travel plans during this time.
- Seasonally, Winter (113 days avg.) sees the longest lead times, while Spring (85 days avg.) has the shortest, reflecting typical travel planning cycles.
Recommendations for Hosts
- Use the overall average lead time (94 days) as a baseline for your pricing and availability strategy in Saas-Grund.
- For February stays, consider implementing length-of-stay discounts or slightly higher rates for bookings made less than 136 days out to capitalize on advance planning.
- Target marketing efforts for the Winter season well in advance (at least 113 days) to capture early planners.
- Monitor your own booking lead times against these Saas-Grund averages to identify opportunities for dynamic pricing adjustments.
Popular & Essential Airbnb Amenities in Saas-Grund (2026)
Amenity Prevalence
Amenity Insights for Saas-Grund
- Essential amenities in Saas-Grund that guests expect include: Wifi, TV. Lacking these (any) could significantly impact bookings.
- Popular amenities like Hot water, Refrigerator, Hangers are common but not universal. Offering these can provide a competitive edge.
Recommendations for Hosts
- Ensure your listing includes all essential amenities for Saas-Grund: Wifi, TV.
- Prioritize adding missing essentials: Wifi, TV.
- Consider adding popular differentiators like Hot water or Refrigerator to increase appeal.
- Highlight unique or less common amenities you offer (e.g., hot tub, dedicated workspace, EV charger) in your listing description and photos.
- Regularly check competitor amenities in Saas-Grund to stay competitive.
Saas-Grund Airbnb Guest Demographics & Profile Analysis (2026)
Guest Profile Summary for Saas-Grund
- The typical guest profile for Airbnb in Saas-Grund consists of a mix of domestic (47%) and international guests, with top international origins including Germany, typically belonging to the Post-2000s (Gen Z/Alpha) group (50%), primarily speaking English or German.
- Domestic travelers account for 47.3% of guests.
- Key international markets include Switzerland (47.3%) and Germany (13.3%).
- Top languages spoken are English (35.6%) followed by German (23.4%).
- A significant demographic segment is the Post-2000s (Gen Z/Alpha) group, representing 50% of guests.
Recommendations for Hosts
- Balance marketing efforts between domestic and international channels based on the guest mix.
- Tailor amenities and listing descriptions to appeal to the dominant Post-2000s (Gen Z/Alpha) demographic (e.g., highlight fast WiFi, smart home features, local guides).
- Highlight unique local experiences or amenities relevant to the primary guest profile.
- Consider seasonal promotions aligned with peak travel times for key origin markets.
Nearby Short-Term Rental Market Comparison
How does the Saas-Grund Airbnb market stack up against its neighbors? Compare key performance metrics like average monthly revenue, ADR, and occupancy rates in surrounding areas to understand the broader regional STR landscape.
| Market | Active Properties | Monthly Revenue | Daily Rate | Avg. Occupancy |
|---|---|---|---|---|
| Brienzwiler | 11 | $7,335 | $514.27 | 60% |
| Niederried bei Interlaken | 19 | $6,267 | $552.03 | 44% |
| Lauterbrunnen | 552 | $6,108 | $487.83 | 51% |
| Ranco | 12 | $5,691 | $536.46 | 42% |
| Matten bei Interlaken | 64 | $5,607 | $336.51 | 59% |
| Grindelwald | 513 | $5,587 | $396.62 | 56% |
| Les Clefs | 34 | $5,585 | $314.08 | 47% |
| Bassersdorf | 16 | $5,337 | $431.59 | 46% |
| Wengen | 12 | $5,115 | $595.38 | 46% |
| Oberhofen am Thunersee | 25 | $5,051 | $329.28 | 51% |