Lens Airbnb Market Analysis 2026: Short Term Rental Data & Vacation Rental Statistics in Wallis, Switzerland
Is Airbnb profitable in Lens in 2026? Explore comprehensive Airbnb analytics for Lens, Wallis, Switzerland to uncover income potential. This 2026 STR market report for Lens, based on AirROI data from February 2025 to January 2026, reveals key trends in the market of 216 active listings.
Whether you're considering an Airbnb investment in Lens, optimizing your existing vacation rental, or exploring rental arbitrage opportunities, understanding the Lens Airbnb data is crucial. Leveraging the low regulation environment is key to maximizing your short term rental income potential. Let's dive into the specifics.
Key Lens Airbnb Performance Metrics Overview
Monthly Airbnb Revenue Variations & Income Potential in Lens (2026)
Understanding the monthly revenue variations for Airbnb listings in Lens is key to maximizing your short term rental income potential. Seasonality significantly impacts earnings. Our analysis, based on data from the past 12 months, shows that the peak revenue month for STRs in Lens is typically February, while May often presents the lowest earnings, highlighting opportunities for strategic pricing adjustments during shoulder and low seasons. Explore the typical Airbnb income in Lens across different performance tiers:
- Best-in-class properties (Top 10%) achieve $6,100+ monthly, often utilizing dynamic pricing and superior guest experiences.
- Strong performing properties (Top 25%) earn $3,617 or more, indicating effective management and desirable locations/amenities.
- Typical properties (Median) generate around $2,055 per month, representing the average market performance.
- Entry-level properties (Bottom 25%) see earnings around $1,042, often with potential for optimization.
Average Monthly Airbnb Earnings Trend in Lens
Lens Airbnb Occupancy Rate Trends (2026)
Maximize your bookings by understanding the Lens STR occupancy trends. Seasonal demand shifts significantly influence how often properties are booked. Typically, Februarysees the highest demand (peak season occupancy), while June experiences the lowest (low season). Effective strategies, like adjusting minimum stays or offering promotions, can boost occupancy during slower periods. Here's how different property tiers perform in Lens:
- Best-in-class properties (Top 10%) achieve 72%+ occupancy, indicating high desirability and potentially optimized availability.
- Strong performing properties (Top 25%) maintain 48% or higher occupancy, suggesting good market fit and guest satisfaction.
- Typical properties (Median) have an occupancy rate around 30%.
- Entry-level properties (Bottom 25%) average 14% occupancy, potentially facing higher vacancy.
Average Monthly Occupancy Rate Trend in Lens
Average Daily Rate (ADR) Airbnb Trends in Lens (2026)
Effective short term rental pricing strategy in Lens involves understanding monthly ADR fluctuations. The Average Daily Rate (ADR) for Airbnb in Lens typically peaks in January and dips lowest during May. Leveraging Airbnb dynamic pricing tools or strategies based on this seasonality can significantly boost revenue. Here's a look at the typical nightly rates achieved:
- Best-in-class properties (Top 10%) command rates of $561+ per night, often due to premium features or locations.
- Strong performing properties (Top 25%) achieve nightly rates of $373 or more.
- Typical properties (Median) charge around $249 per night.
- Entry-level properties (Bottom 25%) earn around $164 per night.
Average Daily Rate (ADR) Trend by Month in Lens
Get Live Lens Market Intelligence 👇

Explore Real-time Analytics
Airbnb Seasonality Analysis & Trends in Lens (2026)
Peak Season (February, August, March)
- Revenue averages $4,447 per month
- Occupancy rates average 47.7%
- Daily rates average $316
Shoulder Season
- Revenue averages $2,616 per month
- Occupancy maintains around 31.7%
- Daily rates hold near $321
Low Season (May, June, November)
- Revenue drops to average $1,614 per month
- Occupancy decreases to average 24.9%
- Daily rates adjust to average $295
Seasonality Insights for Lens
- The Airbnb seasonality in Lens shows highly seasonal trends requiring careful strategy. While the sections above show seasonal averages, it's also insightful to look at the extremes:
- During the high season, the absolute peak month showcases Lens's highest earning potential, with monthly revenues capable of climbing to $5,525, occupancy reaching a high of 55.8%, and ADRs peaking at $354.
- Conversely, the slowest single month of the year, typically falling within the low season, marks the market's lowest point. In this month, revenue might dip to $1,504, occupancy could drop to 22.7%, and ADRs may adjust down to $276.
- Understanding both the seasonal averages and these monthly peaks and troughs in revenue, occupancy, and ADR is crucial for maximizing your Airbnb profit potential in Lens.
Seasonal Strategies for Maximizing Profit
- Peak Season: Maximize revenue through premium pricing and potentially longer minimum stays. Ensure high availability.
- Low Season: Offer competitive pricing, special promotions (e.g., extended stay discounts), and flexible cancellation policies. Target off-season travelers like remote workers or budget-conscious guests.
- Shoulder Seasons: Implement dynamic pricing that balances peak and low rates. Target weekend travelers or specific events. Offer slightly more flexible terms than peak season.
- Regularly analyze your own performance against these Lens seasonality benchmarks and adjust your pricing and availability strategy accordingly.
Best Areas for Airbnb Investment in Lens (2026)
Exploring the top neighborhoods for short-term rentals in Lens? This section highlights key areas, outlining why they are attractive for hosts and guests, along with notable local attractions. Consider these locations based on your target guest profile and investment strategy.
| Neighborhood / Area | Why Host Here? (Target Guests & Appeal) | Key Attractions & Landmarks |
|---|---|---|
| Leukerbad | Known for its thermal baths and spa resorts, Leukerbad attracts wellness tourists and skiing enthusiasts alike. It offers a serene environment with stunning mountain views. | Leukerbad Thermal Baths, Tschajetuhorn Mountain, Gemmi Pass, Sportarena Leukerbad, Alpentherme, Hiking Trails |
| Zermatt | A traditional mountain village famous for the Matterhorn, Zermatt is a year-round tourist destination for skiing in winter and hiking in summer with a strong appeal to outdoor enthusiasts. | Matterhorn Glacier Paradise, Gornergrat Railway, Hiking Trails, Zermatt Museum, Glacier Paradise, Lakes of Zermatt |
| Grindelwald | Nestled in the Bernese Alps, Grindelwald is a picturesque village offering breathtaking scenery and outdoor activities, making it a favorite for nature lovers and adventure seekers. | Eiger Mountain, First Cliff Walk, Grindelwald First, Glacier Canyon, Hiking Trails, Skiing and Snowboarding |
| Interlaken | Known as the adventure capital of Switzerland, Interlaken captivates guests with its stunning landscapes and numerous adventure sports, appealing to thrill-seekers. | Jungfraujoch, Adventure Sports, Lake Thun, Lake Brienz, Outdoor Activities, Paragliding |
| Lucerne | A charming city with a stunning lake and mountain backdrop, Lucerne offers cultural attractions and easy access to nearby tourist highlights, ideal for both leisure and business travelers. | Chapel Bridge, Lion Monument, Lake Lucerne, Richard Wagner Museum, Swiss National Museum, Nearby Mount Pilatus |
| Geneva | A global city partially located along Lake Geneva, it is highly attractive to business travelers and tourists seeking culture, cuisine, and historical sights. | Jet d'Eau, L'Horloge Fleurie, United Nations Office, Lake Geneva, Old Town, Museum of Natural History |
| Lausanne | Situated on Lake Geneva, Lausanne is known for its vibrant cultural scene, museums, and as a hub for the International Olympic Committee, attracting varied travelers. | Olympic Museum, Lausanne Cathedral, Château d'Ouchy, Collection de l'Art Brut, Esplanade de Montbenon, Lake Shore Promenade |
| Bern | Switzerland's capital features a well-preserved medieval old town, rich history, and a vibrant cultural scene, suitable for both leisure and business tourism. | Zytglogge Clock Tower, Bear Park, Federal Palace of Switzerland, Bern Historical Museum, Rose Garden, Aare River |
Understanding Airbnb License Requirements & STR Laws in Lens (2026)
While Lens, Wallis, Switzerland currently shows low STR regulations, specific Airbnb license requirements might still exist or change. Always verify the latest short term rental regulations and Airbnb license requirements directly with local government authorities for Lens to ensure full compliance before hosting.
(Source: AirROI data, 2026, based on 0% licensed listings)
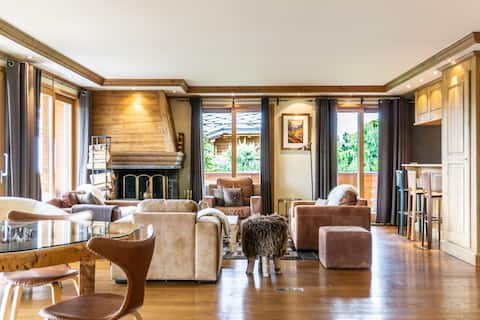
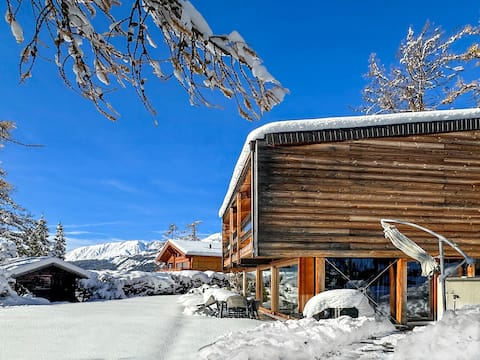
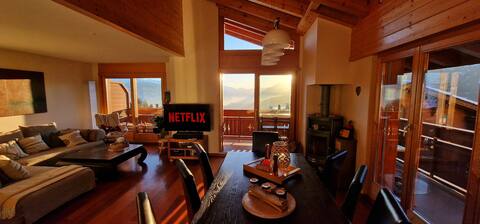
Top Performing Airbnb Properties in Lens (2026)
Benchmark your potential! Explore examples of top-performing Airbnb properties in Lensbased on Trailing Twelve Month (TTM) revenue. Analyze their characteristics, revenue, occupancy rate, and ADR to understand what drives success in this market.
Alpine Luxury, Spectacular View
Entire Place • 6 bedrooms
Crans Montana under the Stars
Entire Place • 3 bedrooms

Swiss Alps Panorama House & Sauna
Entire Place • 5 bedrooms

Exclusive Comfy Apartment in Central Crans-Montana
Entire Place • 3 bedrooms
Modern & spacious Chalet apt w/ private parking
Entire Place • 3 bedrooms

Instant Ski and Golf Paradise - Crans Montana
Entire Place • 3 bedrooms
Note: Performance varies based on location, size, amenities, seasonality, and management quality. Data reflects the past 12 months.
Top Performing Airbnb Hosts in Lens (2026)
Learn from the best! This table showcases top-performing Airbnb hosts in Lens based on the number of properties managed and estimated total revenue over the past year. Analyze their scale and performance metrics.
| Host Name | Properties | Grossing Revenue | Stay Reviews | Avg Rating |
|---|---|---|---|---|
| Jimmy | 9 | $402,019 | 308 | 4.81/5.0 |
| Simon From Superhosts | 6 | $348,291 | 98 | 4.85/5.0 |
| Cedric | 5 | $331,816 | 141 | 4.89/5.0 |
| Constantin'S Family | 7 | $164,638 | 389 | 4.97/5.0 |
| Thomas | 2 | $112,718 | 36 | 4.88/5.0 |
| Dainis | 1 | $91,122 | 9 | 5.00/5.0 |
| Axelle | CosyHome Conciergerie | 5 | $89,898 | 11 | 5.00/5.0 |
| Tina | 2 | $83,774 | 82 | 4.97/5.0 |
| Eloïse | 1 | $83,615 | 13 | 4.92/5.0 |
| Alex | 2 | $82,658 | 83 | 4.75/5.0 |
Analyzing the strategies of top hosts, such as their property selection, pricing, and guest communication, can offer valuable lessons for optimizing your own Airbnb operations in Lens.
Dive Deeper: Advanced Lens STR Market Data (2026)
Ready to unlock more insights? AirROI provides access to advanced metrics and comprehensive Airbnb data for Lens. Explore detailed analytics beyond this report to refine your investment strategy, optimize pricing, and maximize your vacation rental profits.
Explore Advanced MetricsLens Short-Term Rental Market Composition (2026): Property & Room Types
Room Type Distribution
Property Type Distribution
Market Composition Insights for Lens
- The Lens Airbnb market composition is heavily skewed towards Entire Home/Apt listings, which make up 97.7% of the 216 active rentals. This indicates strong guest preference for privacy and space.
- Looking at the property type distribution in Lens, Apartment/Condo properties are the most common (87.5%), reflecting the local real estate landscape.
- Smaller segments like outdoor/unique, hotel/boutique (combined 2.8%) offer potential for unique stay experiences.
Lens Airbnb Room Capacity Analysis (2026): Bedroom Distribution
Distribution of Listings by Number of Bedrooms
Room Capacity Insights for Lens
- The dominant room capacity in Lens is 1 bedroom listings, making up 36.1% of the market. This suggests a strong demand for properties suitable for couples or solo travelers.
- Together, 1 bedroom and 2 bedrooms properties represent 63.9% of the active Airbnb listings in Lens, indicating a high concentration in these sizes.
- A significant 26.9% of listings offer 3+ bedrooms, catering to larger groups and families seeking more space in Lens.
Lens Vacation Rental Guest Capacity Trends (2026)
Distribution of Listings by Guest Capacity
Guest Capacity Insights for Lens
- The most common guest capacity trend in Lens vacation rentals is listings accommodating 4 guests (36.1%). This suggests the primary traveler segment is likely small families or groups.
- Properties designed for 4 guests and 2 guests dominate the Lens STR market, accounting for 55.1% of listings.
- 32.0% of properties accommodate 6+ guests, serving the market segment for larger families or group travel in Lens.
- On average, properties in Lens are equipped to host 4.5 guests.
Lens Airbnb Booking Patterns (2026): Available vs. Booked Days
Available Days Distribution
Booked Days Distribution
Booking Pattern Insights for Lens
- The most common availability pattern in Lens falls within the 271-366 days range, representing 63.4% of listings. This suggests many properties have significant open periods on their calendars.
- Approximately 91.6% of listings show high availability (181+ days open annually), indicating potential for increased bookings or specific owner usage patterns.
- For booked days, the 31-90 days range is most frequent in Lens (38.9%), reflecting common guest stay durations or potential owner blocking patterns.
- A notable 10.7% of properties secure long booking periods (181+ days booked per year), highlighting successful long-term rental strategies or significant owner usage.
Lens Airbnb Minimum Stay Requirements Analysis
Distribution of Listings by Minimum Night Requirement
1 Night
14 listings
6.5% of total
2 Nights
37 listings
17.1% of total
3 Nights
18 listings
8.3% of total
4-6 Nights
45 listings
20.8% of total
7-29 Nights
19 listings
8.8% of total
30+ Nights
83 listings
38.4% of total
Key Insights
- The most prevalent minimum stay requirement in Lens is 30+ Nights, adopted by 38.4% of listings. This highlights the market's preference for longer commitments.
- A significant segment (38.4%) caters to monthly stays (30+ nights) in Lens, pointing to opportunities in the extended-stay market.
Recommendations
- Align with the market by considering a 30+ Nights minimum stay, as 38.4% of Lens hosts use this setting.
- If feasible, allowing 1-night stays, especially midweek or during low season, could capture last-minute bookings, as only 6.5% currently do.
- Explore offering discounts for stays of 30+ nights to attract the 38.4% of the market seeking extended stays.
- Adjust minimum nights based on seasonality – potentially shorter during low season and longer during peak demand periods in Lens.
Lens Airbnb Cancellation Policy Trends Analysis (2026)
Super Strict 30 Days
1 listings
0.5% of total
Limited
15 listings
6.9% of total
Non-refundable
2 listings
0.9% of total
Super Strict 60 Days
1 listings
0.5% of total
Flexible
27 listings
12.5% of total
Moderate
50 listings
23.1% of total
Firm
103 listings
47.7% of total
Strict
17 listings
7.9% of total
Cancellation Policy Insights for Lens
- The prevailing Airbnb cancellation policy trend in Lens is Firm, used by 47.7% of listings.
- A majority (55.6%) of hosts in Lens utilize Firm or Strict policies, indicating a market where hosts prioritize booking security.
- Strict cancellation policies are quite rare (7.9%), potentially making listings with this policy less competitive unless justified by high demand or property type.
Recommendations for Hosts
- Consider adopting a Firm policy to align with the 47.7% market standard in Lens.
- Using a Strict policy might deter some guests, as only 7.9% of listings use it. Evaluate if potential revenue protection outweighs possible lower booking rates.
- Regularly review your cancellation policy against competitors and market demand shifts in Lens.
Lens STR Booking Lead Time Analysis (2026)
Average Booking Lead Time by Month
Booking Lead Time Insights for Lens
- The overall average booking lead time for vacation rentals in Lens is 58 days.
- Guests book furthest in advance for stays during August (average 83 days), likely coinciding with peak travel demand or local events.
- The shortest booking windows occur for stays in May (average 19 days), indicating more last-minute travel plans during this time.
- Seasonally, Winter (75 days avg.) sees the longest lead times, while Spring (37 days avg.) has the shortest, reflecting typical travel planning cycles.
Recommendations for Hosts
- Use the overall average lead time (58 days) as a baseline for your pricing and availability strategy in Lens.
- For August stays, consider implementing length-of-stay discounts or slightly higher rates for bookings made less than 83 days out to capitalize on advance planning.
- Target marketing efforts for the Winter season well in advance (at least 75 days) to capture early planners.
- Monitor your own booking lead times against these Lens averages to identify opportunities for dynamic pricing adjustments.
Popular & Essential Airbnb Amenities in Lens (2026)
Amenity Prevalence
Amenity Insights for Lens
- Essential amenities in Lens that guests expect include: Heating. Lacking these (this) could significantly impact bookings.
- Popular amenities like Kitchen, Wifi, Hot water are common but not universal. Offering these can provide a competitive edge.
- Warning: Wifi is not universally provided but is considered essential globally. Ensure reliable Wifi is offered.
Recommendations for Hosts
- Ensure your listing includes all essential amenities for Lens: Heating.
- Prioritize adding missing essentials: Heating.
- Consider adding popular differentiators like Kitchen or Wifi to increase appeal.
- Highlight unique or less common amenities you offer (e.g., hot tub, dedicated workspace, EV charger) in your listing description and photos.
- Regularly check competitor amenities in Lens to stay competitive.
Lens Airbnb Guest Demographics & Profile Analysis (2026)
Guest Profile Summary for Lens
- The typical guest profile for Airbnb in Lens consists of a mix of domestic (41%) and international guests, with top international origins including France, typically belonging to the Post-2000s (Gen Z/Alpha) group (50%), primarily speaking English or French.
- Domestic travelers account for 41.4% of guests.
- Key international markets include Switzerland (41.4%) and France (20.8%).
- Top languages spoken are English (36.2%) followed by French (24.7%).
- A significant demographic segment is the Post-2000s (Gen Z/Alpha) group, representing 50% of guests.
Recommendations for Hosts
- Balance marketing efforts between domestic and international channels based on the guest mix.
- Tailor amenities and listing descriptions to appeal to the dominant Post-2000s (Gen Z/Alpha) demographic (e.g., highlight fast WiFi, smart home features, local guides).
- Highlight unique local experiences or amenities relevant to the primary guest profile.
- Consider seasonal promotions aligned with peak travel times for key origin markets.
Nearby Short-Term Rental Market Comparison
How does the Lens Airbnb market stack up against its neighbors? Compare key performance metrics like average monthly revenue, ADR, and occupancy rates in surrounding areas to understand the broader regional STR landscape.
| Market | Active Properties | Monthly Revenue | Daily Rate | Avg. Occupancy |
|---|---|---|---|---|
| Brienzwiler | 11 | $7,335 | $514.27 | 60% |
| Niederried bei Interlaken | 19 | $6,267 | $552.03 | 44% |
| Lauterbrunnen | 552 | $6,108 | $487.83 | 51% |
| Ranco | 12 | $5,691 | $536.46 | 42% |
| Matten bei Interlaken | 64 | $5,607 | $336.51 | 59% |
| Grindelwald | 513 | $5,587 | $396.62 | 56% |
| Les Clefs | 34 | $5,585 | $314.08 | 47% |
| Bassersdorf | 16 | $5,337 | $431.59 | 46% |
| Wengen | 12 | $5,115 | $595.38 | 46% |
| Oberhofen am Thunersee | 25 | $5,051 | $329.28 | 51% |