Pully Airbnb Market Analysis 2026: Short Term Rental Data & Vacation Rental Statistics in Vaud, Switzerland
Is Airbnb profitable in Pully in 2026? Explore comprehensive Airbnb analytics for Pully, Vaud, Switzerland to uncover income potential. This 2026 STR market report for Pully, based on AirROI data from February 2025 to January 2026, reveals key trends in the niche market of 35 active listings.
Whether you're considering an Airbnb investment in Pully, optimizing your existing vacation rental, or exploring rental arbitrage opportunities, understanding the Pully Airbnb data is crucial. Leveraging the low regulation environment is key to maximizing your short term rental income potential. Let's dive into the specifics.
Key Pully Airbnb Performance Metrics Overview
Monthly Airbnb Revenue Variations & Income Potential in Pully (2026)
Understanding the monthly revenue variations for Airbnb listings in Pully is key to maximizing your short term rental income potential. Seasonality significantly impacts earnings. Our analysis, based on data from the past 12 months, shows that the peak revenue month for STRs in Pully is typically September, while October often presents the lowest earnings, highlighting opportunities for strategic pricing adjustments during shoulder and low seasons. Explore the typical Airbnb income in Pully across different performance tiers:
- Best-in-class properties (Top 10%) achieve $4,207+ monthly, often utilizing dynamic pricing and superior guest experiences.
- Strong performing properties (Top 25%) earn $2,878 or more, indicating effective management and desirable locations/amenities.
- Typical properties (Median) generate around $1,681 per month, representing the average market performance.
- Entry-level properties (Bottom 25%) see earnings around $888, often with potential for optimization.
Average Monthly Airbnb Earnings Trend in Pully
Pully Airbnb Occupancy Rate Trends (2026)
Maximize your bookings by understanding the Pully STR occupancy trends. Seasonal demand shifts significantly influence how often properties are booked. Typically, Septembersees the highest demand (peak season occupancy), while January experiences the lowest (low season). Effective strategies, like adjusting minimum stays or offering promotions, can boost occupancy during slower periods. Here's how different property tiers perform in Pully:
- Best-in-class properties (Top 10%) achieve 86%+ occupancy, indicating high desirability and potentially optimized availability.
- Strong performing properties (Top 25%) maintain 65% or higher occupancy, suggesting good market fit and guest satisfaction.
- Typical properties (Median) have an occupancy rate around 41%.
- Entry-level properties (Bottom 25%) average 19% occupancy, potentially facing higher vacancy.
Average Monthly Occupancy Rate Trend in Pully
Average Daily Rate (ADR) Airbnb Trends in Pully (2026)
Effective short term rental pricing strategy in Pully involves understanding monthly ADR fluctuations. The Average Daily Rate (ADR) for Airbnb in Pully typically peaks in July and dips lowest during October. Leveraging Airbnb dynamic pricing tools or strategies based on this seasonality can significantly boost revenue. Here's a look at the typical nightly rates achieved:
- Best-in-class properties (Top 10%) command rates of $298+ per night, often due to premium features or locations.
- Strong performing properties (Top 25%) achieve nightly rates of $230 or more.
- Typical properties (Median) charge around $130 per night.
- Entry-level properties (Bottom 25%) earn around $96 per night.
Average Daily Rate (ADR) Trend by Month in Pully
Get Live Pully Market Intelligence 👇

Explore Real-time Analytics
Airbnb Seasonality Analysis & Trends in Pully (2026)
Peak Season (September, April, July)
- Revenue averages $3,345 per month
- Occupancy rates average 54.4%
- Daily rates average $230
Shoulder Season
- Revenue averages $2,159 per month
- Occupancy maintains around 43.3%
- Daily rates hold near $230
Low Season (January, October, November)
- Revenue drops to average $1,365 per month
- Occupancy decreases to average 34.8%
- Daily rates adjust to average $208
Seasonality Insights for Pully
- The Airbnb seasonality in Pully shows highly seasonal trends requiring careful strategy. While the sections above show seasonal averages, it's also insightful to look at the extremes:
- During the high season, the absolute peak month showcases Pully's highest earning potential, with monthly revenues capable of climbing to $4,878, occupancy reaching a high of 57.8%, and ADRs peaking at $255.
- Conversely, the slowest single month of the year, typically falling within the low season, marks the market's lowest point. In this month, revenue might dip to $1,151, occupancy could drop to 28.3%, and ADRs may adjust down to $207.
- Understanding both the seasonal averages and these monthly peaks and troughs in revenue, occupancy, and ADR is crucial for maximizing your Airbnb profit potential in Pully.
Seasonal Strategies for Maximizing Profit
- Peak Season: Maximize revenue through premium pricing and potentially longer minimum stays. Ensure high availability.
- Low Season: Offer competitive pricing, special promotions (e.g., extended stay discounts), and flexible cancellation policies. Target off-season travelers like remote workers or budget-conscious guests.
- Shoulder Seasons: Implement dynamic pricing that balances peak and low rates. Target weekend travelers or specific events. Offer slightly more flexible terms than peak season.
- Regularly analyze your own performance against these Pully seasonality benchmarks and adjust your pricing and availability strategy accordingly.
Best Areas for Airbnb Investment in Pully (2026)
Exploring the top neighborhoods for short-term rentals in Pully? This section highlights key areas, outlining why they are attractive for hosts and guests, along with notable local attractions. Consider these locations based on your target guest profile and investment strategy.
| Neighborhood / Area | Why Host Here? (Target Guests & Appeal) | Key Attractions & Landmarks |
|---|---|---|
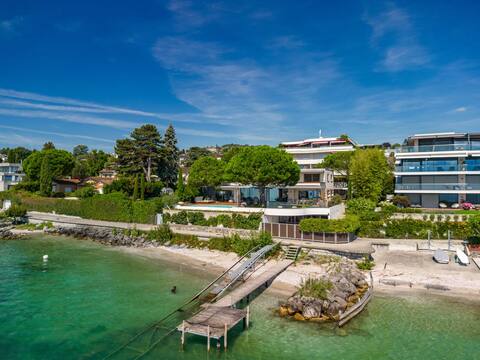
| Lac Léman | Beautiful lakeside area offering stunning views and a tranquil atmosphere. Ideal for tourists looking to relax by the water or engage in outdoor activities. | Lake Geneva, Ouchy Promenade, Montreux, Vevey, Chillon Castle |
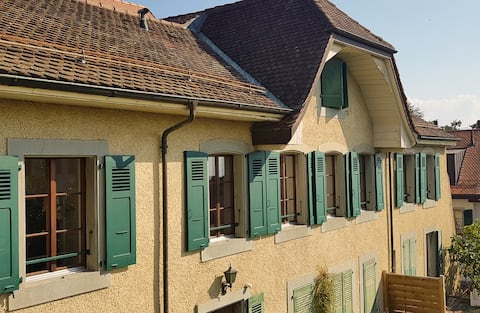
| Pully Town Center | The heart of Pully with charming streets, local shops, and easy access to public transport. Great for visitors who want to experience local life while being close to Lausanne. | Pully Museum, L'Esplanade, local cafes and boutiques |
| Lavaux Vineyard Terraces | A UNESCO World Heritage site renowned for its terraced vineyards and scenic views. Attracts wine lovers and those looking for breathtaking landscapes. | Lavaux Vineyards, Wine tastings, Hiking trails, Scenic viewpoints |
| Cully | A picturesque village along the lake, known for its wine production. Perfect for tourists seeking a quaint, authentic Swiss experience. | Cully Wine Festival, Cully Old Town, Lake Geneva, Hiking trails |
| Lausanne | Just a short distance from Pully, Lausanne has a vibrant cultural scene and is home to the Olympic Museum. A great spot for business travelers and tourists alike. | Olympic Museum, Lausanne Cathedral, Collection de l'Art Brut, Parks and Gardens |
| Montreux | Famous for its annual jazz festival and beautiful lakeside promenade. Attracts music lovers and tourists visiting the stunning Montreux region. | Montreux Jazz Festival, Queen Studio Experience, Lake Geneva, Chillon Castle |
| Vevey | Historic town with a beautiful waterfront, known for its festivals and the Charlie Chaplin Museum. Ideal for families and culture enthusiasts. | Chaplin's World, Vevey Market, Lake Geneva, Museum of Alimentarium |
| Les Pléiades | A scenic mountain area perfect for hiking and skiing, providing a peaceful retreat from city life. Great for nature lovers and outdoor enthusiasts. | Hiking trails, Panoramic views, Skiing in winter, Chalet stays |
Understanding Airbnb License Requirements & STR Laws in Pully (2026)
While Pully, Vaud, Switzerland currently shows low STR regulations, specific Airbnb license requirements might still exist or change. Always verify the latest short term rental regulations and Airbnb license requirements directly with local government authorities for Pully to ensure full compliance before hosting.
(Source: AirROI data, 2026, finding no licensed listings among those analyzed)
Top Performing Airbnb Properties in Pully (2026)
Benchmark your potential! Explore examples of top-performing Airbnb properties in Pullybased on Trailing Twelve Month (TTM) revenue. Analyze their characteristics, revenue, occupancy rate, and ADR to understand what drives success in this market.
Lausanne area Luxurious 4-Bedroom Lakefront Villa
Entire Place • 4 bedrooms
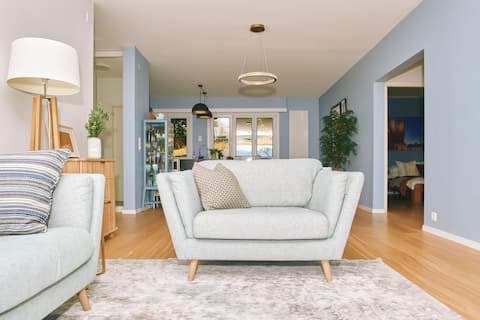
Charming and large apartment in the heart of Pully
Entire Place • 2 bedrooms

Pully entire apartment near transport
Entire Place • 1 bedroom
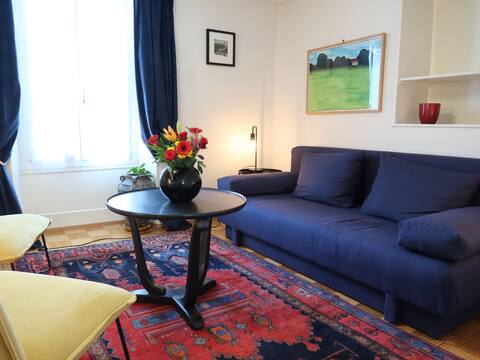
Superb modern apartment overlooking Lake
Entire Place • 2 bedrooms
Petit Nid de Pully by Interhome
Entire Place • 2 bedrooms

Charming room in village house
Private Room • N/A
Note: Performance varies based on location, size, amenities, seasonality, and management quality. Data reflects the past 12 months.
Top Performing Airbnb Hosts in Pully (2026)
Learn from the best! This table showcases top-performing Airbnb hosts in Pully based on the number of properties managed and estimated total revenue over the past year. Analyze their scale and performance metrics.
| Host Name | Properties | Grossing Revenue | Stay Reviews | Avg Rating |
|---|---|---|---|---|
| Julian | 1 | $51,763 | 6 | 5.00/5.0 |
| Anne-Sophie | 1 | $41,450 | 123 | 4.96/5.0 |
| Elisa | 1 | $35,154 | 31 | 4.84/5.0 |
| Coralie | 1 | $35,086 | 7 | 5.00/5.0 |
| Neide | 2 | $27,679 | 32 | 4.88/5.0 |
| Nadia - Interhome | 1 | $27,286 | 13 | 4.00/5.0 |
| Justyna | 2 | $26,322 | 35 | 4.82/5.0 |
| Mazarine | 3 | $25,252 | 145 | 4.81/5.0 |
| Rose Marie | 1 | $25,053 | 126 | 4.99/5.0 |
| Philippe | 1 | $24,067 | 46 | 4.83/5.0 |
Analyzing the strategies of top hosts, such as their property selection, pricing, and guest communication, can offer valuable lessons for optimizing your own Airbnb operations in Pully.
Dive Deeper: Advanced Pully STR Market Data (2026)
Ready to unlock more insights? AirROI provides access to advanced metrics and comprehensive Airbnb data for Pully. Explore detailed analytics beyond this report to refine your investment strategy, optimize pricing, and maximize your vacation rental profits.
Explore Advanced MetricsPully Short-Term Rental Market Composition (2026): Property & Room Types
Room Type Distribution
Property Type Distribution
Market Composition Insights for Pully
- The Pully Airbnb market composition is heavily skewed towards Entire Home/Apt listings, which make up 60% of the 35 active rentals. This indicates strong guest preference for privacy and space.
- However, a notable 40% share for Private Rooms suggests opportunities for budget-conscious travelers or hosts renting out spare rooms.
- Looking at the property type distribution in Pully, Apartment/Condo properties are the most common (82.9%), reflecting the local real estate landscape.
- The presence of 5.7% Hotel/Boutique listings indicates integration with traditional hospitality.
Pully Airbnb Room Capacity Analysis (2026): Bedroom Distribution
Distribution of Listings by Number of Bedrooms
Room Capacity Insights for Pully
- The dominant room capacity in Pully is 1 bedroom listings, making up 31.4% of the market. This suggests a strong demand for properties suitable for couples or solo travelers.
- Together, 1 bedroom and 2 bedrooms properties represent 45.7% of the active Airbnb listings in Pully, indicating a high concentration in these sizes.
Pully Vacation Rental Guest Capacity Trends (2026)
Distribution of Listings by Guest Capacity
Guest Capacity Insights for Pully
- The most common guest capacity trend in Pully vacation rentals is listings accommodating 2 guests (20%). This suggests the primary traveler segment is likely couples or solo travelers.
- Properties designed for 2 guests and 4 guests dominate the Pully STR market, accounting for 34.3% of listings.
- 11.4% of properties accommodate 6+ guests, serving the market segment for larger families or group travel in Pully.
- On average, properties in Pully are equipped to host 2.3 guests.
Pully Airbnb Booking Patterns (2026): Available vs. Booked Days
Available Days Distribution
Booked Days Distribution
Booking Pattern Insights for Pully
- The most common availability pattern in Pully falls within the 271-366 days range, representing 54.3% of listings. This suggests many properties have significant open periods on their calendars.
- Approximately 88.6% of listings show high availability (181+ days open annually), indicating potential for increased bookings or specific owner usage patterns.
- For booked days, the 91-180 days range is most frequent in Pully (34.3%), reflecting common guest stay durations or potential owner blocking patterns.
- A notable 11.4% of properties secure long booking periods (181+ days booked per year), highlighting successful long-term rental strategies or significant owner usage.
Pully Airbnb Minimum Stay Requirements Analysis
Distribution of Listings by Minimum Night Requirement
1 Night
10 listings
28.6% of total
2 Nights
9 listings
25.7% of total
3 Nights
1 listings
2.9% of total
4-6 Nights
3 listings
8.6% of total
7-29 Nights
6 listings
17.1% of total
30+ Nights
6 listings
17.1% of total
Key Insights
- The most prevalent minimum stay requirement in Pully is 1 Night, adopted by 28.6% of listings. This highlights the market's preference for shorter, flexible bookings.
- A significant segment (17.1%) caters to monthly stays (30+ nights) in Pully, pointing to opportunities in the extended-stay market.
Recommendations
- Align with the market by considering a 1 Night minimum stay, as 28.6% of Pully hosts use this setting.
- If feasible, allowing 1-night stays, especially midweek or during low season, could capture last-minute bookings, as only 28.6% currently do.
- Explore offering discounts for stays of 30+ nights to attract the 17.1% of the market seeking extended stays.
- Adjust minimum nights based on seasonality – potentially shorter during low season and longer during peak demand periods in Pully.
Pully Airbnb Cancellation Policy Trends Analysis (2026)
Super Strict 60 Days
1 listings
2.9% of total
Super Strict 30 Days
1 listings
2.9% of total
Flexible
10 listings
28.6% of total
Moderate
15 listings
42.9% of total
Firm
8 listings
22.9% of total
Cancellation Policy Insights for Pully
- The prevailing Airbnb cancellation policy trend in Pully is Moderate, used by 42.9% of listings.
- The market strongly favors guest-friendly terms, with 71.5% of listings offering Flexible or Moderate policies. This suggests guests in Pully may expect booking flexibility.
Recommendations for Hosts
- Consider adopting a Moderate policy to align with the 42.9% market standard in Pully.
- Regularly review your cancellation policy against competitors and market demand shifts in Pully.
Pully STR Booking Lead Time Analysis (2026)
Average Booking Lead Time by Month
Booking Lead Time Insights for Pully
- The overall average booking lead time for vacation rentals in Pully is 43 days.
- Guests book furthest in advance for stays during November (average 81 days), likely coinciding with peak travel demand or local events.
- The shortest booking windows occur for stays in February (average 12 days), indicating more last-minute travel plans during this time.
- Seasonally, Summer (62 days avg.) sees the longest lead times, while Winter (14 days avg.) has the shortest, reflecting typical travel planning cycles.
Recommendations for Hosts
- Use the overall average lead time (43 days) as a baseline for your pricing and availability strategy in Pully.
- For November stays, consider implementing length-of-stay discounts or slightly higher rates for bookings made less than 81 days out to capitalize on advance planning.
- During February, focus on last-minute booking availability and promotions, as guests book with very short notice (12 days avg.).
- Target marketing efforts for the Summer season well in advance (at least 62 days) to capture early planners.
- Monitor your own booking lead times against these Pully averages to identify opportunities for dynamic pricing adjustments.
Popular & Essential Airbnb Amenities in Pully (2026)
Amenity Prevalence
Amenity Insights for Pully
- Essential amenities in Pully that guests expect include: Wifi. Lacking these (this) could significantly impact bookings.
- Popular amenities like Heating, Hot water, Kitchen are common but not universal. Offering these can provide a competitive edge.
Recommendations for Hosts
- Ensure your listing includes all essential amenities for Pully: Wifi.
- Prioritize adding missing essentials: Wifi.
- Consider adding popular differentiators like Heating or Hot water to increase appeal.
- Highlight unique or less common amenities you offer (e.g., hot tub, dedicated workspace, EV charger) in your listing description and photos.
- Regularly check competitor amenities in Pully to stay competitive.
Pully Airbnb Guest Demographics & Profile Analysis (2026)
Guest Profile Summary for Pully
- The typical guest profile for Airbnb in Pully consists of predominantly international visitors (78%), with top international origins including Switzerland, typically belonging to the Post-2000s (Gen Z/Alpha) group (50%), primarily speaking English or French.
- Domestic travelers account for 22.0% of guests.
- Key international markets include France (35%) and Switzerland (22%).
- Top languages spoken are English (35.8%) followed by French (28.5%).
- A significant demographic segment is the Post-2000s (Gen Z/Alpha) group, representing 50% of guests.
Recommendations for Hosts
- Focus marketing internationally, particularly towards travelers from Switzerland.
- Tailor amenities and listing descriptions to appeal to the dominant Post-2000s (Gen Z/Alpha) demographic (e.g., highlight fast WiFi, smart home features, local guides).
- Highlight unique local experiences or amenities relevant to the primary guest profile.
- Consider seasonal promotions aligned with peak travel times for key origin markets.
Nearby Short-Term Rental Market Comparison
How does the Pully Airbnb market stack up against its neighbors? Compare key performance metrics like average monthly revenue, ADR, and occupancy rates in surrounding areas to understand the broader regional STR landscape.
| Market | Active Properties | Monthly Revenue | Daily Rate | Avg. Occupancy |
|---|---|---|---|---|
| Niederried bei Interlaken | 19 | $6,267 | $552.03 | 44% |
| Lauterbrunnen | 552 | $6,108 | $487.83 | 51% |
| Matten bei Interlaken | 64 | $5,607 | $336.51 | 59% |
| Les Clefs | 34 | $5,585 | $314.08 | 47% |
| Wengen | 12 | $5,115 | $595.38 | 46% |
| Oberhofen am Thunersee | 25 | $5,051 | $329.28 | 51% |
| Zermatt | 792 | $5,017 | $504.14 | 46% |
| Interlaken | 346 | $4,947 | $399.71 | 53% |
| Bönigen | 35 | $4,848 | $288.51 | 65% |
| La Rivière-Enverse | 18 | $4,591 | $674.42 | 37% |