Gryon Airbnb Market Analysis 2026: Short Term Rental Data & Vacation Rental Statistics in Vaud, Switzerland
Is Airbnb profitable in Gryon in 2026? Explore comprehensive Airbnb analytics for Gryon, Vaud, Switzerland to uncover income potential. This 2026 STR market report for Gryon, based on AirROI data from February 2025 to January 2026, reveals key trends in the niche market of 141 active listings.
Whether you're considering an Airbnb investment in Gryon, optimizing your existing vacation rental, or exploring rental arbitrage opportunities, understanding the Gryon Airbnb data is crucial. Leveraging the low regulation environment is key to maximizing your short term rental income potential. Let's dive into the specifics.
Key Gryon Airbnb Performance Metrics Overview
Monthly Airbnb Revenue Variations & Income Potential in Gryon (2026)
Understanding the monthly revenue variations for Airbnb listings in Gryon is key to maximizing your short term rental income potential. Seasonality significantly impacts earnings. Our analysis, based on data from the past 12 months, shows that the peak revenue month for STRs in Gryon is typically February, while November often presents the lowest earnings, highlighting opportunities for strategic pricing adjustments during shoulder and low seasons. Explore the typical Airbnb income in Gryon across different performance tiers:
- Best-in-class properties (Top 10%) achieve $5,442+ monthly, often utilizing dynamic pricing and superior guest experiences.
- Strong performing properties (Top 25%) earn $3,197 or more, indicating effective management and desirable locations/amenities.
- Typical properties (Median) generate around $1,685 per month, representing the average market performance.
- Entry-level properties (Bottom 25%) see earnings around $878, often with potential for optimization.
Average Monthly Airbnb Earnings Trend in Gryon
Gryon Airbnb Occupancy Rate Trends (2026)
Maximize your bookings by understanding the Gryon STR occupancy trends. Seasonal demand shifts significantly influence how often properties are booked. Typically, Februarysees the highest demand (peak season occupancy), while November experiences the lowest (low season). Effective strategies, like adjusting minimum stays or offering promotions, can boost occupancy during slower periods. Here's how different property tiers perform in Gryon:
- Best-in-class properties (Top 10%) achieve 56%+ occupancy, indicating high desirability and potentially optimized availability.
- Strong performing properties (Top 25%) maintain 40% or higher occupancy, suggesting good market fit and guest satisfaction.
- Typical properties (Median) have an occupancy rate around 23%.
- Entry-level properties (Bottom 25%) average 12% occupancy, potentially facing higher vacancy.
Average Monthly Occupancy Rate Trend in Gryon
Average Daily Rate (ADR) Airbnb Trends in Gryon (2026)
Effective short term rental pricing strategy in Gryon involves understanding monthly ADR fluctuations. The Average Daily Rate (ADR) for Airbnb in Gryon typically peaks in January and dips lowest during April. Leveraging Airbnb dynamic pricing tools or strategies based on this seasonality can significantly boost revenue. Here's a look at the typical nightly rates achieved:
- Best-in-class properties (Top 10%) command rates of $568+ per night, often due to premium features or locations.
- Strong performing properties (Top 25%) achieve nightly rates of $431 or more.
- Typical properties (Median) charge around $261 per night.
- Entry-level properties (Bottom 25%) earn around $172 per night.
Average Daily Rate (ADR) Trend by Month in Gryon
Get Live Gryon Market Intelligence 👇

Explore Real-time Analytics
Airbnb Seasonality Analysis & Trends in Gryon (2026)
Peak Season (February, August, March)
- Revenue averages $3,539 per month
- Occupancy rates average 41.6%
- Daily rates average $314
Shoulder Season
- Revenue averages $2,441 per month
- Occupancy maintains around 25.3%
- Daily rates hold near $326
Low Season (April, October, November)
- Revenue drops to average $1,576 per month
- Occupancy decreases to average 20.5%
- Daily rates adjust to average $317
Seasonality Insights for Gryon
- The Airbnb seasonality in Gryon shows highly seasonal trends requiring careful strategy. While the sections above show seasonal averages, it's also insightful to look at the extremes:
- During the high season, the absolute peak month showcases Gryon's highest earning potential, with monthly revenues capable of climbing to $3,848, occupancy reaching a high of 48.3%, and ADRs peaking at $348.
- Conversely, the slowest single month of the year, typically falling within the low season, marks the market's lowest point. In this month, revenue might dip to $1,237, occupancy could drop to 16.2%, and ADRs may adjust down to $299.
- Understanding both the seasonal averages and these monthly peaks and troughs in revenue, occupancy, and ADR is crucial for maximizing your Airbnb profit potential in Gryon.
Seasonal Strategies for Maximizing Profit
- Peak Season: Maximize revenue through premium pricing and potentially longer minimum stays. Ensure high availability.
- Low Season: Offer competitive pricing, special promotions (e.g., extended stay discounts), and flexible cancellation policies. Target off-season travelers like remote workers or budget-conscious guests.
- Shoulder Seasons: Implement dynamic pricing that balances peak and low rates. Target weekend travelers or specific events. Offer slightly more flexible terms than peak season.
- Regularly analyze your own performance against these Gryon seasonality benchmarks and adjust your pricing and availability strategy accordingly.
Best Areas for Airbnb Investment in Gryon (2026)
Exploring the top neighborhoods for short-term rentals in Gryon? This section highlights key areas, outlining why they are attractive for hosts and guests, along with notable local attractions. Consider these locations based on your target guest profile and investment strategy.
| Neighborhood / Area | Why Host Here? (Target Guests & Appeal) | Key Attractions & Landmarks |
|---|---|---|
| Gryon Village | Charming alpine village in the heart of the Vaud Alps with stunning views and outdoor activities. Popular for both summer hiking and winter skiing, making it a year-round destination. | Gryon ski area, Col du Pillon, Bex – Gryon – Villars railway, Chillon Castle, Lake Geneva, Hiking trails to Diablerets |
| Villars-sur-Ollon | Nearby resort town known for its family-friendly ski slopes and vibrant village atmosphere. Offers numerous facilities and easy access to outdoor adventures. | Villars ski area, Golf Club Villars, Spa facilities, Children's ski schools, Restaurants and shops, Hiking trails |
| Les Diablerets | Famous for its winter sports and beautiful landscapes. Attracts adventure seekers throughout the year, including skiers and mountain climbers. | Glacier 3000, Diablerets ski area, Hiking routes, Hiking to the Col de Pillon, Gorges de l'Areuse, Summer tobogganing |
| Bex | Located at the heart of the Vaud countryside, Bex offers a charming historical ambiance along with proximity to nature and outdoor activities. | Bex Salt Mines, Historical old town, Bex-Villars railway, Nature walks, Mountain biking trails, Caves of the Devil |
| Château-d'Oex | Known for hot air ballooning and beautiful landscapes, this area attracts visitors looking for a unique experience in nature. | Hot air balloon rides, Skiing and snowboarding, Hiking trails, Château-d'Oex Museum, Cultural events, Lake Rougemont |
| Montreux | Famous for its lakeside setting and music festival. A major tourist destination with a lot of cultural and recreational offerings. | Montreux Jazz Festival, Chillon Castle, Lake Geneva shores, Vineyards of Lavaux, Freddie Mercury statue, Promenade des Planches |
| Vevey | Charming town on Lake Geneva known for its beautiful lakeside promenade and vibrant cultural scene. Offers a blend of relaxation and activities. | Charlie Chaplin Museum, Vevey Market, Lake Geneva promenade, Château de Vevey, Mont Pèlerin, Local vineyards |
| Leysin | Popular ski resort town with a youthful vibe, known for its skiing and hiking trails. Attracts both winter sports enthusiasts and summer hikers. | Leysin ski area, Leysin-Fiesch train, Hiking trails, Torgon ski area, Alpine Coaster, Paragliding |
Understanding Airbnb License Requirements & STR Laws in Gryon (2026)
While Gryon, Vaud, Switzerland currently shows low STR regulations, specific Airbnb license requirements might still exist or change. Always verify the latest short term rental regulations and Airbnb license requirements directly with local government authorities for Gryon to ensure full compliance before hosting.
(Source: AirROI data, 2026, finding no licensed listings among those analyzed)
Top Performing Airbnb Properties in Gryon (2026)
Benchmark your potential! Explore examples of top-performing Airbnb properties in Gryonbased on Trailing Twelve Month (TTM) revenue. Analyze their characteristics, revenue, occupancy rate, and ADR to understand what drives success in this market.
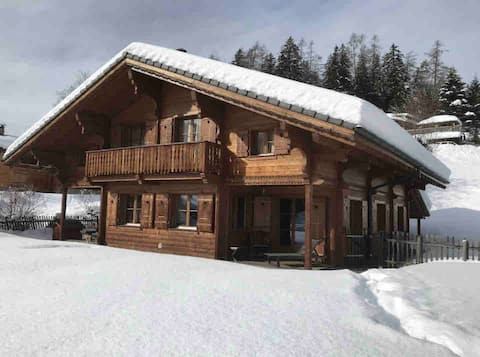
Luxury Swiss Chalet 50m from Piste
Entire Place • 5 bedrooms
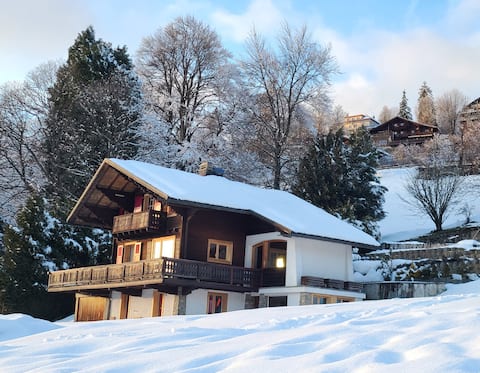
Chalet in Swiss Alps
Entire Place • 6 bedrooms
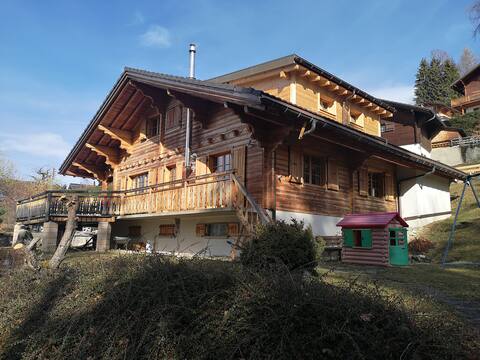
Charming family chalet
Entire Place • 4 bedrooms

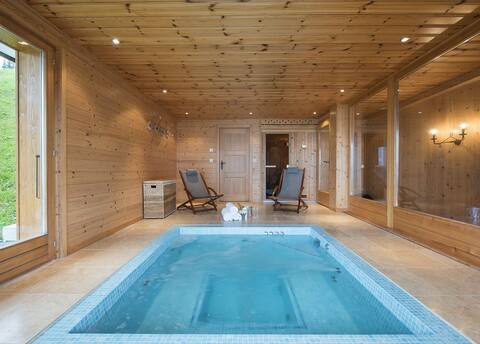
Verseau (with indoor pool)
Entire Place • 5 bedrooms
Large chalet in Villars-Gryon, magnificent views
Entire Place • 4 bedrooms
Chalet with exceptional views!
Entire Place • 4 bedrooms
Note: Performance varies based on location, size, amenities, seasonality, and management quality. Data reflects the past 12 months.
Top Performing Airbnb Hosts in Gryon (2026)
Learn from the best! This table showcases top-performing Airbnb hosts in Gryon based on the number of properties managed and estimated total revenue over the past year. Analyze their scale and performance metrics.
| Host Name | Properties | Grossing Revenue | Stay Reviews | Avg Rating |
|---|---|---|---|---|
| Melinda - Interhome | 16 | $302,627 | 102 | 4.46/5.0 |
| Bernadette | 17 | $275,005 | 49 | 4.46/5.0 |
| Meghan | 5 | $176,831 | 10 | 5.00/5.0 |
| Ian | 1 | $156,468 | 97 | 4.95/5.0 |
| Marco | 1 | $74,438 | 120 | 4.78/5.0 |
| Denis | 1 | $70,914 | 18 | 5.00/5.0 |
| SAS Alpe Des Chaux | 9 | $69,059 | 43 | 4.83/5.0 |
| Laura | 1 | $59,974 | 58 | 4.91/5.0 |
| Murielle | 1 | $51,631 | 2 | Not Rated |
| James | 1 | $47,366 | 20 | 5.00/5.0 |
Analyzing the strategies of top hosts, such as their property selection, pricing, and guest communication, can offer valuable lessons for optimizing your own Airbnb operations in Gryon.
Dive Deeper: Advanced Gryon STR Market Data (2026)
Ready to unlock more insights? AirROI provides access to advanced metrics and comprehensive Airbnb data for Gryon. Explore detailed analytics beyond this report to refine your investment strategy, optimize pricing, and maximize your vacation rental profits.
Explore Advanced MetricsGryon Short-Term Rental Market Composition (2026): Property & Room Types
Room Type Distribution
Property Type Distribution
Market Composition Insights for Gryon
- The Gryon Airbnb market composition is heavily skewed towards Entire Home/Apt listings, which make up 91.5% of the 141 active rentals. This indicates strong guest preference for privacy and space.
- Looking at the property type distribution in Gryon, Apartment/Condo properties are the most common (51.8%), reflecting the local real estate landscape.
- Houses represent a significant 38.3% portion, catering likely to families or larger groups.
- The presence of 8.5% Hotel/Boutique listings indicates integration with traditional hospitality.
- Smaller segments like others (combined 1.4%) offer potential for unique stay experiences.
Gryon Airbnb Room Capacity Analysis (2026): Bedroom Distribution
Distribution of Listings by Number of Bedrooms
Room Capacity Insights for Gryon
- The dominant room capacity in Gryon is 2 bedrooms listings, making up 28.4% of the market. This suggests a strong demand for properties suitable for couples or solo travelers.
- Together, 2 bedrooms and 1 bedroom properties represent 48.3% of the active Airbnb listings in Gryon, indicating a high concentration in these sizes.
- A significant 40.4% of listings offer 3+ bedrooms, catering to larger groups and families seeking more space in Gryon.
Gryon Vacation Rental Guest Capacity Trends (2026)
Distribution of Listings by Guest Capacity
Guest Capacity Insights for Gryon
- The most common guest capacity trend in Gryon vacation rentals is listings accommodating 8+ guests (28.4%). This suggests the primary traveler segment is likely larger groups.
- Properties designed for 8+ guests and 4 guests dominate the Gryon STR market, accounting for 51.8% of listings.
- 46.8% of properties accommodate 6+ guests, serving the market segment for larger families or group travel in Gryon.
- On average, properties in Gryon are equipped to host 5.2 guests.
Gryon Airbnb Booking Patterns (2026): Available vs. Booked Days
Available Days Distribution
Booked Days Distribution
Booking Pattern Insights for Gryon
- The most common availability pattern in Gryon falls within the 271-366 days range, representing 76.6% of listings. This suggests many properties have significant open periods on their calendars.
- Approximately 96.5% of listings show high availability (181+ days open annually), indicating potential for increased bookings or specific owner usage patterns.
- For booked days, the 31-90 days range is most frequent in Gryon (44%), reflecting common guest stay durations or potential owner blocking patterns.
- A notable 3.5% of properties secure long booking periods (181+ days booked per year), highlighting successful long-term rental strategies or significant owner usage.
Gryon Airbnb Minimum Stay Requirements Analysis
Distribution of Listings by Minimum Night Requirement
1 Night
14 listings
9.9% of total
2 Nights
13 listings
9.2% of total
3 Nights
3 listings
2.1% of total
4-6 Nights
31 listings
22% of total
7-29 Nights
9 listings
6.4% of total
30+ Nights
71 listings
50.4% of total
Key Insights
- The most prevalent minimum stay requirement in Gryon is 30+ Nights, adopted by 50.4% of listings. This highlights the market's preference for longer commitments.
- Very short stays (1-2 nights) are less common (19.1%), suggesting hosts prefer slightly longer bookings to optimize turnover.
- A significant segment (50.4%) caters to monthly stays (30+ nights) in Gryon, pointing to opportunities in the extended-stay market.
Recommendations
- Align with the market by considering a 30+ Nights minimum stay, as 50.4% of Gryon hosts use this setting.
- If feasible, allowing 1-night stays, especially midweek or during low season, could capture last-minute bookings, as only 9.9% currently do.
- Explore offering discounts for stays of 30+ nights to attract the 50.4% of the market seeking extended stays.
- Adjust minimum nights based on seasonality – potentially shorter during low season and longer during peak demand periods in Gryon.
Gryon Airbnb Cancellation Policy Trends Analysis (2026)
Super Strict 30 Days
15 listings
10.6% of total
Limited
3 listings
2.1% of total
Flexible
19 listings
13.5% of total
Moderate
33 listings
23.4% of total
Firm
58 listings
41.1% of total
Strict
13 listings
9.2% of total
Cancellation Policy Insights for Gryon
- The prevailing Airbnb cancellation policy trend in Gryon is Firm, used by 41.1% of listings.
- A majority (50.3%) of hosts in Gryon utilize Firm or Strict policies, indicating a market where hosts prioritize booking security.
- Strict cancellation policies are quite rare (9.2%), potentially making listings with this policy less competitive unless justified by high demand or property type.
Recommendations for Hosts
- Consider adopting a Firm policy to align with the 41.1% market standard in Gryon.
- Using a Strict policy might deter some guests, as only 9.2% of listings use it. Evaluate if potential revenue protection outweighs possible lower booking rates.
- Regularly review your cancellation policy against competitors and market demand shifts in Gryon.
Gryon STR Booking Lead Time Analysis (2026)
Average Booking Lead Time by Month
Booking Lead Time Insights for Gryon
- The overall average booking lead time for vacation rentals in Gryon is 54 days.
- Guests book furthest in advance for stays during December (average 91 days), likely coinciding with peak travel demand or local events.
- The shortest booking windows occur for stays in November (average 17 days), indicating more last-minute travel plans during this time.
- Seasonally, Winter (81 days avg.) sees the longest lead times, while Fall (21 days avg.) has the shortest, reflecting typical travel planning cycles.
Recommendations for Hosts
- Use the overall average lead time (54 days) as a baseline for your pricing and availability strategy in Gryon.
- For December stays, consider implementing length-of-stay discounts or slightly higher rates for bookings made less than 91 days out to capitalize on advance planning.
- Target marketing efforts for the Winter season well in advance (at least 81 days) to capture early planners.
- Monitor your own booking lead times against these Gryon averages to identify opportunities for dynamic pricing adjustments.
Popular & Essential Airbnb Amenities in Gryon (2026)
Amenity Prevalence
Amenity Insights for Gryon
- Popular amenities like Heating, Kitchen, Hot water are common but not universal. Offering these can provide a competitive edge.
- Warning: Wifi is not universally provided but is considered essential globally. Ensure reliable Wifi is offered.
Recommendations for Hosts
- Consider adding popular differentiators like Heating or Kitchen to increase appeal.
- Highlight unique or less common amenities you offer (e.g., hot tub, dedicated workspace, EV charger) in your listing description and photos.
- Regularly check competitor amenities in Gryon to stay competitive.
Gryon Airbnb Guest Demographics & Profile Analysis (2026)
Guest Profile Summary for Gryon
- The typical guest profile for Airbnb in Gryon consists of a mix of domestic (47%) and international guests, with top international origins including France, typically belonging to the Post-2000s (Gen Z/Alpha) group (50%), primarily speaking English or French.
- Domestic travelers account for 46.8% of guests.
- Key international markets include Switzerland (46.8%) and France (15.4%).
- Top languages spoken are English (35.6%) followed by French (28.4%).
- A significant demographic segment is the Post-2000s (Gen Z/Alpha) group, representing 50% of guests.
Recommendations for Hosts
- Balance marketing efforts between domestic and international channels based on the guest mix.
- Tailor amenities and listing descriptions to appeal to the dominant Post-2000s (Gen Z/Alpha) demographic (e.g., highlight fast WiFi, smart home features, local guides).
- Highlight unique local experiences or amenities relevant to the primary guest profile.
- Consider seasonal promotions aligned with peak travel times for key origin markets.
Nearby Short-Term Rental Market Comparison
How does the Gryon Airbnb market stack up against its neighbors? Compare key performance metrics like average monthly revenue, ADR, and occupancy rates in surrounding areas to understand the broader regional STR landscape.
| Market | Active Properties | Monthly Revenue | Daily Rate | Avg. Occupancy |
|---|---|---|---|---|
| Brienzwiler | 11 | $7,335 | $514.27 | 60% |
| Niederried bei Interlaken | 19 | $6,267 | $552.03 | 44% |
| Lauterbrunnen | 552 | $6,108 | $487.83 | 51% |
| Ranco | 12 | $5,691 | $536.46 | 42% |
| Matten bei Interlaken | 64 | $5,607 | $336.51 | 59% |
| Grindelwald | 513 | $5,587 | $396.62 | 56% |
| Les Clefs | 34 | $5,585 | $314.08 | 47% |
| Bassersdorf | 16 | $5,337 | $431.59 | 46% |
| Wengen | 12 | $5,115 | $595.38 | 46% |
| Oberhofen am Thunersee | 25 | $5,051 | $329.28 | 51% |