Locarno Airbnb Market Analysis 2026: Short Term Rental Data & Vacation Rental Statistics in Ticino, Switzerland
Is Airbnb profitable in Locarno in 2026? Explore comprehensive Airbnb analytics for Locarno, Ticino, Switzerland to uncover income potential. This 2026 STR market report for Locarno, based on AirROI data from February 2025 to January 2026, reveals key trends in the market of 249 active listings.
Whether you're considering an Airbnb investment in Locarno, optimizing your existing vacation rental, or exploring rental arbitrage opportunities, understanding the Locarno Airbnb data is crucial. Navigating the high regulation landscape is key to maximizing your short term rental income potential. Let's dive into the specifics.
Key Locarno Airbnb Performance Metrics Overview
Monthly Airbnb Revenue Variations & Income Potential in Locarno (2026)
Understanding the monthly revenue variations for Airbnb listings in Locarno is key to maximizing your short term rental income potential. Seasonality significantly impacts earnings. Our analysis, based on data from the past 12 months, shows that the peak revenue month for STRs in Locarno is typically July, while January often presents the lowest earnings, highlighting opportunities for strategic pricing adjustments during shoulder and low seasons. Explore the typical Airbnb income in Locarno across different performance tiers:
- Best-in-class properties (Top 10%) achieve $4,867+ monthly, often utilizing dynamic pricing and superior guest experiences.
- Strong performing properties (Top 25%) earn $3,196 or more, indicating effective management and desirable locations/amenities.
- Typical properties (Median) generate around $1,891 per month, representing the average market performance.
- Entry-level properties (Bottom 25%) see earnings around $973, often with potential for optimization.
Average Monthly Airbnb Earnings Trend in Locarno
Locarno Airbnb Occupancy Rate Trends (2026)
Maximize your bookings by understanding the Locarno STR occupancy trends. Seasonal demand shifts significantly influence how often properties are booked. Typically, Julysees the highest demand (peak season occupancy), while January experiences the lowest (low season). Effective strategies, like adjusting minimum stays or offering promotions, can boost occupancy during slower periods. Here's how different property tiers perform in Locarno:
- Best-in-class properties (Top 10%) achieve 72%+ occupancy, indicating high desirability and potentially optimized availability.
- Strong performing properties (Top 25%) maintain 54% or higher occupancy, suggesting good market fit and guest satisfaction.
- Typical properties (Median) have an occupancy rate around 34%.
- Entry-level properties (Bottom 25%) average 18% occupancy, potentially facing higher vacancy.
Average Monthly Occupancy Rate Trend in Locarno
Average Daily Rate (ADR) Airbnb Trends in Locarno (2026)
Effective short term rental pricing strategy in Locarno involves understanding monthly ADR fluctuations. The Average Daily Rate (ADR) for Airbnb in Locarno typically peaks in July and dips lowest during February. Leveraging Airbnb dynamic pricing tools or strategies based on this seasonality can significantly boost revenue. Here's a look at the typical nightly rates achieved:
- Best-in-class properties (Top 10%) command rates of $358+ per night, often due to premium features or locations.
- Strong performing properties (Top 25%) achieve nightly rates of $245 or more.
- Typical properties (Median) charge around $185 per night.
- Entry-level properties (Bottom 25%) earn around $143 per night.
Average Daily Rate (ADR) Trend by Month in Locarno
Get Live Locarno Market Intelligence 👇

Explore Real-time Analytics
Airbnb Seasonality Analysis & Trends in Locarno (2026)
Peak Season (July, August, September)
- Revenue averages $4,027 per month
- Occupancy rates average 51.6%
- Daily rates average $238
Shoulder Season
- Revenue averages $2,481 per month
- Occupancy maintains around 36.6%
- Daily rates hold near $214
Low Season (January, February, December)
- Revenue drops to average $1,510 per month
- Occupancy decreases to average 23.4%
- Daily rates adjust to average $206
Seasonality Insights for Locarno
- The Airbnb seasonality in Locarno shows highly seasonal trends requiring careful strategy. While the sections above show seasonal averages, it's also insightful to look at the extremes:
- During the high season, the absolute peak month showcases Locarno's highest earning potential, with monthly revenues capable of climbing to $4,911, occupancy reaching a high of 60.4%, and ADRs peaking at $243.
- Conversely, the slowest single month of the year, typically falling within the low season, marks the market's lowest point. In this month, revenue might dip to $1,088, occupancy could drop to 16.2%, and ADRs may adjust down to $193.
- Understanding both the seasonal averages and these monthly peaks and troughs in revenue, occupancy, and ADR is crucial for maximizing your Airbnb profit potential in Locarno.
Seasonal Strategies for Maximizing Profit
- Peak Season: Maximize revenue through premium pricing and potentially longer minimum stays. Ensure high availability.
- Low Season: Offer competitive pricing, special promotions (e.g., extended stay discounts), and flexible cancellation policies. Target off-season travelers like remote workers or budget-conscious guests.
- Shoulder Seasons: Implement dynamic pricing that balances peak and low rates. Target weekend travelers or specific events. Offer slightly more flexible terms than peak season.
- Regularly analyze your own performance against these Locarno seasonality benchmarks and adjust your pricing and availability strategy accordingly.
Best Areas for Airbnb Investment in Locarno (2026)
Exploring the top neighborhoods for short-term rentals in Locarno? This section highlights key areas, outlining why they are attractive for hosts and guests, along with notable local attractions. Consider these locations based on your target guest profile and investment strategy.
| Neighborhood / Area | Why Host Here? (Target Guests & Appeal) | Key Attractions & Landmarks |
|---|---|---|
| Lakefront Promenade | A beautiful lakeside area perfect for those seeking relaxation and stunning views. Guests can enjoy a stroll along the promenade, with great access to the lake and nearby parks. | Lago Maggiore, Parco Ciani, Villa Florida, Castello Visconteo, Piazza Grande |
| Old Town (Centro Storico) | Charming medieval streets filled with shops, cafes, and historic sites. A highly sought-after area for tourists wanting to experience the local culture and history. | Piazza Grande, Church of San Francesco, Museo Comunale, Castello Visconteo, Riviera dei Castelli |
| Monti di Verde | An elevated area offering panoramic views over Locarno and Lake Maggiore. Great for nature lovers and those looking for hiking and outdoor activities. | Sentiero dei Laghetti, Valle della Motta, Parks and nature trails, Local wineries |
| Orselina | A tranquil neighborhood located a short distance from the hustle and bustle of Locarno, offering peace and scenic views. Ideal for travelers seeking a quiet retreat. | Madonna del Sasso, Parco Al Patriarca, Views of the lake, Easy access to hiking trails |
| Locarno Center | The heart of the city, close to shops, restaurants, and cultural attractions. Ideal for guests wanting convenience and access to local services. | Piazza Grande, Cinema Palazzo, Local markets, Dining options |
| Lungolago | The lake promenade stretches along the water, perfect for leisure activities and events. Attracts visitors for walking, biking, and enjoying cafes along the waterfront. | Lido di Locarno, Water sports, Events and festivals, Parks along the lake |
| Piazza Grande Events Area | Famous for hosting various events and festivals, making it a hot spot for visitors during the summer. Great for short-term rentals during peak event times. | Locarno Film Festival, Christmas Market, Concerts, Cultural events |
| Ticino Wine Region | Famous for its picturesque landscapes and vineyards. Attracts wine lovers and foodies, ideal for those looking to explore local cuisine and wines. | Local wineries, Wine tours, Scenic drives, Culinary experiences |
Understanding Airbnb License Requirements & STR Laws in Locarno (2026)
Yes, Locarno, Ticino, Switzerland enforces high STR regulations. Obtaining a license and ensuring compliance is almost certainly required according to current 2026 STR laws. Always verify the latest short term rental regulations and Airbnb license requirements directly with local government authorities for Locarno to ensure full compliance before hosting.
(Source: AirROI data, 2026, based on 65% licensed listings)
Top Performing Airbnb Properties in Locarno (2026)
Benchmark your potential! Explore examples of top-performing Airbnb properties in Locarnobased on Trailing Twelve Month (TTM) revenue. Analyze their characteristics, revenue, occupancy rate, and ADR to understand what drives success in this market.
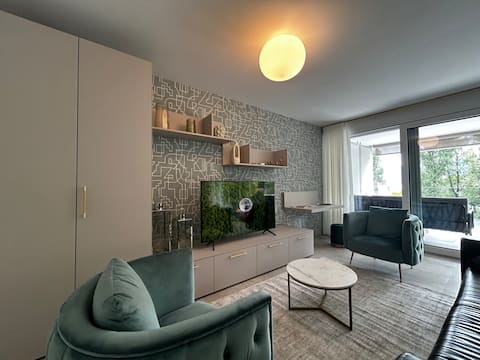
Family apartment, near the beach whit P. car park
Entire Place • 2 bedrooms

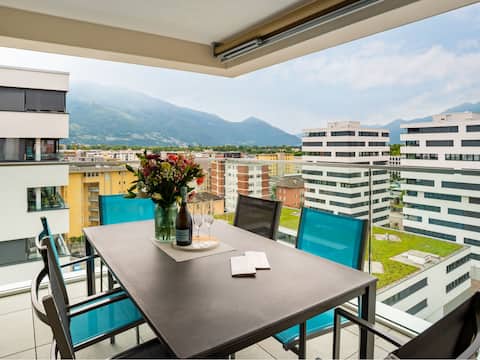
♥CasaSerena Rustico typical Ticino garden lake view
Entire Place • 3 bedrooms

Lake View Penthouse Apt. 701 AIR-CONDITIONED
Entire Place • 3 bedrooms

GrischinaLago, traumhafte Dachwohnung mit Seesicht
Entire Place • 3 bedrooms
LocTowers A4.9.2 by Interhome
Entire Place • 3 bedrooms

Cà di noni Maria e Aldo for families
Entire Place • 3 bedrooms
Note: Performance varies based on location, size, amenities, seasonality, and management quality. Data reflects the past 12 months.
Top Performing Airbnb Hosts in Locarno (2026)
Learn from the best! This table showcases top-performing Airbnb hosts in Locarno based on the number of properties managed and estimated total revenue over the past year. Analyze their scale and performance metrics.
| Host Name | Properties | Grossing Revenue | Stay Reviews | Avg Rating |
|---|---|---|---|---|
| Franco - Interhome Group | 31 | $658,867 | 321 | 4.81/5.0 |
| Residenza Vivian | 17 | $490,133 | 569 | 4.83/5.0 |
| Alberto | 1 | $465,978 | 44 | 4.93/5.0 |
| Quokka Team | 18 | $387,326 | 299 | 4.50/5.0 |
| Giorgio | 1 | $200,055 | 128 | 4.89/5.0 |
| Nostrana Holiday Homes | 6 | $154,088 | 128 | 4.91/5.0 |
| Christian | 8 | $127,937 | 73 | 4.61/5.0 |
| Dino Charlotte Michael | 5 | $112,813 | 329 | 4.67/5.0 |
| Host #57050063 | 7 | $96,057 | 394 | 4.27/5.0 |
| Tiziano | 8 | $90,176 | 17 | 4.89/5.0 |
Analyzing the strategies of top hosts, such as their property selection, pricing, and guest communication, can offer valuable lessons for optimizing your own Airbnb operations in Locarno.
Dive Deeper: Advanced Locarno STR Market Data (2026)
Ready to unlock more insights? AirROI provides access to advanced metrics and comprehensive Airbnb data for Locarno. Explore detailed analytics beyond this report to refine your investment strategy, optimize pricing, and maximize your vacation rental profits.
Explore Advanced MetricsLocarno Short-Term Rental Market Composition (2026): Property & Room Types
Room Type Distribution
Property Type Distribution
Market Composition Insights for Locarno
- The Locarno Airbnb market composition is heavily skewed towards Entire Home/Apt listings, which make up 90.4% of the 249 active rentals. This indicates strong guest preference for privacy and space.
- Looking at the property type distribution in Locarno, Apartment/Condo properties are the most common (86.3%), reflecting the local real estate landscape.
- Smaller segments like hotel/boutique (combined 4.4%) offer potential for unique stay experiences.
Locarno Airbnb Room Capacity Analysis (2026): Bedroom Distribution
Distribution of Listings by Number of Bedrooms
Room Capacity Insights for Locarno
- The dominant room capacity in Locarno is 1 bedroom listings, making up 52.6% of the market. This suggests a strong demand for properties suitable for couples or solo travelers.
- Together, 1 bedroom and 2 bedrooms properties represent 79.1% of the active Airbnb listings in Locarno, indicating a high concentration in these sizes.
- With over half the market (52.6%) consisting of studios or 1-bedroom units, Locarno is particularly well-suited for individuals or couples.
- Listings with 3+ bedrooms (8.4%) represent a smaller niche, potentially indicating an underserved market for larger group accommodations in Locarno.
Locarno Vacation Rental Guest Capacity Trends (2026)
Distribution of Listings by Guest Capacity
Guest Capacity Insights for Locarno
- The most common guest capacity trend in Locarno vacation rentals is listings accommodating 4 guests (36.5%). This suggests the primary traveler segment is likely small families or groups.
- Properties designed for 4 guests and 2 guests dominate the Locarno STR market, accounting for 69.4% of listings.
- 10.4% of properties accommodate 6+ guests, serving the market segment for larger families or group travel in Locarno.
- On average, properties in Locarno are equipped to host 3.3 guests.
Locarno Airbnb Booking Patterns (2026): Available vs. Booked Days
Available Days Distribution
Booked Days Distribution
Booking Pattern Insights for Locarno
- The most common availability pattern in Locarno falls within the 271-366 days range, representing 57% of listings. This suggests many properties have significant open periods on their calendars.
- Approximately 87.9% of listings show high availability (181+ days open annually), indicating potential for increased bookings or specific owner usage patterns.
- For booked days, the 31-90 days range is most frequent in Locarno (37.3%), reflecting common guest stay durations or potential owner blocking patterns.
- A notable 12.8% of properties secure long booking periods (181+ days booked per year), highlighting successful long-term rental strategies or significant owner usage.
Locarno Airbnb Minimum Stay Requirements Analysis
Distribution of Listings by Minimum Night Requirement
1 Night
43 listings
17.3% of total
2 Nights
45 listings
18.1% of total
3 Nights
17 listings
6.8% of total
4-6 Nights
16 listings
6.4% of total
7-29 Nights
9 listings
3.6% of total
30+ Nights
119 listings
47.8% of total
Key Insights
- The most prevalent minimum stay requirement in Locarno is 30+ Nights, adopted by 47.8% of listings. This highlights the market's preference for longer commitments.
- A significant segment (47.8%) caters to monthly stays (30+ nights) in Locarno, pointing to opportunities in the extended-stay market.
Recommendations
- Align with the market by considering a 30+ Nights minimum stay, as 47.8% of Locarno hosts use this setting.
- If feasible, allowing 1-night stays, especially midweek or during low season, could capture last-minute bookings, as only 17.3% currently do.
- Explore offering discounts for stays of 30+ nights to attract the 47.8% of the market seeking extended stays.
- Adjust minimum nights based on seasonality – potentially shorter during low season and longer during peak demand periods in Locarno.
Locarno Airbnb Cancellation Policy Trends Analysis (2026)
Limited
5 listings
2% of total
Flexible
30 listings
12% of total
Moderate
97 listings
39% of total
Firm
103 listings
41.4% of total
Strict
14 listings
5.6% of total
Cancellation Policy Insights for Locarno
- The prevailing Airbnb cancellation policy trend in Locarno is Firm, used by 41.4% of listings.
- There's a relatively balanced mix between guest-friendly (51.0%) and stricter (47.0%) policies, offering choices for different guest needs.
- Strict cancellation policies are quite rare (5.6%), potentially making listings with this policy less competitive unless justified by high demand or property type.
Recommendations for Hosts
- Consider adopting a Firm policy to align with the 41.4% market standard in Locarno.
- Using a Strict policy might deter some guests, as only 5.6% of listings use it. Evaluate if potential revenue protection outweighs possible lower booking rates.
- Regularly review your cancellation policy against competitors and market demand shifts in Locarno.
Locarno STR Booking Lead Time Analysis (2026)
Average Booking Lead Time by Month
Booking Lead Time Insights for Locarno
- The overall average booking lead time for vacation rentals in Locarno is 63 days.
- Guests book furthest in advance for stays during July (average 99 days), likely coinciding with peak travel demand or local events.
- The shortest booking windows occur for stays in February (average 34 days), indicating more last-minute travel plans during this time.
- Seasonally, Summer (86 days avg.) sees the longest lead times, while Winter (42 days avg.) has the shortest, reflecting typical travel planning cycles.
Recommendations for Hosts
- Use the overall average lead time (63 days) as a baseline for your pricing and availability strategy in Locarno.
- For July stays, consider implementing length-of-stay discounts or slightly higher rates for bookings made less than 99 days out to capitalize on advance planning.
- Target marketing efforts for the Summer season well in advance (at least 86 days) to capture early planners.
- Monitor your own booking lead times against these Locarno averages to identify opportunities for dynamic pricing adjustments.
Popular & Essential Airbnb Amenities in Locarno (2026)
Amenity Prevalence
Amenity Insights for Locarno
- Essential amenities in Locarno that guests expect include: Wifi, Heating. Lacking these (any) could significantly impact bookings.
- Popular amenities like Kitchen, Hair dryer, Hot water are common but not universal. Offering these can provide a competitive edge.
Recommendations for Hosts
- Ensure your listing includes all essential amenities for Locarno: Wifi, Heating.
- Prioritize adding missing essentials: Wifi, Heating.
- Consider adding popular differentiators like Kitchen or Hair dryer to increase appeal.
- Highlight unique or less common amenities you offer (e.g., hot tub, dedicated workspace, EV charger) in your listing description and photos.
- Regularly check competitor amenities in Locarno to stay competitive.
Locarno Airbnb Guest Demographics & Profile Analysis (2026)
Guest Profile Summary for Locarno
- The typical guest profile for Airbnb in Locarno consists of primarily domestic travelers (68%), often arriving from nearby Zürich, typically belonging to the Post-2000s (Gen Z/Alpha) group (50%), primarily speaking English or German.
- Domestic travelers account for 67.5% of guests.
- Key international markets include Switzerland (67.5%) and United States (6.9%).
- Top languages spoken are English (34.9%) followed by German (27.4%).
- A significant demographic segment is the Post-2000s (Gen Z/Alpha) group, representing 50% of guests.
Recommendations for Hosts
- Target domestic marketing efforts towards travelers from Zürich and Zurich.
- Tailor amenities and listing descriptions to appeal to the dominant Post-2000s (Gen Z/Alpha) demographic (e.g., highlight fast WiFi, smart home features, local guides).
- Highlight unique local experiences or amenities relevant to the primary guest profile.
- Consider seasonal promotions aligned with peak travel times for key origin markets.
Nearby Short-Term Rental Market Comparison
How does the Locarno Airbnb market stack up against its neighbors? Compare key performance metrics like average monthly revenue, ADR, and occupancy rates in surrounding areas to understand the broader regional STR landscape.
| Market | Active Properties | Monthly Revenue | Daily Rate | Avg. Occupancy |
|---|---|---|---|---|
| Brienzwiler | 11 | $7,335 | $514.27 | 60% |
| Niederried bei Interlaken | 19 | $6,267 | $552.03 | 44% |
| Lauterbrunnen | 552 | $6,108 | $487.83 | 51% |
| Ranco | 12 | $5,691 | $536.46 | 42% |
| Matten bei Interlaken | 64 | $5,607 | $336.51 | 59% |
| Grindelwald | 513 | $5,587 | $396.62 | 56% |
| Bassersdorf | 16 | $5,337 | $431.59 | 46% |
| Wengen | 12 | $5,115 | $595.38 | 46% |
| Oberhofen am Thunersee | 25 | $5,051 | $329.28 | 51% |
| Zermatt | 792 | $5,017 | $504.14 | 46% |