Bollebygds kommun Airbnb Market Analysis 2025: Short Term Rental Data & Vacation Rental Statistics in Västra Götaland County, Sweden
Is Airbnb profitable in Bollebygds kommun in 2025? Explore comprehensive Airbnb analytics for Bollebygds kommun, Västra Götaland County, Sweden to uncover income potential. This 2025 STR market report for Bollebygds kommun, based on AirROI data from June 2024 to May 2025, reveals key trends in the niche market of 20 active listings.
Whether you're considering an Airbnb investment in Bollebygds kommun, optimizing your existing vacation rental, or exploring rental arbitrage opportunities, understanding the Bollebygds kommun Airbnb data is crucial. Leveraging the low regulation environment is key to maximizing your short term rental income potential. Let's dive into the specifics.
Key Bollebygds kommun Airbnb Performance Metrics Overview
Monthly Airbnb Revenue Variations & Income Potential in Bollebygds kommun (2025)
Understanding the monthly revenue variations for Airbnb listings in Bollebygds kommun is key to maximizing your short term rental income potential. Seasonality significantly impacts earnings. Our analysis, based on data from the past 12 months, shows that the peak revenue month for STRs in Bollebygds kommun is typically November, while January often presents the lowest earnings, highlighting opportunities for strategic pricing adjustments during shoulder and low seasons. Explore the typical Airbnb income in Bollebygds kommun across different performance tiers:
- Best-in-class properties (Top 10%) achieve $6,154+ monthly, often utilizing dynamic pricing and superior guest experiences.
- Strong performing properties (Top 25%) earn $3,230 or more, indicating effective management and desirable locations/amenities.
- Typical properties (Median) generate around $1,288 per month, representing the average market performance.
- Entry-level properties (Bottom 25%) see earnings around $772, often with potential for optimization.
Average Monthly Airbnb Earnings Trend in Bollebygds kommun
Bollebygds kommun Airbnb Occupancy Rate Trends (2025)
Maximize your bookings by understanding the Bollebygds kommun STR occupancy trends. Seasonal demand shifts significantly influence how often properties are booked. Typically, Octobersees the highest demand (peak season occupancy), while January experiences the lowest (low season). Effective strategies, like adjusting minimum stays or offering promotions, can boost occupancy during slower periods. Here's how different property tiers perform in Bollebygds kommun:
- Best-in-class properties (Top 10%) achieve 78%+ occupancy, indicating high desirability and potentially optimized availability.
- Strong performing properties (Top 25%) maintain 58% or higher occupancy, suggesting good market fit and guest satisfaction.
- Typical properties (Median) have an occupancy rate around 33%.
- Entry-level properties (Bottom 25%) average 19% occupancy, potentially facing higher vacancy.
Average Monthly Occupancy Rate Trend in Bollebygds kommun
Average Daily Rate (ADR) Airbnb Trends in Bollebygds kommun (2025)
Effective short term rental pricing strategy in Bollebygds kommun involves understanding monthly ADR fluctuations. The Average Daily Rate (ADR) for Airbnb in Bollebygds kommun typically peaks in May and dips lowest during September. Leveraging Airbnb dynamic pricing tools or strategies based on this seasonality can significantly boost revenue. Here's a look at the typical nightly rates achieved:
- Best-in-class properties (Top 10%) command rates of $327+ per night, often due to premium features or locations.
- Strong performing properties (Top 25%) achieve nightly rates of $267 or more.
- Typical properties (Median) charge around $156 per night.
- Entry-level properties (Bottom 25%) earn around $94 per night.
Average Daily Rate (ADR) Trend by Month in Bollebygds kommun
Get Live Bollebygds kommun Market Intelligence 👇

Explore Real-time Analytics
Airbnb Seasonality Analysis & Trends in Bollebygds kommun (2025)
Peak Season (November, October, July)
- Revenue averages $3,059 per month
- Occupancy rates average 53.9%
- Daily rates average $193
Shoulder Season
- Revenue averages $2,380 per month
- Occupancy maintains around 39.5%
- Daily rates hold near $195
Low Season (January, May, September)
- Revenue drops to average $1,674 per month
- Occupancy decreases to average 28.7%
- Daily rates adjust to average $199
Seasonality Insights for Bollebygds kommun
- The Airbnb seasonality in Bollebygds kommun shows highly seasonal trends requiring careful strategy. While the sections above show seasonal averages, it's also insightful to look at the extremes:
- During the high season, the absolute peak month showcases Bollebygds kommun's highest earning potential, with monthly revenues capable of climbing to $3,374, occupancy reaching a high of 54.8%, and ADRs peaking at $207.
- Conversely, the slowest single month of the year, typically falling within the low season, marks the market's lowest point. In this month, revenue might dip to $1,472, occupancy could drop to 21.8%, and ADRs may adjust down to $191.
- Understanding both the seasonal averages and these monthly peaks and troughs in revenue, occupancy, and ADR is crucial for maximizing your Airbnb profit potential in Bollebygds kommun.
Seasonal Strategies for Maximizing Profit
- Peak Season: Maximize revenue through premium pricing and potentially longer minimum stays. Ensure high availability.
- Low Season: Offer competitive pricing, special promotions (e.g., extended stay discounts), and flexible cancellation policies. Target off-season travelers like remote workers or budget-conscious guests.
- Shoulder Seasons: Implement dynamic pricing that balances peak and low rates. Target weekend travelers or specific events. Offer slightly more flexible terms than peak season.
- Regularly analyze your own performance against these Bollebygds kommun seasonality benchmarks and adjust your pricing and availability strategy accordingly.
Best Areas for Airbnb Investment in Bollebygds kommun (2025)
Exploring the top neighborhoods for short-term rentals in Bollebygds kommun? This section highlights key areas, outlining why they are attractive for hosts and guests, along with notable local attractions. Consider these locations based on your target guest profile and investment strategy.
| Neighborhood / Area | Why Host Here? (Target Guests & Appeal) | Key Attractions & Landmarks |
|---|---|---|
| Bollebygd | A quaint locality with a charming atmosphere, Bollebygd is perfect for travelers seeking a peaceful retreat while being close to nature. The area offers beautiful landscapes and local culture, appealing to those who want a laid-back experience. | Bollebygd Church, Bollebygd Center, Stora Enen, Västra Götaland Nature Reserve, Bollebygd's local parks |
| Viskafors | A serene area known for its rich history and close proximity to water activities. Viskafors attracts visitors who enjoy outdoor adventures and historical exploration. | Viskafors Mill, Viskafors Park, Local hiking trails, Fishing spots, Canoeing opportunities |
| Kåhög | Kåhög is renowned for its scenic beauty and rural charm. It’s an excellent spot for families and nature lovers who wish to escape the bustling city life. | Kåhög Nature Reserve, Local farms, Hiking paths, Community events, Fishing and picnic areas |
| Landvetter | Known for its proximity to the Landvetter Airport, this area attracts business travelers as well as tourists. It offers a mix of convenience and accessibility to the rest of Västra Götaland County. | Landvetter Airport, Nearby shopping centers, Restaurants, Local cycling paths, Parks |
| Sisjön | A picturesque village known for its greenery and tranquil atmosphere, making it an ideal spot for weekend getaways. Visitors enjoy the peaceful environment and local culture. | Sisjön Lake, Natural parks, Biking trails, Seasonal festivals, Local art shops |
| Rävekäla | A small yet vibrant area that draws people interested in local crafts and small-town charm. It hosts various community events and markets, appealing to those who appreciate cultural experiences. | Local craft markets, Rävekäla Parks, Cultural events, Artisan shops, Community gatherings |
| Fritsla | Fritsla is a cozy village known for its family-friendly environment and local traditions. It is popular among visitors looking for a genuine Swedish experience. | Fritsla Church, Community park, Local markets, Traditional events, Village festivals |
| Brämhult | Brämhult boasts beautiful scenic views and is known for its outdoor activities, making it a great destination for adventure seekers and nature enthusiasts. | Brämhult Nature Trails, Bird watching spots, Local farms, Hiking areas, Eco-friendly cafes |
Understanding Airbnb License Requirements & STR Laws in Bollebygds kommun (2025)
While Bollebygds kommun, Västra Götaland County, Sweden currently shows low STR regulations, specific Airbnb license requirements might still exist or change. Always verify the latest short term rental regulations and Airbnb license requirements directly with local government authorities for Bollebygds kommun to ensure full compliance before hosting.
(Source: AirROI data, 2025, finding no licensed listings among those analyzed)
Top Performing Airbnb Properties in Bollebygds kommun (2025)
Benchmark your potential! Explore examples of top-performing Airbnb properties in Bollebygds kommunbased on Trailing Twelve Month (TTM) revenue. Analyze their characteristics, revenue, occupancy rate, and ADR to understand what drives success in this market.

Strandvilla i natursköna Gesebol
Entire Place • 4 bedrooms
Fantastic modern cabin just by the lake!
Entire Place • 1 bedroom
Svensk idyll med egen brygga
Entire Place • 4 bedrooms
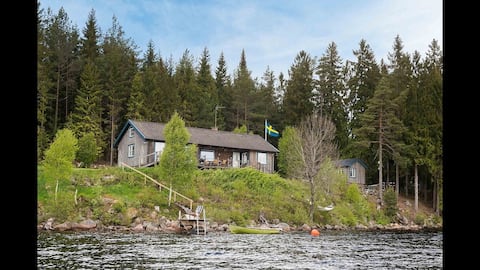
Swedish dream house at the lake
Entire Place • 3 bedrooms

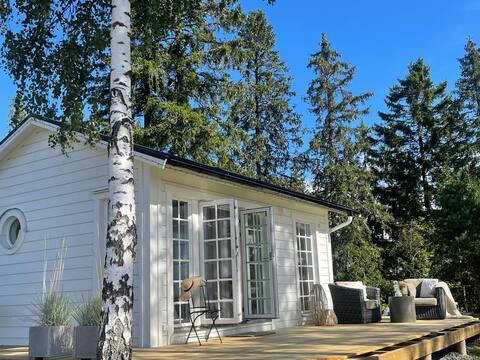
Newly built design house 10 meters from water.
Entire Place • 3 bedrooms
House with wonderful lake view
Entire Place • 4 bedrooms
Note: Performance varies based on location, size, amenities, seasonality, and management quality. Data reflects the past 12 months.
Top Performing Airbnb Hosts in Bollebygds kommun (2025)
Learn from the best! This table showcases top-performing Airbnb hosts in Bollebygds kommun based on the number of properties managed and estimated total revenue over the past year. Analyze their scale and performance metrics.
| Host Name | Properties | Grossing Revenue | Stay Reviews | Avg Rating |
|---|---|---|---|---|
| Anna | 1 | $92,301 | 28 | 5.00/5.0 |
| Patrik | 1 | $30,310 | 65 | 5.00/5.0 |
| Anders | 2 | $24,966 | 23 | 5.00/5.0 |
| Host #198620133 | 1 | $22,855 | 0 | N/A/5.0 |
| Maria | 1 | $21,055 | 39 | 4.97/5.0 |
| Mikael | 1 | $18,307 | 35 | 5.00/5.0 |
| Malin | 1 | $13,970 | 152 | 4.76/5.0 |
| Martin | 1 | $11,942 | 132 | 4.94/5.0 |
| Tord | 1 | $9,478 | 78 | 4.82/5.0 |
| Host #141538745 | 1 | $9,278 | 0 | N/A/5.0 |
Analyzing the strategies of top hosts, such as their property selection, pricing, and guest communication, can offer valuable lessons for optimizing your own Airbnb operations in Bollebygds kommun.
Dive Deeper: Advanced Bollebygds kommun STR Market Data (2025)
Ready to unlock more insights? AirROI provides access to advanced metrics and comprehensive Airbnb data for Bollebygds kommun. Explore detailed analytics beyond this report to refine your investment strategy, optimize pricing, and maximize your vacation rental profits.
Explore Advanced MetricsBollebygds kommun Short-Term Rental Market Composition (2025): Property & Room Types
Room Type Distribution
Property Type Distribution
Market Composition Insights for Bollebygds kommun
- The Bollebygds kommun Airbnb market composition is heavily skewed towards Entire Home/Apt listings, which make up 100% of the 20 active rentals. This indicates strong guest preference for privacy and space.
- Looking at the property type distribution in Bollebygds kommun, House properties are the most common (70%), reflecting the local real estate landscape.
- Houses represent a significant 70% portion, catering likely to families or larger groups.
Bollebygds kommun Airbnb Room Capacity Analysis (2025): Bedroom Distribution
Distribution of Listings by Number of Bedrooms
Room Capacity Insights for Bollebygds kommun
- The dominant room capacity in Bollebygds kommun is 2 bedrooms listings, making up 30% of the market. This suggests a strong demand for properties suitable for couples or solo travelers.
- Together, 2 bedrooms and 1 bedroom properties represent 50.0% of the active Airbnb listings in Bollebygds kommun, indicating a high concentration in these sizes.
- A significant 45.0% of listings offer 3+ bedrooms, catering to larger groups and families seeking more space in Bollebygds kommun.
Bollebygds kommun Vacation Rental Guest Capacity Trends (2025)
Distribution of Listings by Guest Capacity
Guest Capacity Insights for Bollebygds kommun
- The most common guest capacity trend in Bollebygds kommun vacation rentals is listings accommodating 4 guests (35%). This suggests the primary traveler segment is likely small families or groups.
- Properties designed for 4 guests and 8+ guests dominate the Bollebygds kommun STR market, accounting for 60.0% of listings.
- 45.0% of properties accommodate 6+ guests, serving the market segment for larger families or group travel in Bollebygds kommun.
- On average, properties in Bollebygds kommun are equipped to host 5.4 guests.
Bollebygds kommun Airbnb Booking Patterns (2025): Available vs. Booked Days
Available Days Distribution
Booked Days Distribution
Booking Pattern Insights for Bollebygds kommun
- The most common availability pattern in Bollebygds kommun falls within the 271-366 days range, representing 75% of listings. This suggests many properties have significant open periods on their calendars.
- Approximately 90.0% of listings show high availability (181+ days open annually), indicating potential for increased bookings or specific owner usage patterns.
- For booked days, the 31-90 days range is most frequent in Bollebygds kommun (45%), reflecting common guest stay durations or potential owner blocking patterns.
- A notable 10.0% of properties secure long booking periods (181+ days booked per year), highlighting successful long-term rental strategies or significant owner usage.
Bollebygds kommun Airbnb Minimum Stay Requirements Analysis
Distribution of Listings by Minimum Night Requirement
1 Night
5 listings
27.8% of total
2 Nights
6 listings
33.3% of total
4-6 Nights
5 listings
27.8% of total
7-29 Nights
1 listings
5.6% of total
30+ Nights
1 listings
5.6% of total
Key Insights
- The most prevalent minimum stay requirement in Bollebygds kommun is 2 Nights, adopted by 33.3% of listings. This highlights the market's preference for shorter, flexible bookings.
- A strong majority (61.1%) of the Bollebygds kommun Airbnb data shows acceptance of very short stays (1-2 nights), indicating a dynamic, high-turnover market.
Recommendations
- Align with the market by considering a 2 Nights minimum stay, as 33.3% of Bollebygds kommun hosts use this setting.
- If feasible, allowing 1-night stays, especially midweek or during low season, could capture last-minute bookings, as only 27.8% currently do.
- Explore offering discounts for stays of 30+ nights to attract the 5.6% of the market seeking extended stays.
- Adjust minimum nights based on seasonality – potentially shorter during low season and longer during peak demand periods in Bollebygds kommun.
Bollebygds kommun Airbnb Cancellation Policy Trends Analysis (2025)
Flexible
4 listings
30.8% of total
Moderate
4 listings
30.8% of total
Firm
2 listings
15.4% of total
Strict
3 listings
23.1% of total
Cancellation Policy Insights for Bollebygds kommun
- The prevailing Airbnb cancellation policy trend in Bollebygds kommun is Flexible, used by 30.8% of listings.
- There's a relatively balanced mix between guest-friendly (61.6%) and stricter (38.5%) policies, offering choices for different guest needs.
Recommendations for Hosts
- Consider adopting a Flexible policy to align with the 30.8% market standard in Bollebygds kommun.
- Regularly review your cancellation policy against competitors and market demand shifts in Bollebygds kommun.
Bollebygds kommun STR Booking Lead Time Analysis (2025)
Average Booking Lead Time by Month
Booking Lead Time Insights for Bollebygds kommun
- The overall average booking lead time for vacation rentals in Bollebygds kommun is 68 days.
- Guests book furthest in advance for stays during June (average 109 days), likely coinciding with peak travel demand or local events.
- The shortest booking windows occur for stays in November (average 27 days), indicating more last-minute travel plans during this time.
- Seasonally, Summer (107 days avg.) sees the longest lead times, while Winter (45 days avg.) has the shortest, reflecting typical travel planning cycles.
Recommendations for Hosts
- Use the overall average lead time (68 days) as a baseline for your pricing and availability strategy in Bollebygds kommun.
- For June stays, consider implementing length-of-stay discounts or slightly higher rates for bookings made less than 109 days out to capitalize on advance planning.
- Target marketing efforts for the Summer season well in advance (at least 107 days) to capture early planners.
- Monitor your own booking lead times against these Bollebygds kommun averages to identify opportunities for dynamic pricing adjustments.
Popular & Essential Airbnb Amenities in Bollebygds kommun (2025)
Amenity Prevalence
Amenity Insights for Bollebygds kommun
- Essential amenities in Bollebygds kommun that guests expect include: Kitchen, Heating, Smoke alarm, Free parking on premises. Lacking these (any) could significantly impact bookings.
- Popular amenities like Hot water, Wifi, Cooking basics are common but not universal. Offering these can provide a competitive edge.
- Warning: Wifi is not universally provided but is considered essential globally. Ensure reliable Wifi is offered.
Recommendations for Hosts
- Ensure your listing includes all essential amenities for Bollebygds kommun: Kitchen, Heating, Smoke alarm, Free parking on premises.
- Prioritize adding missing essentials: Smoke alarm, Free parking on premises.
- Consider adding popular differentiators like Hot water or Wifi to increase appeal.
- Highlight unique or less common amenities you offer (e.g., hot tub, dedicated workspace, EV charger) in your listing description and photos.
- Regularly check competitor amenities in Bollebygds kommun to stay competitive.
Bollebygds kommun Airbnb Guest Demographics & Profile Analysis (2025)
Guest Profile Summary for Bollebygds kommun
- The typical guest profile for Airbnb in Bollebygds kommun consists of predominantly international visitors (85%), with top international origins including Sweden, typically belonging to the Post-2000s (Gen Z/Alpha) group (50%), primarily speaking English or German.
- Domestic travelers account for 15.0% of guests.
- Key international markets include Germany (37.5%) and Sweden (15%).
- Top languages spoken are English (39%) followed by German (21%).
- A significant demographic segment is the Post-2000s (Gen Z/Alpha) group, representing 50% of guests.
Recommendations for Hosts
- Focus marketing internationally, particularly towards travelers from Sweden.
- Tailor amenities and listing descriptions to appeal to the dominant Post-2000s (Gen Z/Alpha) demographic (e.g., highlight fast WiFi, smart home features, local guides).
- Highlight unique local experiences or amenities relevant to the primary guest profile.
- Consider seasonal promotions aligned with peak travel times for key origin markets.
Nearby Short-Term Rental Market Comparison
How does the Bollebygds kommun Airbnb market stack up against its neighbors? Compare key performance metrics like average monthly revenue, ADR, and occupancy rates in surrounding areas to understand the broader regional STR landscape.
| Market | Active Properties | Monthly Revenue | Daily Rate | Avg. Occupancy |
|---|---|---|---|---|
| Perstorps kommun | 11 | $1,895 | $160.31 | 51% |
| Lerums kommun | 38 | $1,848 | $256.07 | 41% |
| Gnosjö kommun | 20 | $1,643 | $157.32 | 41% |
| Hestra | 14 | $1,622 | $168.54 | 41% |
| Starrkärr och Näs | 13 | $1,451 | $238.25 | 20% |
| Mölle | 45 | $1,441 | $193.62 | 39% |
| Snekkersten | 24 | $1,437 | $228.25 | 42% |
| Trönningenäs | 17 | $1,437 | $267.81 | 44% |
| Udsholt | 97 | $1,405 | $213.84 | 36% |
| Laröd | 10 | $1,349 | $323.11 | 41% |