Rumassala Airbnb Market Analysis 2026: Short Term Rental Data & Vacation Rental Statistics in Southern Province, Sri Lanka
Is Airbnb profitable in Rumassala in 2026? Explore comprehensive Airbnb analytics for Rumassala, Southern Province, Sri Lanka to uncover income potential. This 2026 STR market report for Rumassala, based on AirROI data from February 2025 to January 2026, reveals key trends in the niche market of 116 active listings.
Whether you're considering an Airbnb investment in Rumassala, optimizing your existing vacation rental, or exploring rental arbitrage opportunities, understanding the Rumassala Airbnb data is crucial. Leveraging the low regulation environment is key to maximizing your short term rental income potential. Let's dive into the specifics.
Key Rumassala Airbnb Performance Metrics Overview
Monthly Airbnb Revenue Variations & Income Potential in Rumassala (2026)
Understanding the monthly revenue variations for Airbnb listings in Rumassala is key to maximizing your short term rental income potential. Seasonality significantly impacts earnings. Our analysis, based on data from the past 12 months, shows that the peak revenue month for STRs in Rumassala is typically December, while May often presents the lowest earnings, highlighting opportunities for strategic pricing adjustments during shoulder and low seasons. Explore the typical Airbnb income in Rumassala across different performance tiers:
- Best-in-class properties (Top 10%) achieve $3,488+ monthly, often utilizing dynamic pricing and superior guest experiences.
- Strong performing properties (Top 25%) earn $1,237 or more, indicating effective management and desirable locations/amenities.
- Typical properties (Median) generate around $448 per month, representing the average market performance.
- Entry-level properties (Bottom 25%) see earnings around $189, often with potential for optimization.
Average Monthly Airbnb Earnings Trend in Rumassala
Rumassala Airbnb Occupancy Rate Trends (2026)
Maximize your bookings by understanding the Rumassala STR occupancy trends. Seasonal demand shifts significantly influence how often properties are booked. Typically, Februarysees the highest demand (peak season occupancy), while May experiences the lowest (low season). Effective strategies, like adjusting minimum stays or offering promotions, can boost occupancy during slower periods. Here's how different property tiers perform in Rumassala:
- Best-in-class properties (Top 10%) achieve 69%+ occupancy, indicating high desirability and potentially optimized availability.
- Strong performing properties (Top 25%) maintain 49% or higher occupancy, suggesting good market fit and guest satisfaction.
- Typical properties (Median) have an occupancy rate around 26%.
- Entry-level properties (Bottom 25%) average 12% occupancy, potentially facing higher vacancy.
Average Monthly Occupancy Rate Trend in Rumassala
Average Daily Rate (ADR) Airbnb Trends in Rumassala (2026)
Effective short term rental pricing strategy in Rumassala involves understanding monthly ADR fluctuations. The Average Daily Rate (ADR) for Airbnb in Rumassala typically peaks in January and dips lowest during July. Leveraging Airbnb dynamic pricing tools or strategies based on this seasonality can significantly boost revenue. Here's a look at the typical nightly rates achieved:
- Best-in-class properties (Top 10%) command rates of $199+ per night, often due to premium features or locations.
- Strong performing properties (Top 25%) achieve nightly rates of $87 or more.
- Typical properties (Median) charge around $40 per night.
- Entry-level properties (Bottom 25%) earn around $27 per night.
Average Daily Rate (ADR) Trend by Month in Rumassala
Get Live Rumassala Market Intelligence 👇

Explore Real-time Analytics
Airbnb Seasonality Analysis & Trends in Rumassala (2026)
Peak Season (December, July, October)
- Revenue averages $1,813 per month
- Occupancy rates average 34.4%
- Daily rates average $91
Shoulder Season
- Revenue averages $1,585 per month
- Occupancy maintains around 34.1%
- Daily rates hold near $94
Low Season (May, August, November)
- Revenue drops to average $1,340 per month
- Occupancy decreases to average 27.8%
- Daily rates adjust to average $88
Seasonality Insights for Rumassala
- The Airbnb seasonality in Rumassala shows moderate seasonality with distinct peak and low periods. While the sections above show seasonal averages, it's also insightful to look at the extremes:
- During the high season, the absolute peak month showcases Rumassala's highest earning potential, with monthly revenues capable of climbing to $1,936, occupancy reaching a high of 45.8%, and ADRs peaking at $100.
- Conversely, the slowest single month of the year, typically falling within the low season, marks the market's lowest point. In this month, revenue might dip to $1,247, occupancy could drop to 20.3%, and ADRs may adjust down to $85.
- Understanding both the seasonal averages and these monthly peaks and troughs in revenue, occupancy, and ADR is crucial for maximizing your Airbnb profit potential in Rumassala.
Seasonal Strategies for Maximizing Profit
- Peak Season: Maximize revenue through premium pricing and potentially longer minimum stays. Ensure high availability.
- Low Season: Offer competitive pricing, special promotions (e.g., extended stay discounts), and flexible cancellation policies. Target off-season travelers like remote workers or budget-conscious guests.
- Shoulder Seasons: Implement dynamic pricing that balances peak and low rates. Target weekend travelers or specific events. Offer slightly more flexible terms than peak season.
- Regularly analyze your own performance against these Rumassala seasonality benchmarks and adjust your pricing and availability strategy accordingly.
Best Areas for Airbnb Investment in Rumassala (2026)
Exploring the top neighborhoods for short-term rentals in Rumassala? This section highlights key areas, outlining why they are attractive for hosts and guests, along with notable local attractions. Consider these locations based on your target guest profile and investment strategy.
| Neighborhood / Area | Why Host Here? (Target Guests & Appeal) | Key Attractions & Landmarks |
|---|---|---|
| Unawatuna | Famous for its beautiful beach and relaxed vibe, Unawatuna attracts tourists with its crystal-clear waters and excellent diving spots. | Unawatuna Beach, Diving and snorkeling spots, Japanese Peace Pagoda, Rumassala Sanctuary, Restaurants and cafes along the beach |
| Galle Fort | A UNESCO World Heritage site with historic architecture, Galle Fort is a popular destination for culture and history enthusiasts. | Galle Fort, Historic Dutch colonial buildings, National Maritime Museum, Galle Light House, Spice Market |
| Hikkaduwa | Known for its vibrant coral reefs and nightlife, Hikkaduwa is perfect for water sports enthusiasts and party-goers. | Hikkaduwa Beach, Coral reefs for snorkeling, Hikkaduwa National Park, Nightclubs and beach parties, Surfing spots |
| Mirissa | A great location for whale watching and beautiful beaches, Mirissa attracts nature lovers and couples seeking a romantic getaway. | Mirissa Beach, Whale watching tours, Coconut tree hill, Surfing spots, Local seafood restaurants |
| Talpe | A quieter alternative to Unawatuna, Talpe offers serene beaches and luxury villas, appealing to families and couples. | Talpe Beach, Luxury beachfront villas, Yoga retreats, Local cafes, Tranquil atmosphere |
| Koggala | Famous for its stunning lagoon and rich cultural heritage, Koggala is a peaceful destination with opportunities for water sports and cultural experiences. | Koggala Lake, Martin Wickramasinghe Museum, Stilt fishermen, Cultural village, beachfront relaxation |
| Weligama | Known for its surf breaks, Weligama attracts surfing enthusiasts and those wanting to experience the local culture. | Weligama Beach, Surf schools, Local fish market, Shopping, Small cafes |
| Benthota | With beautiful beaches and a range of water activities, Bentota is well-known for family-friendly vacations and relaxation. | Bentota Beach, Water sports center, Benthota River, Ayurvedic spas, Turtle hatchery |
Understanding Airbnb License Requirements & STR Laws in Rumassala (2026)
While Rumassala, Southern Province, Sri Lanka currently shows low STR regulations, specific Airbnb license requirements might still exist or change. Always verify the latest short term rental regulations and Airbnb license requirements directly with local government authorities for Rumassala to ensure full compliance before hosting.
(Source: AirROI data, 2026, based on 1% licensed listings)
Top Performing Airbnb Properties in Rumassala (2026)
Benchmark your potential! Explore examples of top-performing Airbnb properties in Rumassalabased on Trailing Twelve Month (TTM) revenue. Analyze their characteristics, revenue, occupancy rate, and ADR to understand what drives success in this market.
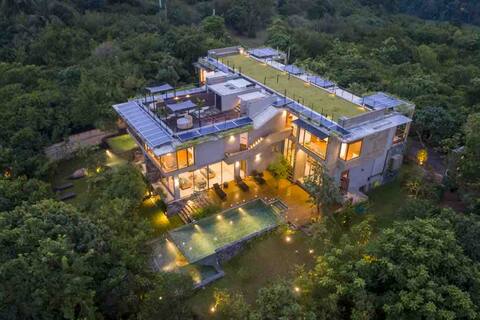
Buona Vista - Luxury Twin Villas Rummassala
Entire Place • 6 bedrooms
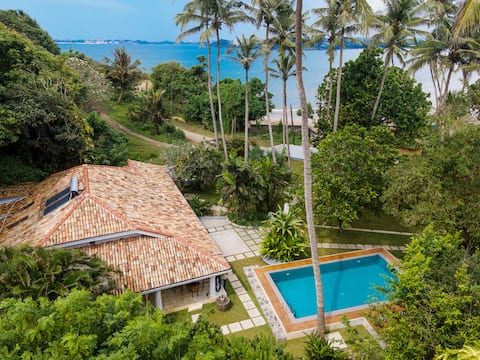
The Well House Galle
Entire Place • 4 bedrooms
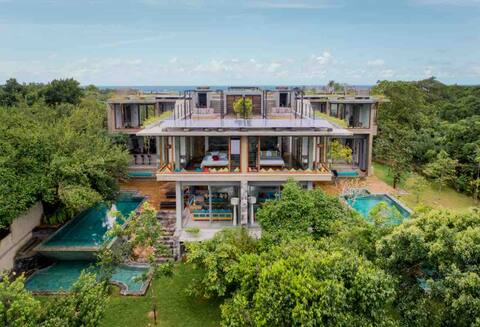
Buona Vista North -Luxury Villa on Rummassala Hill
Entire Place • 3 bedrooms

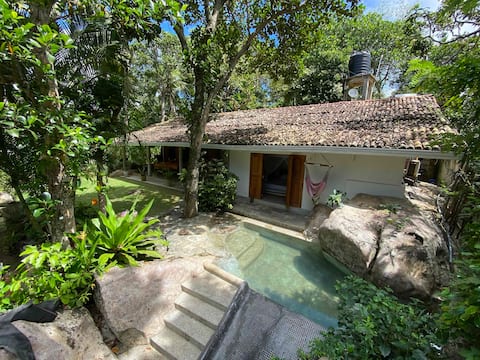
Good View South - Luxury Villa, Unwatuna, Galle
Entire Place • 3 bedrooms
Hanuman Hill House, Rumassala, Galle
Entire Place • 3 bedrooms

Treehouse with pool b/w Galle and Unawatuna Beach
Entire Place • 3 bedrooms
Note: Performance varies based on location, size, amenities, seasonality, and management quality. Data reflects the past 12 months.
Top Performing Airbnb Hosts in Rumassala (2026)
Learn from the best! This table showcases top-performing Airbnb hosts in Rumassala based on the number of properties managed and estimated total revenue over the past year. Analyze their scale and performance metrics.
| Host Name | Properties | Grossing Revenue | Stay Reviews | Avg Rating |
|---|---|---|---|---|
| Shafeena | 3 | $418,618 | 97 | 4.96/5.0 |
| The Well House Galle | 1 | $115,030 | 37 | 4.89/5.0 |
| Piers | 1 | $43,040 | 47 | 4.85/5.0 |
| Wasantha | 3 | $40,095 | 121 | 4.97/5.0 |
| Vincent | 1 | $37,977 | 361 | 4.78/5.0 |
| Rohan | 1 | $30,574 | 75 | 4.79/5.0 |
| Cecilia | 1 | $27,767 | 50 | 4.82/5.0 |
| Sashike | 1 | $26,911 | 35 | 4.89/5.0 |
| Mathish | 1 | $24,503 | 86 | 5.00/5.0 |
| Niluka | 1 | $22,908 | 14 | 5.00/5.0 |
Analyzing the strategies of top hosts, such as their property selection, pricing, and guest communication, can offer valuable lessons for optimizing your own Airbnb operations in Rumassala.
Dive Deeper: Advanced Rumassala STR Market Data (2026)
Ready to unlock more insights? AirROI provides access to advanced metrics and comprehensive Airbnb data for Rumassala. Explore detailed analytics beyond this report to refine your investment strategy, optimize pricing, and maximize your vacation rental profits.
Explore Advanced MetricsRumassala Short-Term Rental Market Composition (2026): Property & Room Types
Room Type Distribution
Property Type Distribution
Market Composition Insights for Rumassala
- The Rumassala Airbnb market composition is heavily skewed towards Private Room listings, which make up 52.6% of the 116 active rentals. This indicates strong guest preference for privacy and space.
- Looking at the property type distribution in Rumassala, House properties are the most common (39.7%), reflecting the local real estate landscape.
- Houses represent a significant 39.7% portion, catering likely to families or larger groups.
- The presence of 32.8% Hotel/Boutique listings indicates integration with traditional hospitality.
- Smaller segments like outdoor/unique, unique stays (combined 6.0%) offer potential for unique stay experiences.
Rumassala Airbnb Room Capacity Analysis (2026): Bedroom Distribution
Distribution of Listings by Number of Bedrooms
Room Capacity Insights for Rumassala
- The dominant room capacity in Rumassala is 1 bedroom listings, making up 44.8% of the market. This suggests a strong demand for properties suitable for couples or solo travelers.
- Together, 1 bedroom and 2 bedrooms properties represent 59.5% of the active Airbnb listings in Rumassala, indicating a high concentration in these sizes.
- A significant 20.7% of listings offer 3+ bedrooms, catering to larger groups and families seeking more space in Rumassala.
Rumassala Vacation Rental Guest Capacity Trends (2026)
Distribution of Listings by Guest Capacity
Guest Capacity Insights for Rumassala
- The most common guest capacity trend in Rumassala vacation rentals is listings accommodating 2 guests (37.9%). This suggests the primary traveler segment is likely couples or solo travelers.
- Properties designed for 2 guests and 4 guests dominate the Rumassala STR market, accounting for 50.0% of listings.
- 15.6% of properties accommodate 6+ guests, serving the market segment for larger families or group travel in Rumassala.
- On average, properties in Rumassala are equipped to host 2.8 guests.
Rumassala Airbnb Booking Patterns (2026): Available vs. Booked Days
Available Days Distribution
Booked Days Distribution
Booking Pattern Insights for Rumassala
- The most common availability pattern in Rumassala falls within the 271-366 days range, representing 78.4% of listings. This suggests many properties have significant open periods on their calendars.
- Approximately 93.9% of listings show high availability (181+ days open annually), indicating potential for increased bookings or specific owner usage patterns.
- For booked days, the 1-30 days range is most frequent in Rumassala (43.1%), reflecting common guest stay durations or potential owner blocking patterns.
- A notable 7.8% of properties secure long booking periods (181+ days booked per year), highlighting successful long-term rental strategies or significant owner usage.
Rumassala Airbnb Minimum Stay Requirements Analysis
Distribution of Listings by Minimum Night Requirement
1 Night
66 listings
56.9% of total
2 Nights
19 listings
16.4% of total
3 Nights
14 listings
12.1% of total
4-6 Nights
4 listings
3.4% of total
7-29 Nights
2 listings
1.7% of total
30+ Nights
11 listings
9.5% of total
Key Insights
- The most prevalent minimum stay requirement in Rumassala is 1 Night, adopted by 56.9% of listings. This highlights the market's preference for shorter, flexible bookings.
- A strong majority (73.3%) of the Rumassala Airbnb data shows acceptance of very short stays (1-2 nights), indicating a dynamic, high-turnover market.
Recommendations
- Align with the market by considering a 1 Night minimum stay, as 56.9% of Rumassala hosts use this setting.
- Explore offering discounts for stays of 30+ nights to attract the 9.5% of the market seeking extended stays.
- Adjust minimum nights based on seasonality – potentially shorter during low season and longer during peak demand periods in Rumassala.
Rumassala Airbnb Cancellation Policy Trends Analysis (2026)
Flexible
60 listings
51.7% of total
Moderate
22 listings
19% of total
Firm
29 listings
25% of total
Strict
5 listings
4.3% of total
Cancellation Policy Insights for Rumassala
- The prevailing Airbnb cancellation policy trend in Rumassala is Flexible, used by 51.7% of listings.
- The market strongly favors guest-friendly terms, with 70.7% of listings offering Flexible or Moderate policies. This suggests guests in Rumassala may expect booking flexibility.
- Strict cancellation policies are quite rare (4.3%), potentially making listings with this policy less competitive unless justified by high demand or property type.
Recommendations for Hosts
- Consider adopting a Flexible policy to align with the 51.7% market standard in Rumassala.
- Given the high prevalence of Flexible policies (51.7%), offering this can enhance booking appeal, especially during shoulder seasons.
- Using a Strict policy might deter some guests, as only 4.3% of listings use it. Evaluate if potential revenue protection outweighs possible lower booking rates.
- Regularly review your cancellation policy against competitors and market demand shifts in Rumassala.
Rumassala STR Booking Lead Time Analysis (2026)
Average Booking Lead Time by Month
Booking Lead Time Insights for Rumassala
- The overall average booking lead time for vacation rentals in Rumassala is 50 days.
- Guests book furthest in advance for stays during January (average 69 days), likely coinciding with peak travel demand or local events.
- The shortest booking windows occur for stays in June (average 24 days), indicating more last-minute travel plans during this time.
- Seasonally, Winter (60 days avg.) sees the longest lead times, while Spring (32 days avg.) has the shortest, reflecting typical travel planning cycles.
Recommendations for Hosts
- Use the overall average lead time (50 days) as a baseline for your pricing and availability strategy in Rumassala.
- For January stays, consider implementing length-of-stay discounts or slightly higher rates for bookings made less than 69 days out to capitalize on advance planning.
- Target marketing efforts for the Winter season well in advance (at least 60 days) to capture early planners.
- Monitor your own booking lead times against these Rumassala averages to identify opportunities for dynamic pricing adjustments.
Popular & Essential Airbnb Amenities in Rumassala (2026)
Amenity Prevalence
Amenity Insights for Rumassala
- Essential amenities in Rumassala that guests expect include: Wifi. Lacking these (this) could significantly impact bookings.
- Popular amenities like Free parking on premises, Air conditioning, Essentials are common but not universal. Offering these can provide a competitive edge.
Recommendations for Hosts
- Ensure your listing includes all essential amenities for Rumassala: Wifi.
- Consider adding popular differentiators like Free parking on premises or Air conditioning to increase appeal.
- Highlight unique or less common amenities you offer (e.g., hot tub, dedicated workspace, EV charger) in your listing description and photos.
- Regularly check competitor amenities in Rumassala to stay competitive.
Rumassala Airbnb Guest Demographics & Profile Analysis (2026)
Guest Profile Summary for Rumassala
- The typical guest profile for Airbnb in Rumassala consists of predominantly international visitors (99%), with top international origins including Germany, typically belonging to the Post-2000s (Gen Z/Alpha) group (50%), primarily speaking English or German.
- Domestic travelers account for 0.6% of guests.
- Key international markets include United Kingdom (22.4%) and Germany (20.7%).
- Top languages spoken are English (45.4%) followed by German (14%).
- A significant demographic segment is the Post-2000s (Gen Z/Alpha) group, representing 50% of guests.
Recommendations for Hosts
- Focus marketing internationally, particularly towards travelers from Germany.
- Tailor amenities and listing descriptions to appeal to the dominant Post-2000s (Gen Z/Alpha) demographic (e.g., highlight fast WiFi, smart home features, local guides).
- Highlight unique local experiences or amenities relevant to the primary guest profile.
- Consider seasonal promotions aligned with peak travel times for key origin markets.
Nearby Short-Term Rental Market Comparison
How does the Rumassala Airbnb market stack up against its neighbors? Compare key performance metrics like average monthly revenue, ADR, and occupancy rates in surrounding areas to understand the broader regional STR landscape.
| Market | Active Properties | Monthly Revenue | Daily Rate | Avg. Occupancy |
|---|---|---|---|---|
| Mawella | 11 | $3,262 | $224.29 | 47% |
| Kathaluwa | 52 | $2,212 | $323.85 | 34% |
| Kamburugamuwa | 16 | $2,146 | $275.05 | 30% |
| Goviyapana | 44 | $2,113 | $186.36 | 46% |
| Walgama | 70 | $2,110 | $146.13 | 45% |
| Ranna | 11 | $1,890 | $199.03 | 27% |
| Talpe | 110 | $1,827 | $283.70 | 32% |
| Induruwa | 16 | $1,777 | $303.52 | 29% |
| Madampagama | 25 | $1,771 | $237.65 | 39% |
| Olaganduwa | 11 | $1,699 | $200.88 | 41% |