Santa Cristina d'Aro Airbnb Market Analysis 2026: Short Term Rental Data & Vacation Rental Statistics in Catalonia, Spain
Is Airbnb profitable in Santa Cristina d'Aro in 2026? Explore comprehensive Airbnb analytics for Santa Cristina d'Aro, Catalonia, Spain to uncover income potential. This 2026 STR market report for Santa Cristina d'Aro, based on AirROI data from February 2025 to January 2026, reveals key trends in the niche market of 133 active listings.
Whether you're considering an Airbnb investment in Santa Cristina d'Aro, optimizing your existing vacation rental, or exploring rental arbitrage opportunities, understanding the Santa Cristina d'Aro Airbnb data is crucial. Navigating the high regulation landscape is key to maximizing your short term rental income potential. Let's dive into the specifics.
Key Santa Cristina d'Aro Airbnb Performance Metrics Overview
Monthly Airbnb Revenue Variations & Income Potential in Santa Cristina d'Aro (2026)
Understanding the monthly revenue variations for Airbnb listings in Santa Cristina d'Aro is key to maximizing your short term rental income potential. Seasonality significantly impacts earnings. Our analysis, based on data from the past 12 months, shows that the peak revenue month for STRs in Santa Cristina d'Aro is typically August, while January often presents the lowest earnings, highlighting opportunities for strategic pricing adjustments during shoulder and low seasons. Explore the typical Airbnb income in Santa Cristina d'Aro across different performance tiers:
- Best-in-class properties (Top 10%) achieve $6,980+ monthly, often utilizing dynamic pricing and superior guest experiences.
- Strong performing properties (Top 25%) earn $4,005 or more, indicating effective management and desirable locations/amenities.
- Typical properties (Median) generate around $2,013 per month, representing the average market performance.
- Entry-level properties (Bottom 25%) see earnings around $956, often with potential for optimization.
Average Monthly Airbnb Earnings Trend in Santa Cristina d'Aro
Santa Cristina d'Aro Airbnb Occupancy Rate Trends (2026)
Maximize your bookings by understanding the Santa Cristina d'Aro STR occupancy trends. Seasonal demand shifts significantly influence how often properties are booked. Typically, Augustsees the highest demand (peak season occupancy), while January experiences the lowest (low season). Effective strategies, like adjusting minimum stays or offering promotions, can boost occupancy during slower periods. Here's how different property tiers perform in Santa Cristina d'Aro:
- Best-in-class properties (Top 10%) achieve 73%+ occupancy, indicating high desirability and potentially optimized availability.
- Strong performing properties (Top 25%) maintain 53% or higher occupancy, suggesting good market fit and guest satisfaction.
- Typical properties (Median) have an occupancy rate around 32%.
- Entry-level properties (Bottom 25%) average 14% occupancy, potentially facing higher vacancy.
Average Monthly Occupancy Rate Trend in Santa Cristina d'Aro
Average Daily Rate (ADR) Airbnb Trends in Santa Cristina d'Aro (2026)
Effective short term rental pricing strategy in Santa Cristina d'Aro involves understanding monthly ADR fluctuations. The Average Daily Rate (ADR) for Airbnb in Santa Cristina d'Aro typically peaks in August and dips lowest during February. Leveraging Airbnb dynamic pricing tools or strategies based on this seasonality can significantly boost revenue. Here's a look at the typical nightly rates achieved:
- Best-in-class properties (Top 10%) command rates of $638+ per night, often due to premium features or locations.
- Strong performing properties (Top 25%) achieve nightly rates of $401 or more.
- Typical properties (Median) charge around $250 per night.
- Entry-level properties (Bottom 25%) earn around $144 per night.
Average Daily Rate (ADR) Trend by Month in Santa Cristina d'Aro
Get Live Santa Cristina d'Aro Market Intelligence 👇

Explore Real-time Analytics
Airbnb Seasonality Analysis & Trends in Santa Cristina d'Aro (2026)
Peak Season (August, July, June)
- Revenue averages $5,785 per month
- Occupancy rates average 50.7%
- Daily rates average $363
Shoulder Season
- Revenue averages $2,800 per month
- Occupancy maintains around 35.4%
- Daily rates hold near $314
Low Season (January, February, November)
- Revenue drops to average $1,558 per month
- Occupancy decreases to average 21.8%
- Daily rates adjust to average $305
Seasonality Insights for Santa Cristina d'Aro
- The Airbnb seasonality in Santa Cristina d'Aro shows highly seasonal trends requiring careful strategy. While the sections above show seasonal averages, it's also insightful to look at the extremes:
- During the high season, the absolute peak month showcases Santa Cristina d'Aro's highest earning potential, with monthly revenues capable of climbing to $7,709, occupancy reaching a high of 60.6%, and ADRs peaking at $375.
- Conversely, the slowest single month of the year, typically falling within the low season, marks the market's lowest point. In this month, revenue might dip to $1,152, occupancy could drop to 12.7%, and ADRs may adjust down to $297.
- Understanding both the seasonal averages and these monthly peaks and troughs in revenue, occupancy, and ADR is crucial for maximizing your Airbnb profit potential in Santa Cristina d'Aro.
Seasonal Strategies for Maximizing Profit
- Peak Season: Maximize revenue through premium pricing and potentially longer minimum stays. Ensure high availability.
- Low Season: Offer competitive pricing, special promotions (e.g., extended stay discounts), and flexible cancellation policies. Target off-season travelers like remote workers or budget-conscious guests.
- Shoulder Seasons: Implement dynamic pricing that balances peak and low rates. Target weekend travelers or specific events. Offer slightly more flexible terms than peak season.
- Regularly analyze your own performance against these Santa Cristina d'Aro seasonality benchmarks and adjust your pricing and availability strategy accordingly.
Best Areas for Airbnb Investment in Santa Cristina d'Aro (2026)
Exploring the top neighborhoods for short-term rentals in Santa Cristina d'Aro? This section highlights key areas, outlining why they are attractive for hosts and guests, along with notable local attractions. Consider these locations based on your target guest profile and investment strategy.
| Neighborhood / Area | Why Host Here? (Target Guests & Appeal) | Key Attractions & Landmarks |
|---|---|---|
| Platja d'Aro | A bustling beach resort town known for its nightlife, shopping, and beautiful beaches. It's a favorite among tourists and families in the summer, making it a prime area for short-term rentals. | Cala del Pi, Aquadiver Water Park, Phare de Platja d'Aro, Shopping avenues, Coves de l'Ermita |
| Sant Antoni de Calonge | A charming coastal town that attracts visitors for its quiet beaches and picturesque views. Its proximity to Platja d'Aro also makes it attractive to tourists looking for a more relaxed environment. | Playa de Sant Antoni, La Platja de Torre Valentina, Castell de Calonge, Calonge Castle, Vistas de la Costa Brava |
| S'Agaró | Famous for its luxurious residential area and beautiful coves, S'Agaró is a tranquil spot that appeals to discerning travelers and families seeking relaxation by the sea. | Cala de Sa Conca, Cala de Roques Planes, S'Agaró Beach, Promenade of S'Agaró, Platja de Sant Pol |
| Castell-Platja d'Aro | A popular seaside destination that boasts a vibrant atmosphere with plenty of entertainment options. Its central location makes it convenient for exploring the Costa Brava. | Cala Rovira, Cala del Senyor Ramon, Cala dels Canyers, Festival of Sant Joan, Local markets and festivals |
| Cala de Salgar | Known for its stunning views and secluded beach experience, this area attracts nature lovers and those looking for a peaceful getaway amidst picturesque surroundings. | Cala de Salgar Beach, Hiking trails along the coast, Nature reserves, Sunset viewpoints, Photography spots |
| Santa Cristina Beach | This area offers beautiful sandy beaches and calm waters. It’s a great spot for families and water sports enthusiasts, as well as for those looking to unwind. | Santa Cristina Beach, Dona Marinera statue, Boat rentals, Beachside restaurants, Water sports |
| Llagostera | A charming inland town offering a glimpse of Catalan culture away from the coastal hustle. It attracts visitors interested in local cuisine and traditions. | Historical town center, Church of Sant Esteve, El Puig de les Cadiretes, Hiking nearby, Local festivals and events |
| Tossa de Mar | While a bit further away, this iconic medieval town with its castle attracts many tourists. It is ideal for those who want a historical experience along with beach time. | Castillo de Tossa de Mar, Old Town (Vila Vella), Cala Pola, Tossa de Mar Beach, Coastal walks and trails |
Understanding Airbnb License Requirements & STR Laws in Santa Cristina d'Aro (2026)
Yes, Santa Cristina d'Aro, Catalonia, Spain enforces high STR regulations. Obtaining a license and ensuring compliance is almost certainly required according to current 2026 STR laws. Always verify the latest short term rental regulations and Airbnb license requirements directly with local government authorities for Santa Cristina d'Aro to ensure full compliance before hosting.
(Source: AirROI data, 2026, based on 78% licensed listings)
Top Performing Airbnb Properties in Santa Cristina d'Aro (2026)
Benchmark your potential! Explore examples of top-performing Airbnb properties in Santa Cristina d'Arobased on Trailing Twelve Month (TTM) revenue. Analyze their characteristics, revenue, occupancy rate, and ADR to understand what drives success in this market.

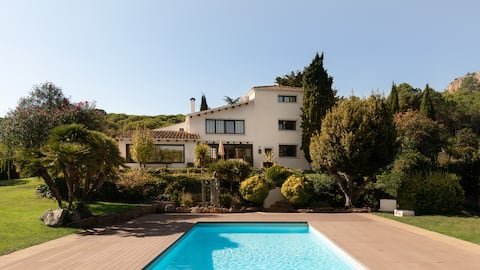
Finca Mas Bou
Entire Place • 9 bedrooms
Villa Roca Rodona
Entire Place • 8 bedrooms

White House Costa Brava
Entire Place • 8 bedrooms
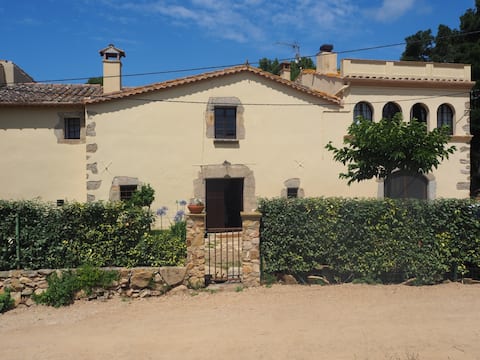
Host&Joy - Beautiful Country House Can Pitu
Entire Place • 7 bedrooms

The Villa of the Seas
Entire Place • 3 bedrooms
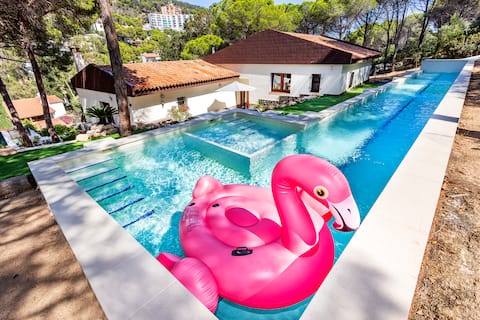
Luxury private Villa: 25m Pool, Gym, 200m to Beach
Entire Place • 5 bedrooms
Note: Performance varies based on location, size, amenities, seasonality, and management quality. Data reflects the past 12 months.
Top Performing Airbnb Hosts in Santa Cristina d'Aro (2026)
Learn from the best! This table showcases top-performing Airbnb hosts in Santa Cristina d'Aro based on the number of properties managed and estimated total revenue over the past year. Analyze their scale and performance metrics.
| Host Name | Properties | Grossing Revenue | Stay Reviews | Avg Rating |
|---|---|---|---|---|
| Anna | 2 | $285,107 | 107 | 4.93/5.0 |
| Borja | 1 | $207,356 | 8 | 5.00/5.0 |
| Costa Brava Si | 14 | $149,252 | 67 | 4.54/5.0 |
| Nadia - Interhome | 4 | $115,507 | 12 | 4.24/5.0 |
| Michael William | 1 | $100,383 | 10 | 5.00/5.0 |
| Stefan By HostandJoy.Com | 2 | $96,113 | 43 | 4.79/5.0 |
| Marcos | 1 | $82,988 | 109 | 4.79/5.0 |
| Gerald | 1 | $73,568 | 23 | 4.78/5.0 |
| RVHotels Golf Costa Brava | 10 | $73,087 | 56 | 4.41/5.0 |
| Quality Estates | 3 | $71,794 | 22 | 4.94/5.0 |
Analyzing the strategies of top hosts, such as their property selection, pricing, and guest communication, can offer valuable lessons for optimizing your own Airbnb operations in Santa Cristina d'Aro.
Dive Deeper: Advanced Santa Cristina d'Aro STR Market Data (2026)
Ready to unlock more insights? AirROI provides access to advanced metrics and comprehensive Airbnb data for Santa Cristina d'Aro. Explore detailed analytics beyond this report to refine your investment strategy, optimize pricing, and maximize your vacation rental profits.
Explore Advanced MetricsSanta Cristina d'Aro Short-Term Rental Market Composition (2026): Property & Room Types
Room Type Distribution
Property Type Distribution
Market Composition Insights for Santa Cristina d'Aro
- The Santa Cristina d'Aro Airbnb market composition is heavily skewed towards Entire Home/Apt listings, which make up 89.5% of the 133 active rentals. This indicates strong guest preference for privacy and space.
- Looking at the property type distribution in Santa Cristina d'Aro, House properties are the most common (66.2%), reflecting the local real estate landscape.
- Houses represent a significant 66.2% portion, catering likely to families or larger groups.
- The presence of 11.3% Hotel/Boutique listings indicates integration with traditional hospitality.
- Smaller segments like others (combined 0.8%) offer potential for unique stay experiences.
Santa Cristina d'Aro Airbnb Room Capacity Analysis (2026): Bedroom Distribution
Distribution of Listings by Number of Bedrooms
Room Capacity Insights for Santa Cristina d'Aro
- The dominant room capacity in Santa Cristina d'Aro is 3 bedrooms listings, making up 26.3% of the market. This suggests a strong demand for properties suitable for families or small groups.
- Together, 3 bedrooms and 2 bedrooms properties represent 47.4% of the active Airbnb listings in Santa Cristina d'Aro, indicating a high concentration in these sizes.
- A significant 58.6% of listings offer 3+ bedrooms, catering to larger groups and families seeking more space in Santa Cristina d'Aro.
Santa Cristina d'Aro Vacation Rental Guest Capacity Trends (2026)
Distribution of Listings by Guest Capacity
Guest Capacity Insights for Santa Cristina d'Aro
- The most common guest capacity trend in Santa Cristina d'Aro vacation rentals is listings accommodating 8+ guests (33.1%). This suggests the primary traveler segment is likely larger groups.
- Properties designed for 8+ guests and 6 guests dominate the Santa Cristina d'Aro STR market, accounting for 57.9% of listings.
- 60.2% of properties accommodate 6+ guests, serving the market segment for larger families or group travel in Santa Cristina d'Aro.
- On average, properties in Santa Cristina d'Aro are equipped to host 5.5 guests.
Santa Cristina d'Aro Airbnb Booking Patterns (2026): Available vs. Booked Days
Available Days Distribution
Booked Days Distribution
Booking Pattern Insights for Santa Cristina d'Aro
- The most common availability pattern in Santa Cristina d'Aro falls within the 271-366 days range, representing 69.2% of listings. This suggests many properties have significant open periods on their calendars.
- Approximately 95.5% of listings show high availability (181+ days open annually), indicating potential for increased bookings or specific owner usage patterns.
- For booked days, the 31-90 days range is most frequent in Santa Cristina d'Aro (42.1%), reflecting common guest stay durations or potential owner blocking patterns.
- A notable 5.3% of properties secure long booking periods (181+ days booked per year), highlighting successful long-term rental strategies or significant owner usage.
Santa Cristina d'Aro Airbnb Minimum Stay Requirements Analysis
Distribution of Listings by Minimum Night Requirement
1 Night
27 listings
20.3% of total
2 Nights
1 listings
0.8% of total
3 Nights
6 listings
4.5% of total
4-6 Nights
29 listings
21.8% of total
7-29 Nights
15 listings
11.3% of total
30+ Nights
55 listings
41.4% of total
Key Insights
- The most prevalent minimum stay requirement in Santa Cristina d'Aro is 30+ Nights, adopted by 41.4% of listings. This highlights the market's preference for longer commitments.
- A significant segment (41.4%) caters to monthly stays (30+ nights) in Santa Cristina d'Aro, pointing to opportunities in the extended-stay market.
Recommendations
- Align with the market by considering a 30+ Nights minimum stay, as 41.4% of Santa Cristina d'Aro hosts use this setting.
- If feasible, allowing 1-night stays, especially midweek or during low season, could capture last-minute bookings, as only 20.3% currently do.
- Explore offering discounts for stays of 30+ nights to attract the 41.4% of the market seeking extended stays.
- Adjust minimum nights based on seasonality – potentially shorter during low season and longer during peak demand periods in Santa Cristina d'Aro.
Santa Cristina d'Aro Airbnb Cancellation Policy Trends Analysis (2026)
Super Strict 30 Days
3 listings
2.3% of total
Super Strict 60 Days
4 listings
3% of total
Limited
1 listings
0.8% of total
Flexible
9 listings
6.8% of total
Moderate
34 listings
25.6% of total
Firm
46 listings
34.6% of total
Strict
36 listings
27.1% of total
Cancellation Policy Insights for Santa Cristina d'Aro
- The prevailing Airbnb cancellation policy trend in Santa Cristina d'Aro is Firm, used by 34.6% of listings.
- A majority (61.7%) of hosts in Santa Cristina d'Aro utilize Firm or Strict policies, indicating a market where hosts prioritize booking security.
Recommendations for Hosts
- Consider adopting a Firm policy to align with the 34.6% market standard in Santa Cristina d'Aro.
- Regularly review your cancellation policy against competitors and market demand shifts in Santa Cristina d'Aro.
Santa Cristina d'Aro STR Booking Lead Time Analysis (2026)
Average Booking Lead Time by Month
Booking Lead Time Insights for Santa Cristina d'Aro
- The overall average booking lead time for vacation rentals in Santa Cristina d'Aro is 65 days.
- Guests book furthest in advance for stays during August (average 100 days), likely coinciding with peak travel demand or local events.
- The shortest booking windows occur for stays in November (average 22 days), indicating more last-minute travel plans during this time.
- Seasonally, Summer (82 days avg.) sees the longest lead times, while Winter (36 days avg.) has the shortest, reflecting typical travel planning cycles.
Recommendations for Hosts
- Use the overall average lead time (65 days) as a baseline for your pricing and availability strategy in Santa Cristina d'Aro.
- For August stays, consider implementing length-of-stay discounts or slightly higher rates for bookings made less than 100 days out to capitalize on advance planning.
- Target marketing efforts for the Summer season well in advance (at least 82 days) to capture early planners.
- Monitor your own booking lead times against these Santa Cristina d'Aro averages to identify opportunities for dynamic pricing adjustments.
Popular & Essential Airbnb Amenities in Santa Cristina d'Aro (2026)
Amenity Prevalence
Amenity Insights for Santa Cristina d'Aro
- Popular amenities like TV, Wifi, Kitchen are common but not universal. Offering these can provide a competitive edge.
- Warning: Wifi is not universally provided but is considered essential globally. Ensure reliable Wifi is offered.
Recommendations for Hosts
- Consider adding popular differentiators like TV or Wifi to increase appeal.
- Highlight unique or less common amenities you offer (e.g., hot tub, dedicated workspace, EV charger) in your listing description and photos.
- Regularly check competitor amenities in Santa Cristina d'Aro to stay competitive.
Santa Cristina d'Aro Airbnb Guest Demographics & Profile Analysis (2026)
Guest Profile Summary for Santa Cristina d'Aro
- The typical guest profile for Airbnb in Santa Cristina d'Aro consists of predominantly international visitors (75%), with top international origins including Spain, typically belonging to the Post-2000s (Gen Z/Alpha) group (50%), primarily speaking English or French.
- Domestic travelers account for 25.3% of guests.
- Key international markets include France (33.8%) and Spain (25.3%).
- Top languages spoken are English (33.8%) followed by French (19.9%).
- A significant demographic segment is the Post-2000s (Gen Z/Alpha) group, representing 50% of guests.
Recommendations for Hosts
- Focus marketing internationally, particularly towards travelers from Spain.
- Tailor amenities and listing descriptions to appeal to the dominant Post-2000s (Gen Z/Alpha) demographic (e.g., highlight fast WiFi, smart home features, local guides).
- Highlight unique local experiences or amenities relevant to the primary guest profile.
- Consider seasonal promotions aligned with peak travel times for key origin markets.
Nearby Short-Term Rental Market Comparison
How does the Santa Cristina d'Aro Airbnb market stack up against its neighbors? Compare key performance metrics like average monthly revenue, ADR, and occupancy rates in surrounding areas to understand the broader regional STR landscape.
| Market | Active Properties | Monthly Revenue | Daily Rate | Avg. Occupancy |
|---|---|---|---|---|
| Vall-llobrega | 18 | $10,253 | $778.88 | 45% |
| Canyelles | 47 | $7,127 | $1152.36 | 35% |
| Cornellà del Terri | 15 | $6,458 | $584.61 | 40% |
| Vallirana | 10 | $5,639 | $350.46 | 57% |
| Tiana | 15 | $5,135 | $362.37 | 45% |
| Sant Vicenç de Montalt | 40 | $5,005 | $422.72 | 39% |
| Amer | 11 | $4,949 | $462.57 | 38% |
| Sant Andreu de Llavaneres | 45 | $4,931 | $450.05 | 41% |
| Teià | 25 | $4,821 | $394.46 | 40% |
| Premià de Dalt | 31 | $4,548 | $337.99 | 47% |