Seojong Airbnb Market Analysis 2025: Short Term Rental Data & Vacation Rental Statistics in Yangpyeong-gun, South Korea
Is Airbnb profitable in Seojong in 2025? Explore comprehensive Airbnb analytics for Seojong, Yangpyeong-gun, South Korea to uncover income potential. This 2025 STR market report for Seojong, based on AirROI data from November 2024 to October 2025, reveals key trends in the niche market of 18 active listings.
Whether you're considering an Airbnb investment in Seojong, optimizing your existing vacation rental, or exploring rental arbitrage opportunities, understanding the Seojong Airbnb data is crucial. Navigating the high regulation landscape is key to maximizing your short term rental income potential. Let's dive into the specifics.
Key Seojong Airbnb Performance Metrics Overview
Monthly Airbnb Revenue Variations & Income Potential in Seojong (2025)
Understanding the monthly revenue variations for Airbnb listings in Seojong is key to maximizing your short term rental income potential. Seasonality significantly impacts earnings. Our analysis, based on data from the past 12 months, shows that the peak revenue month for STRs in Seojong is typically August, while September often presents the lowest earnings, highlighting opportunities for strategic pricing adjustments during shoulder and low seasons. Explore the typical Airbnb income in Seojong across different performance tiers:
- Best-in-class properties (Top 10%) achieve $3,043+ monthly, often utilizing dynamic pricing and superior guest experiences.
- Strong performing properties (Top 25%) earn $1,985 or more, indicating effective management and desirable locations/amenities.
- Typical properties (Median) generate around $1,070 per month, representing the average market performance.
- Entry-level properties (Bottom 25%) see earnings around $507, often with potential for optimization.
Average Monthly Airbnb Earnings Trend in Seojong
Seojong Airbnb Occupancy Rate Trends (2025)
Maximize your bookings by understanding the Seojong STR occupancy trends. Seasonal demand shifts significantly influence how often properties are booked. Typically, Augustsees the highest demand (peak season occupancy), while March experiences the lowest (low season). Effective strategies, like adjusting minimum stays or offering promotions, can boost occupancy during slower periods. Here's how different property tiers perform in Seojong:
- Best-in-class properties (Top 10%) achieve 48%+ occupancy, indicating high desirability and potentially optimized availability.
- Strong performing properties (Top 25%) maintain 30% or higher occupancy, suggesting good market fit and guest satisfaction.
- Typical properties (Median) have an occupancy rate around 18%.
- Entry-level properties (Bottom 25%) average 9% occupancy, potentially facing higher vacancy.
Average Monthly Occupancy Rate Trend in Seojong
Average Daily Rate (ADR) Airbnb Trends in Seojong (2025)
Effective short term rental pricing strategy in Seojong involves understanding monthly ADR fluctuations. The Average Daily Rate (ADR) for Airbnb in Seojong typically peaks in August and dips lowest during April. Leveraging Airbnb dynamic pricing tools or strategies based on this seasonality can significantly boost revenue. Here's a look at the typical nightly rates achieved:
- Best-in-class properties (Top 10%) command rates of $294+ per night, often due to premium features or locations.
- Strong performing properties (Top 25%) achieve nightly rates of $247 or more.
- Typical properties (Median) charge around $194 per night.
- Entry-level properties (Bottom 25%) earn around $124 per night.
Average Daily Rate (ADR) Trend by Month in Seojong
Get Live Seojong Market Intelligence 👇

Explore Real-time Analytics
Airbnb Seasonality Analysis & Trends in Seojong (2025)
Peak Season (August, December, May)
- Revenue averages $1,824 per month
- Occupancy rates average 28.6%
- Daily rates average $209
Shoulder Season
- Revenue averages $1,443 per month
- Occupancy maintains around 21.9%
- Daily rates hold near $200
Low Season (June, September, November)
- Revenue drops to average $1,200 per month
- Occupancy decreases to average 21.3%
- Daily rates adjust to average $202
Seasonality Insights for Seojong
- The Airbnb seasonality in Seojong shows moderate seasonality with distinct peak and low periods. While the sections above show seasonal averages, it's also insightful to look at the extremes:
- During the high season, the absolute peak month showcases Seojong's highest earning potential, with monthly revenues capable of climbing to $1,977, occupancy reaching a high of 30.6%, and ADRs peaking at $216.
- Conversely, the slowest single month of the year, typically falling within the low season, marks the market's lowest point. In this month, revenue might dip to $1,102, occupancy could drop to 15.6%, and ADRs may adjust down to $190.
- Understanding both the seasonal averages and these monthly peaks and troughs in revenue, occupancy, and ADR is crucial for maximizing your Airbnb profit potential in Seojong.
Seasonal Strategies for Maximizing Profit
- Peak Season: Maximize revenue through premium pricing and potentially longer minimum stays. Ensure high availability.
- Low Season: Offer competitive pricing, special promotions (e.g., extended stay discounts), and flexible cancellation policies. Target off-season travelers like remote workers or budget-conscious guests.
- Shoulder Seasons: Implement dynamic pricing that balances peak and low rates. Target weekend travelers or specific events. Offer slightly more flexible terms than peak season.
- Regularly analyze your own performance against these Seojong seasonality benchmarks and adjust your pricing and availability strategy accordingly.
Best Areas for Airbnb Investment in Seojong (2025)
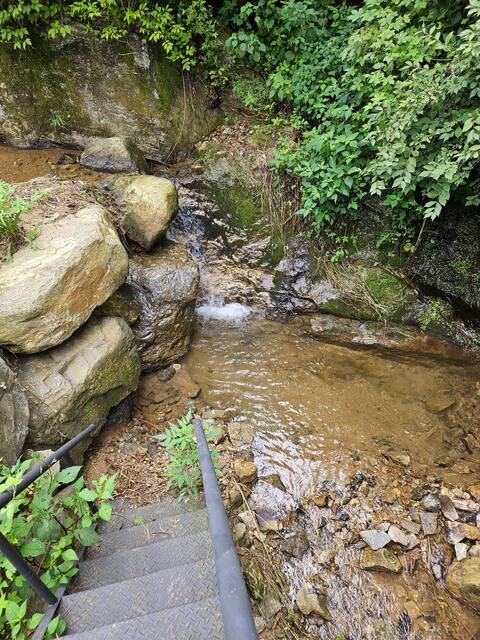
Exploring the top neighborhoods for short-term rentals in Seojong? This section highlights key areas, outlining why they are attractive for hosts and guests, along with notable local attractions. Consider these locations based on your target guest profile and investment strategy.
| Neighborhood / Area | Why Host Here? (Target Guests & Appeal) | Key Attractions & Landmarks |
|---|---|---|
| Yangpyeong | A popular location for its beautiful natural surroundings and accessibility from Seoul. Offers a serene escape from city life, attracting tourists looking for relaxation and outdoor activities. | Dumulmeori, Yangpyeong Rail Bike, Hongjeongkyo Bridge, Sanghwangsa Temple, Yangpyeong Traditional Market |
| Yongmun | Known for its concentrated attractions such as the Yongmun Resort and the Han River. Great for family-friendly activities and outdoor adventures, making it appealing to vacationers. | Yongmun Resort, Han River, Yongmunsa Temple, Inwangsan Mountain, Chungnyeongsan Mountain |
| Jungwon | A tranquil district that offers a mix of rural charm and access to the scenic Namhangang River. It attracts travelers who enjoy nature and peace. | Namhangang River, Jungwon Nature Recreation Forest, Paldang Lake, Jungwon Scenic Area, Local farms |
| Mongchontoseong | This area is rich in history and culture, featuring the ancient Mongchontoseong Fortress. It appeals to history buffs and those interested in Korean heritage. | Mongchontoseong Fortress, Seoul Forest, Local cultural festivals, Ancient tombs, Historic sites |
| Cheongpyeong | Famous for its panoramic views and leisure activities, Cheongpyeong is an ideal getaway for those who love water sports and hiking. | Cheongpyeong Lake, Namiseom Island, Changgyeong Palace, Local hiking trails, Water sports activities |
| Osong | An emerging area with growing popularity, offers a balance of residential comfort and proximity to urban amenities. Ideal for short-term rentals and business travelers. | Osong Station, Local shopping centers, Cafes and restaurants, Nearby parks, Cultural attractions |
| Seojae | Very close to famous natural parks and outdoor activities, attracting tourists who are looking for an adventurous getaway. | Natural parks, Hiking trails, Local farms, Cafes, Cultural experiences |
| Yeoju | Located nearby, Yeoju is famous for its historical sites and beautiful landscapes. It offers a blend of culture and relaxation for tourists. | Yeoju Premium Outlets, Historic sites, Natural scenery, Local artisan markets, Cultural events |
Understanding Airbnb License Requirements & STR Laws in Seojong (2025)
Yes, Seojong, Yangpyeong-gun, South Korea enforces high STR regulations. Obtaining a license and ensuring compliance is almost certainly required according to current 2025 STR laws. Always verify the latest short term rental regulations and Airbnb license requirements directly with local government authorities for Seojong to ensure full compliance before hosting.
(Source: AirROI data, 2025, based on 61% licensed listings)
Top Performing Airbnb Properties in Seojong (2025)
Benchmark your potential! Explore examples of top-performing Airbnb properties in Seojongbased on Trailing Twelve Month (TTM) revenue. Analyze their characteristics, revenue, occupancy rate, and ADR to understand what drives success in this market.

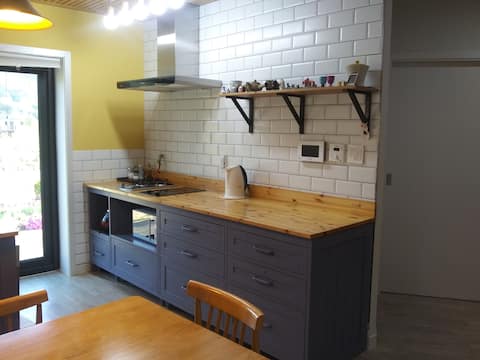
Nolgejeonwon Gamjeong Accommodation VR, Nintendo, Karaoke, Beam Cinema, Bulmung, Bajji Affiliate
Entire Place • 3 bedrooms

Nordic A-frame House-Asgard Private Pool Villa-Dog Friendly. Warm water, free barbecue
Entire Place • 1 bedroom
Workshop # Dog-friendly # Party Room # Family Event # Space for 8-30 people
Entire Place • 2 bedrooms
#Homestay in Jeongbae #Private house #Beam projector # Quiet trip
Entire Place • 3 bedrooms
![[Jeongbaeri Bali] A place for one team for a day](https://a0.muscache.com/im/pictures/hosting/Hosting-22755787/original/c8df4ab7-bd81-4c7b-8299-e61c8136b6bc.jpeg?im_w=480&im_format=avif)
[Jeongbaeri Bali] A place for one team for a day
Entire Place • 2 bedrooms

Forest relaxation, fire pit, and barbecue, Ravian
Entire Place • 3 bedrooms
Note: Performance varies based on location, size, amenities, seasonality, and management quality. Data reflects the past 12 months.
Top Performing Airbnb Hosts in Seojong (2025)
Learn from the best! This table showcases top-performing Airbnb hosts in Seojong based on the number of properties managed and estimated total revenue over the past year. Analyze their scale and performance metrics.
| Host Name | Properties | Grossing Revenue | Stay Reviews | Avg Rating |
|---|---|---|---|---|
| 시형 | 2 | $66,533 | 522 | 4.94/5.0 |
| Boss | 3 | $53,491 | 96 | 4.91/5.0 |
| 윤주 | 2 | $29,057 | 314 | 4.76/5.0 |
| 선경 | 1 | $24,585 | 25 | 4.64/5.0 |
| Jade | 1 | $24,286 | 104 | 4.90/5.0 |
| 정희 | 2 | $20,957 | 47 | 4.71/5.0 |
| 기연 | 4 | $12,913 | 97 | 4.92/5.0 |
| Freena | 1 | $12,622 | 1 | Not Rated |
| 연숙 | 1 | $1,489 | 49 | 4.84/5.0 |
| 지현 | 1 | $1,099 | 6 | 4.83/5.0 |
Analyzing the strategies of top hosts, such as their property selection, pricing, and guest communication, can offer valuable lessons for optimizing your own Airbnb operations in Seojong.
Dive Deeper: Advanced Seojong STR Market Data (2025)
Ready to unlock more insights? AirROI provides access to advanced metrics and comprehensive Airbnb data for Seojong. Explore detailed analytics beyond this report to refine your investment strategy, optimize pricing, and maximize your vacation rental profits.
Explore Advanced MetricsSeojong Short-Term Rental Market Composition (2025): Property & Room Types
Room Type Distribution
Property Type Distribution
Market Composition Insights for Seojong
- The Seojong Airbnb market composition is heavily skewed towards Entire Home/Apt listings, which make up 100% of the 18 active rentals. This indicates strong guest preference for privacy and space.
- Looking at the property type distribution in Seojong, House properties are the most common (50%), reflecting the local real estate landscape.
- Houses represent a significant 50% portion, catering likely to families or larger groups.
- The presence of 16.7% Hotel/Boutique listings indicates integration with traditional hospitality.
Seojong Airbnb Room Capacity Analysis (2025): Bedroom Distribution
Distribution of Listings by Number of Bedrooms
Room Capacity Insights for Seojong
- The dominant room capacity in Seojong is 2 bedrooms listings, making up 38.9% of the market. This suggests a strong demand for properties suitable for couples or solo travelers.
- Together, 2 bedrooms and 1 bedroom properties represent 72.2% of the active Airbnb listings in Seojong, indicating a high concentration in these sizes.
- A significant 22.2% of listings offer 3+ bedrooms, catering to larger groups and families seeking more space in Seojong.
Seojong Vacation Rental Guest Capacity Trends (2025)
Distribution of Listings by Guest Capacity
Guest Capacity Insights for Seojong
- The most common guest capacity trend in Seojong vacation rentals is listings accommodating 4 guests (33.3%). This suggests the primary traveler segment is likely small families or groups.
- Properties designed for 4 guests and 8+ guests dominate the Seojong STR market, accounting for 55.5% of listings.
- 38.9% of properties accommodate 6+ guests, serving the market segment for larger families or group travel in Seojong.
- On average, properties in Seojong are equipped to host 5.1 guests.
Seojong Airbnb Booking Patterns (2025): Available vs. Booked Days
Available Days Distribution
Booked Days Distribution
Booking Pattern Insights for Seojong
- The most common availability pattern in Seojong falls within the 271-366 days range, representing 77.8% of listings. This suggests many properties have significant open periods on their calendars.
- Approximately 94.5% of listings show high availability (181+ days open annually), indicating potential for increased bookings or specific owner usage patterns.
- For booked days, the 31-90 days range is most frequent in Seojong (44.4%), reflecting common guest stay durations or potential owner blocking patterns.
- A notable 5.6% of properties secure long booking periods (181+ days booked per year), highlighting successful long-term rental strategies or significant owner usage.
Seojong Airbnb Minimum Stay Requirements Analysis
Distribution of Listings by Minimum Night Requirement
1 Night
18 listings
100% of total
Key Insights
- The most prevalent minimum stay requirement in Seojong is 1 Night, adopted by 100% of listings. This highlights the market's preference for shorter, flexible bookings.
- A strong majority (100.0%) of the Seojong Airbnb data shows acceptance of very short stays (1-2 nights), indicating a dynamic, high-turnover market.
Recommendations
- Align with the market by considering a 1 Night minimum stay, as 100% of Seojong hosts use this setting.
- Adjust minimum nights based on seasonality – potentially shorter during low season and longer during peak demand periods in Seojong.
Seojong Airbnb Cancellation Policy Trends Analysis (2025)
Flexible
3 listings
16.7% of total
Moderate
7 listings
38.9% of total
Firm
4 listings
22.2% of total
Strict
4 listings
22.2% of total
Cancellation Policy Insights for Seojong
- The prevailing Airbnb cancellation policy trend in Seojong is Moderate, used by 38.9% of listings.
- There's a relatively balanced mix between guest-friendly (55.6%) and stricter (44.4%) policies, offering choices for different guest needs.
Recommendations for Hosts
- Consider adopting a Moderate policy to align with the 38.9% market standard in Seojong.
- Regularly review your cancellation policy against competitors and market demand shifts in Seojong.
Seojong STR Booking Lead Time Analysis (2025)
Average Booking Lead Time by Month
Booking Lead Time Insights for Seojong
- The overall average booking lead time for vacation rentals in Seojong is 16 days.
- Guests book furthest in advance for stays during October (average 28 days), likely coinciding with peak travel demand or local events.
- The shortest booking windows occur for stays in November (average 11 days), indicating more last-minute travel plans during this time.
- Seasonally, Summer (20 days avg.) sees the longest lead times, while Spring (14 days avg.) has the shortest, reflecting typical travel planning cycles.
Recommendations for Hosts
- Use the overall average lead time (16 days) as a baseline for your pricing and availability strategy in Seojong.
- For October stays, consider implementing length-of-stay discounts or slightly higher rates for bookings made less than 28 days out to capitalize on advance planning.
- Target marketing efforts for the Summer season well in advance (at least 20 days) to capture early planners.
- Monitor your own booking lead times against these Seojong averages to identify opportunities for dynamic pricing adjustments.
Popular & Essential Airbnb Amenities in Seojong (2025)
Amenity Prevalence
No amenities with partial availability (less than 100%) were found to display in the chart. All essential amenities might be present in all listings. Check insights below.
Amenity Insights for Seojong
- Essential amenities in Seojong that guests expect include: Shampoo, Cooking basics, Refrigerator, Free parking on premises, Backyard, Heating, Smoke alarm, Air conditioning, Stove, BBQ grill. Lacking these (any) could significantly impact bookings.
Recommendations for Hosts
- Ensure your listing includes all essential amenities for Seojong: Shampoo, Cooking basics, Refrigerator, Free parking on premises, Backyard, Heating, Smoke alarm, Air conditioning, Stove, BBQ grill.
- Highlight unique or less common amenities you offer (e.g., hot tub, dedicated workspace, EV charger) in your listing description and photos.
- Regularly check competitor amenities in Seojong to stay competitive.
Seojong Airbnb Guest Demographics & Profile Analysis (2025)
Guest Profile Summary for Seojong
- The typical guest profile for Airbnb in Seojong consists of primarily domestic travelers (91%), often arriving from nearby Seoul, typically belonging to the Post-2000s (Gen Z/Alpha) group (50%), primarily speaking Korean or English.
- Domestic travelers account for 91.4% of guests.
- Key international markets include South Korea (91.4%) and United States (3.4%).
- Top languages spoken are Korean (46.4%) followed by English (33.9%).
- A significant demographic segment is the Post-2000s (Gen Z/Alpha) group, representing 50% of guests.
Recommendations for Hosts
- Target domestic marketing efforts towards travelers from Seoul and Incheon.
- Tailor amenities and listing descriptions to appeal to the dominant Post-2000s (Gen Z/Alpha) demographic (e.g., highlight fast WiFi, smart home features, local guides).
- Highlight unique local experiences or amenities relevant to the primary guest profile.
- Consider seasonal promotions aligned with peak travel times for key origin markets.
Nearby Short-Term Rental Market Comparison
How does the Seojong Airbnb market stack up against its neighbors? Compare key performance metrics like average monthly revenue, ADR, and occupancy rates in surrounding areas to understand the broader regional STR landscape.
| Market | Active Properties | Monthly Revenue | Daily Rate | Avg. Occupancy |
|---|---|---|---|---|
| Homyeong-ri | 12 | $3,645 | $394.37 | 27% |
| Wondeok-ri | 10 | $2,758 | $246.67 | 38% |
| Dojang-ri | 12 | $1,900 | $211.02 | 31% |
| Sang | 17 | $1,807 | $251.75 | 24% |
| Seorak | 11 | $1,796 | $214.92 | 27% |
| Icheon-ri | 11 | $1,781 | $208.64 | 30% |
| Jeonjin-ri | 14 | $1,475 | $141.48 | 31% |
| Gwangju-si | 52 | $1,419 | $168.53 | 30% |
| Yeoju-si | 34 | $1,402 | $213.03 | 26% |
| Nomun-ri | 16 | $1,401 | $310.77 | 19% |