Naju-si Airbnb Market Analysis 2026: Short Term Rental Data & Vacation Rental Statistics in South Jeolla, South Korea
Is Airbnb profitable in Naju-si in 2026? Explore comprehensive Airbnb analytics for Naju-si, South Jeolla, South Korea to uncover income potential. This 2026 STR market report for Naju-si, based on AirROI data from February 2025 to January 2026, reveals key trends in the niche market of 42 active listings.
Whether you're considering an Airbnb investment in Naju-si, optimizing your existing vacation rental, or exploring rental arbitrage opportunities, understanding the Naju-si Airbnb data is crucial. Navigating the high regulation landscape is key to maximizing your short term rental income potential. Let's dive into the specifics.
Key Naju-si Airbnb Performance Metrics Overview
Monthly Airbnb Revenue Variations & Income Potential in Naju-si (2026)
Understanding the monthly revenue variations for Airbnb listings in Naju-si is key to maximizing your short term rental income potential. Seasonality significantly impacts earnings. Our analysis, based on data from the past 12 months, shows that the peak revenue month for STRs in Naju-si is typically October, while November often presents the lowest earnings, highlighting opportunities for strategic pricing adjustments during shoulder and low seasons. Explore the typical Airbnb income in Naju-si across different performance tiers:
- Best-in-class properties (Top 10%) achieve $2,252+ monthly, often utilizing dynamic pricing and superior guest experiences.
- Strong performing properties (Top 25%) earn $1,501 or more, indicating effective management and desirable locations/amenities.
- Typical properties (Median) generate around $718 per month, representing the average market performance.
- Entry-level properties (Bottom 25%) see earnings around $312, often with potential for optimization.
Average Monthly Airbnb Earnings Trend in Naju-si
Naju-si Airbnb Occupancy Rate Trends (2026)
Maximize your bookings by understanding the Naju-si STR occupancy trends. Seasonal demand shifts significantly influence how often properties are booked. Typically, Octobersees the highest demand (peak season occupancy), while June experiences the lowest (low season). Effective strategies, like adjusting minimum stays or offering promotions, can boost occupancy during slower periods. Here's how different property tiers perform in Naju-si:
- Best-in-class properties (Top 10%) achieve 51%+ occupancy, indicating high desirability and potentially optimized availability.
- Strong performing properties (Top 25%) maintain 32% or higher occupancy, suggesting good market fit and guest satisfaction.
- Typical properties (Median) have an occupancy rate around 19%.
- Entry-level properties (Bottom 25%) average 10% occupancy, potentially facing higher vacancy.
Average Monthly Occupancy Rate Trend in Naju-si
Average Daily Rate (ADR) Airbnb Trends in Naju-si (2026)
Effective short term rental pricing strategy in Naju-si involves understanding monthly ADR fluctuations. The Average Daily Rate (ADR) for Airbnb in Naju-si typically peaks in October and dips lowest during February. Leveraging Airbnb dynamic pricing tools or strategies based on this seasonality can significantly boost revenue. Here's a look at the typical nightly rates achieved:
- Best-in-class properties (Top 10%) command rates of $230+ per night, often due to premium features or locations.
- Strong performing properties (Top 25%) achieve nightly rates of $180 or more.
- Typical properties (Median) charge around $122 per night.
- Entry-level properties (Bottom 25%) earn around $54 per night.
Average Daily Rate (ADR) Trend by Month in Naju-si
Get Live Naju-si Market Intelligence 👇

Explore Real-time Analytics
Airbnb Seasonality Analysis & Trends in Naju-si (2026)
Peak Season (October, August, July)
- Revenue averages $1,270 per month
- Occupancy rates average 28.9%
- Daily rates average $131
Shoulder Season
- Revenue averages $982 per month
- Occupancy maintains around 24.6%
- Daily rates hold near $128
Low Season (March, June, November)
- Revenue drops to average $793 per month
- Occupancy decreases to average 19.6%
- Daily rates adjust to average $128
Seasonality Insights for Naju-si
- The Airbnb seasonality in Naju-si shows moderate seasonality with distinct peak and low periods. While the sections above show seasonal averages, it's also insightful to look at the extremes:
- During the high season, the absolute peak month showcases Naju-si's highest earning potential, with monthly revenues capable of climbing to $1,417, occupancy reaching a high of 33.0%, and ADRs peaking at $135.
- Conversely, the slowest single month of the year, typically falling within the low season, marks the market's lowest point. In this month, revenue might dip to $729, occupancy could drop to 18.1%, and ADRs may adjust down to $123.
- Understanding both the seasonal averages and these monthly peaks and troughs in revenue, occupancy, and ADR is crucial for maximizing your Airbnb profit potential in Naju-si.
Seasonal Strategies for Maximizing Profit
- Peak Season: Maximize revenue through premium pricing and potentially longer minimum stays. Ensure high availability.
- Low Season: Offer competitive pricing, special promotions (e.g., extended stay discounts), and flexible cancellation policies. Target off-season travelers like remote workers or budget-conscious guests.
- Shoulder Seasons: Implement dynamic pricing that balances peak and low rates. Target weekend travelers or specific events. Offer slightly more flexible terms than peak season.
- Regularly analyze your own performance against these Naju-si seasonality benchmarks and adjust your pricing and availability strategy accordingly.
Best Areas for Airbnb Investment in Naju-si (2026)
Exploring the top neighborhoods for short-term rentals in Naju-si? This section highlights key areas, outlining why they are attractive for hosts and guests, along with notable local attractions. Consider these locations based on your target guest profile and investment strategy.
| Neighborhood / Area | Why Host Here? (Target Guests & Appeal) | Key Attractions & Landmarks |
|---|---|---|
| Naju City Center | The heart of Naju, offering convenient access to shopping, dining, and local culture. Attracts both business travelers and tourists for its central location. | Naju Fairytale Village, Naju National Museum, Yeongam Lake Park, Naju Arts Center, Kumho Museum of Art |
| Naju Green Tea Fields | Famous for its scenic green tea plantations, providing a serene experience for nature lovers and tourists seeking tranquility and leisure activities. | Naju Green Tea Field, Naju Geumseong Mountain, Tea Museum, Jeong-am Temple, Hwangsan Mountain |
| Cheonggye Stream | A lovely natural area in Naju, popular for leisure walks and family outings. Ideal for hosting guests who appreciate outdoor activities. | Cheonggye Stream Park, Daejeonghyanggyo Confucian School, Naju Wildlife Park, Walking and cycling paths, Picnic areas |
| Naju Hanok Village | A cultural heritage site showcasing traditional Korean architecture, attracting tourists interested in history and cultural experiences. | Traditional Hanok Houses, Cultural workshops, Korean traditional performances, Local crafts shops, Heritage museum |
| Naju Sports Park | Local sports and outdoor activities hub, appealing to both families and fitness enthusiasts. Hosts various sporting events. | Stadium and sports facilities, Walking trails, Playgrounds, Local sports events, Community gatherings |
| Naju Riverside | A scenic area perfect for leisure and activities by the river, popular among locals and tourists for picnics and family outings. | Naju Riverside Park, Walking and cycling paths along the river, Fishing spots, Cafes by the river, Seasonal festivals |
| Seonghwangsa Temple | A historical and spiritual site that attracts visitors interested in Buddhist culture and tranquility, providing a peaceful retreat. | Seonghwangsa Temple grounds, Meditation areas, Scenic views, Cultural retreats, Nature walks |
| Naju Traditional Market | A bustling local market offering traditional Korean street food and local products, ideal for those wanting an authentic local experience. | Street food vendors, Local crafts, Fresh produce, Cultural experiences, Shopping for souvenirs |
Understanding Airbnb License Requirements & STR Laws in Naju-si (2026)
Yes, Naju-si, South Jeolla, South Korea enforces high STR regulations. Obtaining a license and ensuring compliance is almost certainly required according to current 2026 STR laws. Always verify the latest short term rental regulations and Airbnb license requirements directly with local government authorities for Naju-si to ensure full compliance before hosting.
(Source: AirROI data, 2026, based on 67% licensed listings)
Top Performing Airbnb Properties in Naju-si (2026)
Benchmark your potential! Explore examples of top-performing Airbnb properties in Naju-sibased on Trailing Twelve Month (TTM) revenue. Analyze their characteristics, revenue, occupancy rate, and ADR to understand what drives success in this market.

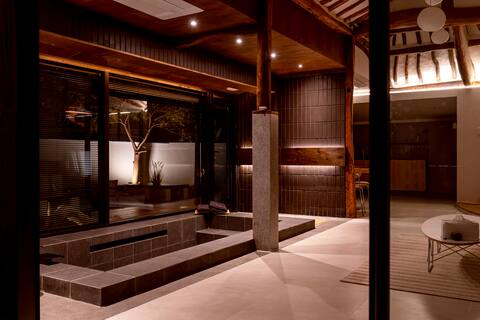
Naseojin Hanok
Entire Place • 2 bedrooms
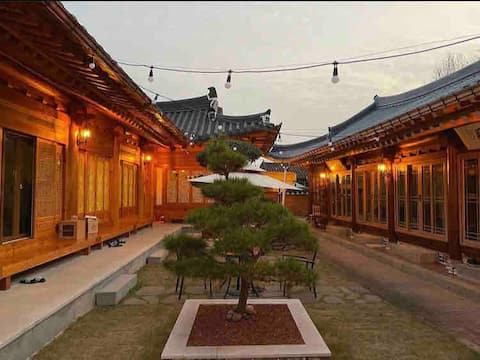
Stay Eunshinhee_Jacuzzi Pension next to Geumseong Hall
Entire Place • 1 bedroom
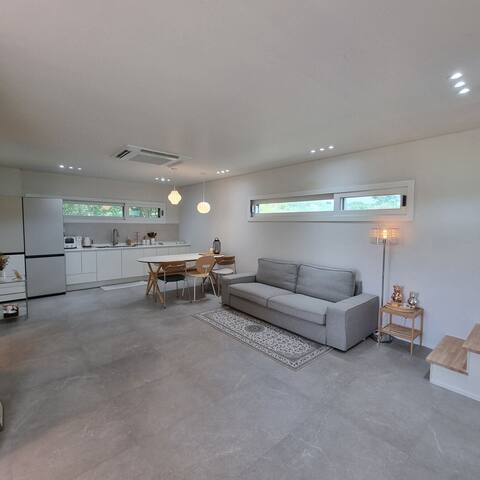
Hanok Stay Yoon Eun-jae (entire house)
Entire Place • 3 bedrooms
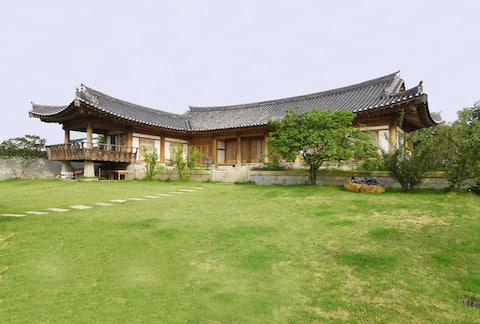
A private two-story house where you can only feel the Yeosimul-gil/countryside
Entire Place • 2 bedrooms

Slow (Naju)
Entire Place • 2 bedrooms
Lee Hwadang, Bara Hanok Stay
Entire Place • 3 bedrooms
Note: Performance varies based on location, size, amenities, seasonality, and management quality. Data reflects the past 12 months.
Top Performing Airbnb Hosts in Naju-si (2026)
Learn from the best! This table showcases top-performing Airbnb hosts in Naju-si based on the number of properties managed and estimated total revenue over the past year. Analyze their scale and performance metrics.
| Host Name | Properties | Grossing Revenue | Stay Reviews | Avg Rating |
|---|---|---|---|---|
| Yuneunjae | 4 | $45,337 | 182 | 4.99/5.0 |
| 명헌 | 1 | $37,439 | 657 | 4.91/5.0 |
| Judy | 1 | $25,935 | 25 | 5.00/5.0 |
| 지영 | 1 | $21,619 | 126 | 4.98/5.0 |
| Chanwee | 1 | $20,523 | 148 | 4.98/5.0 |
| 이화당 | 1 | $19,022 | 112 | 4.54/5.0 |
| Yiseul | 1 | $17,902 | 9 | 5.00/5.0 |
| 미경 | 2 | $13,584 | 29 | 4.85/5.0 |
| 금채 | 2 | $13,121 | 49 | 4.98/5.0 |
| 이로 | 1 | $10,580 | 2 | Not Rated |
Analyzing the strategies of top hosts, such as their property selection, pricing, and guest communication, can offer valuable lessons for optimizing your own Airbnb operations in Naju-si.
Dive Deeper: Advanced Naju-si STR Market Data (2026)
Ready to unlock more insights? AirROI provides access to advanced metrics and comprehensive Airbnb data for Naju-si. Explore detailed analytics beyond this report to refine your investment strategy, optimize pricing, and maximize your vacation rental profits.
Explore Advanced MetricsNaju-si Short-Term Rental Market Composition (2026): Property & Room Types
Room Type Distribution
Property Type Distribution
Market Composition Insights for Naju-si
- The Naju-si Airbnb market composition is heavily skewed towards Entire Home/Apt listings, which make up 81% of the 42 active rentals. This indicates strong guest preference for privacy and space.
- Looking at the property type distribution in Naju-si, House properties are the most common (45.2%), reflecting the local real estate landscape.
- Houses represent a significant 45.2% portion, catering likely to families or larger groups.
- The presence of 42.9% Hotel/Boutique listings indicates integration with traditional hospitality.
- Smaller segments like others (combined 2.4%) offer potential for unique stay experiences.
Naju-si Airbnb Room Capacity Analysis (2026): Bedroom Distribution
Distribution of Listings by Number of Bedrooms
Room Capacity Insights for Naju-si
- The dominant room capacity in Naju-si is 1 bedroom listings, making up 38.1% of the market. This suggests a strong demand for properties suitable for couples or solo travelers.
- Together, 1 bedroom and 2 bedrooms properties represent 73.8% of the active Airbnb listings in Naju-si, indicating a high concentration in these sizes.
Naju-si Vacation Rental Guest Capacity Trends (2026)
Distribution of Listings by Guest Capacity
Guest Capacity Insights for Naju-si
- The most common guest capacity trend in Naju-si vacation rentals is listings accommodating 8+ guests (26.2%). This suggests the primary traveler segment is likely larger groups.
- Properties designed for 8+ guests and 4 guests dominate the Naju-si STR market, accounting for 50.0% of listings.
- 45.3% of properties accommodate 6+ guests, serving the market segment for larger families or group travel in Naju-si.
- On average, properties in Naju-si are equipped to host 5.1 guests.
Naju-si Airbnb Booking Patterns (2026): Available vs. Booked Days
Available Days Distribution
Booked Days Distribution
Booking Pattern Insights for Naju-si
- The most common availability pattern in Naju-si falls within the 271-366 days range, representing 85.7% of listings. This suggests many properties have significant open periods on their calendars.
- Approximately 97.6% of listings show high availability (181+ days open annually), indicating potential for increased bookings or specific owner usage patterns.
- For booked days, the 31-90 days range is most frequent in Naju-si (40.5%), reflecting common guest stay durations or potential owner blocking patterns.
- A notable 2.4% of properties secure long booking periods (181+ days booked per year), highlighting successful long-term rental strategies or significant owner usage.
Naju-si Airbnb Minimum Stay Requirements Analysis
Distribution of Listings by Minimum Night Requirement
1 Night
41 listings
97.6% of total
7-29 Nights
1 listings
2.4% of total
Key Insights
- The most prevalent minimum stay requirement in Naju-si is 1 Night, adopted by 97.6% of listings. This highlights the market's preference for shorter, flexible bookings.
- A strong majority (97.6%) of the Naju-si Airbnb data shows acceptance of very short stays (1-2 nights), indicating a dynamic, high-turnover market.
Recommendations
- Align with the market by considering a 1 Night minimum stay, as 97.6% of Naju-si hosts use this setting.
- Adjust minimum nights based on seasonality – potentially shorter during low season and longer during peak demand periods in Naju-si.
Naju-si Airbnb Cancellation Policy Trends Analysis (2026)
Flexible
8 listings
19% of total
Moderate
22 listings
52.4% of total
Firm
9 listings
21.4% of total
Strict
3 listings
7.1% of total
Cancellation Policy Insights for Naju-si
- The prevailing Airbnb cancellation policy trend in Naju-si is Moderate, used by 52.4% of listings.
- The market strongly favors guest-friendly terms, with 71.4% of listings offering Flexible or Moderate policies. This suggests guests in Naju-si may expect booking flexibility.
- Strict cancellation policies are quite rare (7.1%), potentially making listings with this policy less competitive unless justified by high demand or property type.
Recommendations for Hosts
- Consider adopting a Moderate policy to align with the 52.4% market standard in Naju-si.
- Using a Strict policy might deter some guests, as only 7.1% of listings use it. Evaluate if potential revenue protection outweighs possible lower booking rates.
- Regularly review your cancellation policy against competitors and market demand shifts in Naju-si.
Naju-si STR Booking Lead Time Analysis (2026)
Average Booking Lead Time by Month
Booking Lead Time Insights for Naju-si
- The overall average booking lead time for vacation rentals in Naju-si is 20 days.
- Guests book furthest in advance for stays during October (average 37 days), likely coinciding with peak travel demand or local events.
- The shortest booking windows occur for stays in March (average 11 days), indicating more last-minute travel plans during this time.
- Seasonally, Fall (28 days avg.) sees the longest lead times, while Spring (17 days avg.) has the shortest, reflecting typical travel planning cycles.
Recommendations for Hosts
- Use the overall average lead time (20 days) as a baseline for your pricing and availability strategy in Naju-si.
- For October stays, consider implementing length-of-stay discounts or slightly higher rates for bookings made less than 37 days out to capitalize on advance planning.
- During March, focus on last-minute booking availability and promotions, as guests book with very short notice (11 days avg.).
- Target marketing efforts for the Fall season well in advance (at least 28 days) to capture early planners.
- Monitor your own booking lead times against these Naju-si averages to identify opportunities for dynamic pricing adjustments.
Popular & Essential Airbnb Amenities in Naju-si (2026)
Amenity Prevalence
Amenity Insights for Naju-si
- Essential amenities in Naju-si that guests expect include: Air conditioning. Lacking these (this) could significantly impact bookings.
- Popular amenities like Wifi, TV, Fire extinguisher are common but not universal. Offering these can provide a competitive edge.
- Warning: Wifi is not universally provided but is considered essential globally. Ensure reliable Wifi is offered.
Recommendations for Hosts
- Ensure your listing includes all essential amenities for Naju-si: Air conditioning.
- Consider adding popular differentiators like Wifi or TV to increase appeal.
- Highlight unique or less common amenities you offer (e.g., hot tub, dedicated workspace, EV charger) in your listing description and photos.
- Regularly check competitor amenities in Naju-si to stay competitive.
Naju-si Airbnb Guest Demographics & Profile Analysis (2026)
Guest Profile Summary for Naju-si
- The typical guest profile for Airbnb in Naju-si consists of primarily domestic travelers (89%), often arriving from nearby Seoul, typically belonging to the Post-2000s (Gen Z/Alpha) group (50%), primarily speaking Korean or English.
- Domestic travelers account for 89.0% of guests.
- Key international markets include South Korea (89%) and United States (4.4%).
- Top languages spoken are Korean (61.2%) followed by English (34.7%).
- A significant demographic segment is the Post-2000s (Gen Z/Alpha) group, representing 50% of guests.
Recommendations for Hosts
- Target domestic marketing efforts towards travelers from Seoul and Gwangju.
- Tailor amenities and listing descriptions to appeal to the dominant Post-2000s (Gen Z/Alpha) demographic (e.g., highlight fast WiFi, smart home features, local guides).
- Highlight unique local experiences or amenities relevant to the primary guest profile.
- Consider seasonal promotions aligned with peak travel times for key origin markets.
Nearby Short-Term Rental Market Comparison
How does the Naju-si Airbnb market stack up against its neighbors? Compare key performance metrics like average monthly revenue, ADR, and occupancy rates in surrounding areas to understand the broader regional STR landscape.
| Market | Active Properties | Monthly Revenue | Daily Rate | Avg. Occupancy |
|---|---|---|---|---|
| Buyeo-eup | 11 | $1,185 | $121.79 | 33% |
| Janggok-ri | 10 | $1,145 | $150.75 | 28% |
| Gui-myeon | 11 | $1,124 | $173.21 | 24% |
| Jeongeup-si | 26 | $1,057 | $147.63 | 28% |
| Nonsan-si | 23 | $1,057 | $143.44 | 29% |
| Hakdong-ri | 22 | $1,023 | $173.05 | 27% |
| Heungnyong-ri | 12 | $990 | $98.80 | 40% |
| Asan-si | 67 | $974 | $149.84 | 32% |
| Chungju-si | 93 | $928 | $139.37 | 27% |
| Seosan-si | 71 | $925 | $146.85 | 26% |