Yeongju-si Airbnb Market Analysis 2026: Short Term Rental Data & Vacation Rental Statistics in North Gyeongsang, South Korea
Is Airbnb profitable in Yeongju-si in 2026? Explore comprehensive Airbnb analytics for Yeongju-si, North Gyeongsang, South Korea to uncover income potential. This 2026 STR market report for Yeongju-si, based on AirROI data from February 2025 to January 2026, reveals key trends in the niche market of 36 active listings.
Whether you're considering an Airbnb investment in Yeongju-si, optimizing your existing vacation rental, or exploring rental arbitrage opportunities, understanding the Yeongju-si Airbnb data is crucial. Navigating the high regulation landscape is key to maximizing your short term rental income potential. Let's dive into the specifics.
Key Yeongju-si Airbnb Performance Metrics Overview
Monthly Airbnb Revenue Variations & Income Potential in Yeongju-si (2026)
Understanding the monthly revenue variations for Airbnb listings in Yeongju-si is key to maximizing your short term rental income potential. Seasonality significantly impacts earnings. Our analysis, based on data from the past 12 months, shows that the peak revenue month for STRs in Yeongju-si is typically October, while April often presents the lowest earnings, highlighting opportunities for strategic pricing adjustments during shoulder and low seasons. Explore the typical Airbnb income in Yeongju-si across different performance tiers:
- Best-in-class properties (Top 10%) achieve $2,575+ monthly, often utilizing dynamic pricing and superior guest experiences.
- Strong performing properties (Top 25%) earn $1,442 or more, indicating effective management and desirable locations/amenities.
- Typical properties (Median) generate around $752 per month, representing the average market performance.
- Entry-level properties (Bottom 25%) see earnings around $314, often with potential for optimization.
Average Monthly Airbnb Earnings Trend in Yeongju-si
Yeongju-si Airbnb Occupancy Rate Trends (2026)
Maximize your bookings by understanding the Yeongju-si STR occupancy trends. Seasonal demand shifts significantly influence how often properties are booked. Typically, Octobersees the highest demand (peak season occupancy), while April experiences the lowest (low season). Effective strategies, like adjusting minimum stays or offering promotions, can boost occupancy during slower periods. Here's how different property tiers perform in Yeongju-si:
- Best-in-class properties (Top 10%) achieve 55%+ occupancy, indicating high desirability and potentially optimized availability.
- Strong performing properties (Top 25%) maintain 37% or higher occupancy, suggesting good market fit and guest satisfaction.
- Typical properties (Median) have an occupancy rate around 18%.
- Entry-level properties (Bottom 25%) average 9% occupancy, potentially facing higher vacancy.
Average Monthly Occupancy Rate Trend in Yeongju-si
Average Daily Rate (ADR) Airbnb Trends in Yeongju-si (2026)
Effective short term rental pricing strategy in Yeongju-si involves understanding monthly ADR fluctuations. The Average Daily Rate (ADR) for Airbnb in Yeongju-si typically peaks in December and dips lowest during April. Leveraging Airbnb dynamic pricing tools or strategies based on this seasonality can significantly boost revenue. Here's a look at the typical nightly rates achieved:
- Best-in-class properties (Top 10%) command rates of $205+ per night, often due to premium features or locations.
- Strong performing properties (Top 25%) achieve nightly rates of $156 or more.
- Typical properties (Median) charge around $118 per night.
- Entry-level properties (Bottom 25%) earn around $79 per night.
Average Daily Rate (ADR) Trend by Month in Yeongju-si
Get Live Yeongju-si Market Intelligence 👇

Explore Real-time Analytics
Airbnb Seasonality Analysis & Trends in Yeongju-si (2026)
Peak Season (October, August, November)
- Revenue averages $1,490 per month
- Occupancy rates average 33.2%
- Daily rates average $130
Shoulder Season
- Revenue averages $1,043 per month
- Occupancy maintains around 24.2%
- Daily rates hold near $127
Low Season (February, March, April)
- Revenue drops to average $857 per month
- Occupancy decreases to average 20.3%
- Daily rates adjust to average $119
Seasonality Insights for Yeongju-si
- The Airbnb seasonality in Yeongju-si shows highly seasonal trends requiring careful strategy. While the sections above show seasonal averages, it's also insightful to look at the extremes:
- During the high season, the absolute peak month showcases Yeongju-si's highest earning potential, with monthly revenues capable of climbing to $1,774, occupancy reaching a high of 39.5%, and ADRs peaking at $132.
- Conversely, the slowest single month of the year, typically falling within the low season, marks the market's lowest point. In this month, revenue might dip to $785, occupancy could drop to 18.7%, and ADRs may adjust down to $119.
- Understanding both the seasonal averages and these monthly peaks and troughs in revenue, occupancy, and ADR is crucial for maximizing your Airbnb profit potential in Yeongju-si.
Seasonal Strategies for Maximizing Profit
- Peak Season: Maximize revenue through premium pricing and potentially longer minimum stays. Ensure high availability.
- Low Season: Offer competitive pricing, special promotions (e.g., extended stay discounts), and flexible cancellation policies. Target off-season travelers like remote workers or budget-conscious guests.
- Shoulder Seasons: Implement dynamic pricing that balances peak and low rates. Target weekend travelers or specific events. Offer slightly more flexible terms than peak season.
- Regularly analyze your own performance against these Yeongju-si seasonality benchmarks and adjust your pricing and availability strategy accordingly.
Best Areas for Airbnb Investment in Yeongju-si (2026)
Exploring the top neighborhoods for short-term rentals in Yeongju-si? This section highlights key areas, outlining why they are attractive for hosts and guests, along with notable local attractions. Consider these locations based on your target guest profile and investment strategy.
| Neighborhood / Area | Why Host Here? (Target Guests & Appeal) | Key Attractions & Landmarks |
|---|---|---|
| Yeongju City Center | The bustling hub of Yeongju with access to shops, restaurants, and public transport. Ideal for travelers who want convenience and local culture. | Yeongju City Hall, Local Markets, Restaurants, Cafés, Cultural Centers |
| Buseoksa Temple | A significant cultural heritage site and one of the most famous temples in Korea. Attracts tourists interested in history and spirituality. | Buseoksa Temple, Samcheok River, Scenic Walking Trails |
| Sobaeksan National Park | A beautiful national park offering stunning natural scenery, making it appealing for nature lovers and hikers looking for peace and tranquility. | Sobaeksan Peak, Hiking Trails, Wildlife, Natural Scenery |
| Daejeon Cultural District | Close to cultural and historical sites, appealing to those interested in heritage and local traditions while enjoying modern amenities. | Cultural Centers, Traditional Markets, Historical Sites |
| Mireuksan Mountain | Popular among hikers and outdoor enthusiasts, offering beautiful views and nature experiences, ideal for active tourists. | Hiking Trails, Scenic Views, Picnic Areas |
| Gamseong Fortress | A historical site with scenic views and a glimpse into the past, attracting history buffs and tourists interested in local heritage. | Gamseong Fortress, Walking Trails, Historical Exhibitions |
| Cheongpungho Lake | A picturesque lake area offering recreational activities and relaxation opportunities, ideal for families and couples. | Lake Activities, Walking Paths, Scenic Views |
| Local Cultural Festivals | Yeongju hosts various cultural festivals throughout the year, making it vibrant for tourists seeking unique experiences. | Cultural Festivals, Local Food Tasting, Art Exhibitions |
Understanding Airbnb License Requirements & STR Laws in Yeongju-si (2026)
Yes, Yeongju-si, North Gyeongsang, South Korea enforces high STR regulations. Obtaining a license and ensuring compliance is almost certainly required according to current 2026 STR laws. Always verify the latest short term rental regulations and Airbnb license requirements directly with local government authorities for Yeongju-si to ensure full compliance before hosting.
(Source: AirROI data, 2026, based on 86% licensed listings)
Top Performing Airbnb Properties in Yeongju-si (2026)
Benchmark your potential! Explore examples of top-performing Airbnb properties in Yeongju-sibased on Trailing Twelve Month (TTM) revenue. Analyze their characteristics, revenue, occupancy rate, and ADR to understand what drives success in this market.
Only One Garden View Hut
Entire Place • 1 bedroom

A healing space with recovery and sharing -Shalom's House-
Entire Place • 5 bedrooms

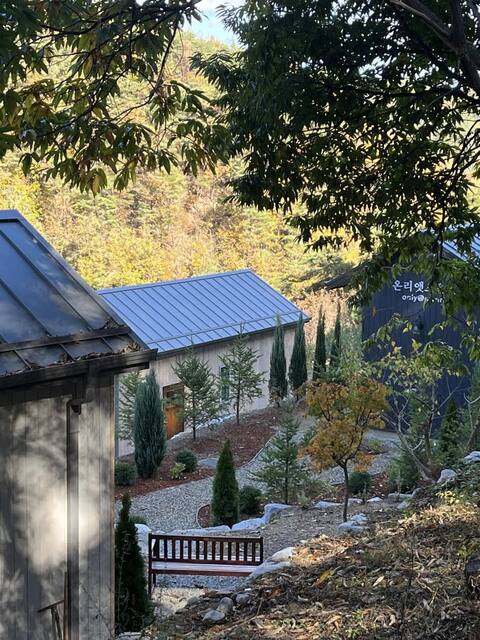
Onltyownly Forest View Hut
Entire Place • 1 bedroom
![[Youngju, Gyeongbuk] Hanok Bed and Breakfast Nokwonjae, spend the night next to Moseom Village! Take](https://a0.muscache.com/im/pictures/miso/Hosting-26818058/original/17c18aae-66fb-4c66-bea6-b7cc9ddb4c60.jpeg?im_w=480&im_format=avif)
[Youngju, Gyeongbuk] Hanok Bed and Breakfast Nokwonjae, spend the night next to Moseom Village! Take
Entire Place • 2 bedrooms
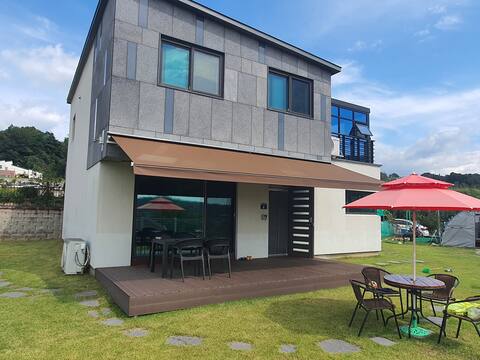
A place where families can rest together This is Geomun Pension. (No pets allowed)
Entire Place • 3 bedrooms

Sobaeksan Buseoksa Private House Choncance Thank you Forest House
Entire Place • 2 bedrooms
Note: Performance varies based on location, size, amenities, seasonality, and management quality. Data reflects the past 12 months.
Top Performing Airbnb Hosts in Yeongju-si (2026)
Learn from the best! This table showcases top-performing Airbnb hosts in Yeongju-si based on the number of properties managed and estimated total revenue over the past year. Analyze their scale and performance metrics.
| Host Name | Properties | Grossing Revenue | Stay Reviews | Avg Rating |
|---|---|---|---|---|
| 설아 | 2 | $78,612 | 29 | 5.00/5.0 |
| 샬롬 | 1 | $39,472 | 61 | 4.97/5.0 |
| 누룽지누나 | 2 | $23,128 | 333 | 4.92/5.0 |
| 석자 | 1 | $22,971 | 98 | 4.94/5.0 |
| 석규 | 1 | $19,217 | 87 | 4.94/5.0 |
| 무훈 | 1 | $18,825 | 30 | 4.93/5.0 |
| 연희 | 1 | $16,131 | 67 | 4.88/5.0 |
| 영훈 | 1 | $16,011 | 2 | Not Rated |
| Hyeon Suk | 2 | $14,745 | 450 | 4.96/5.0 |
| 숙열 | 3 | $13,281 | 24 | 4.50/5.0 |
Analyzing the strategies of top hosts, such as their property selection, pricing, and guest communication, can offer valuable lessons for optimizing your own Airbnb operations in Yeongju-si.
Dive Deeper: Advanced Yeongju-si STR Market Data (2026)
Ready to unlock more insights? AirROI provides access to advanced metrics and comprehensive Airbnb data for Yeongju-si. Explore detailed analytics beyond this report to refine your investment strategy, optimize pricing, and maximize your vacation rental profits.
Explore Advanced MetricsYeongju-si Short-Term Rental Market Composition (2026): Property & Room Types
Room Type Distribution
Property Type Distribution
Market Composition Insights for Yeongju-si
- The Yeongju-si Airbnb market composition is heavily skewed towards Entire Home/Apt listings, which make up 69.4% of the 36 active rentals. This indicates strong guest preference for privacy and space.
- However, a notable 30.6% share for Private Rooms suggests opportunities for budget-conscious travelers or hosts renting out spare rooms.
- Looking at the property type distribution in Yeongju-si, House properties are the most common (55.6%), reflecting the local real estate landscape.
- Houses represent a significant 55.6% portion, catering likely to families or larger groups.
- The presence of 36.1% Hotel/Boutique listings indicates integration with traditional hospitality.
Yeongju-si Airbnb Room Capacity Analysis (2026): Bedroom Distribution
Distribution of Listings by Number of Bedrooms
Room Capacity Insights for Yeongju-si
- The dominant room capacity in Yeongju-si is 1 bedroom listings, making up 30.6% of the market. This suggests a strong demand for properties suitable for couples or solo travelers.
- Together, 1 bedroom and 2 bedrooms properties represent 55.6% of the active Airbnb listings in Yeongju-si, indicating a high concentration in these sizes.
- A significant 25.1% of listings offer 3+ bedrooms, catering to larger groups and families seeking more space in Yeongju-si.
Yeongju-si Vacation Rental Guest Capacity Trends (2026)
Distribution of Listings by Guest Capacity
Guest Capacity Insights for Yeongju-si
- The most common guest capacity trend in Yeongju-si vacation rentals is listings accommodating 8+ guests (38.9%). This suggests the primary traveler segment is likely larger groups.
- Properties designed for 8+ guests and 4 guests dominate the Yeongju-si STR market, accounting for 55.6% of listings.
- 52.8% of properties accommodate 6+ guests, serving the market segment for larger families or group travel in Yeongju-si.
- On average, properties in Yeongju-si are equipped to host 5.1 guests.
Yeongju-si Airbnb Booking Patterns (2026): Available vs. Booked Days
Available Days Distribution
Booked Days Distribution
Booking Pattern Insights for Yeongju-si
- The most common availability pattern in Yeongju-si falls within the 271-366 days range, representing 72.2% of listings. This suggests many properties have significant open periods on their calendars.
- Approximately 91.6% of listings show high availability (181+ days open annually), indicating potential for increased bookings or specific owner usage patterns.
- For booked days, the 31-90 days range is most frequent in Yeongju-si (38.9%), reflecting common guest stay durations or potential owner blocking patterns.
- A notable 8.3% of properties secure long booking periods (181+ days booked per year), highlighting successful long-term rental strategies or significant owner usage.
Yeongju-si Airbnb Minimum Stay Requirements Analysis
Distribution of Listings by Minimum Night Requirement
1 Night
36 listings
100% of total
Key Insights
- The most prevalent minimum stay requirement in Yeongju-si is 1 Night, adopted by 100% of listings. This highlights the market's preference for shorter, flexible bookings.
- A strong majority (100.0%) of the Yeongju-si Airbnb data shows acceptance of very short stays (1-2 nights), indicating a dynamic, high-turnover market.
Recommendations
- Align with the market by considering a 1 Night minimum stay, as 100% of Yeongju-si hosts use this setting.
- Adjust minimum nights based on seasonality – potentially shorter during low season and longer during peak demand periods in Yeongju-si.
Yeongju-si Airbnb Cancellation Policy Trends Analysis (2026)
Limited
1 listings
2.8% of total
Flexible
5 listings
13.9% of total
Moderate
8 listings
22.2% of total
Firm
19 listings
52.8% of total
Strict
3 listings
8.3% of total
Cancellation Policy Insights for Yeongju-si
- The prevailing Airbnb cancellation policy trend in Yeongju-si is Firm, used by 52.8% of listings.
- A majority (61.1%) of hosts in Yeongju-si utilize Firm or Strict policies, indicating a market where hosts prioritize booking security.
- Strict cancellation policies are quite rare (8.3%), potentially making listings with this policy less competitive unless justified by high demand or property type.
Recommendations for Hosts
- Consider adopting a Firm policy to align with the 52.8% market standard in Yeongju-si.
- Using a Strict policy might deter some guests, as only 8.3% of listings use it. Evaluate if potential revenue protection outweighs possible lower booking rates.
- Regularly review your cancellation policy against competitors and market demand shifts in Yeongju-si.
Yeongju-si STR Booking Lead Time Analysis (2026)
Average Booking Lead Time by Month
Booking Lead Time Insights for Yeongju-si
- The overall average booking lead time for vacation rentals in Yeongju-si is 32 days.
- Guests book furthest in advance for stays during October (average 49 days), likely coinciding with peak travel demand or local events.
- The shortest booking windows occur for stays in February (average 16 days), indicating more last-minute travel plans during this time.
- Seasonally, Fall (38 days avg.) sees the longest lead times, while Spring (25 days avg.) has the shortest, reflecting typical travel planning cycles.
Recommendations for Hosts
- Use the overall average lead time (32 days) as a baseline for your pricing and availability strategy in Yeongju-si.
- For October stays, consider implementing length-of-stay discounts or slightly higher rates for bookings made less than 49 days out to capitalize on advance planning.
- Target marketing efforts for the Fall season well in advance (at least 38 days) to capture early planners.
- Monitor your own booking lead times against these Yeongju-si averages to identify opportunities for dynamic pricing adjustments.
Popular & Essential Airbnb Amenities in Yeongju-si (2026)
Amenity Prevalence
Amenity Insights for Yeongju-si
- Essential amenities in Yeongju-si that guests expect include: Air conditioning, Fire extinguisher, Kitchen, Wifi, Smoke alarm, Heating. Lacking these (any) could significantly impact bookings.
- Popular amenities like Shampoo, Hot water, Dishes and silverware are common but not universal. Offering these can provide a competitive edge.
Recommendations for Hosts
- Ensure your listing includes all essential amenities for Yeongju-si: Air conditioning, Fire extinguisher, Kitchen, Wifi, Smoke alarm, Heating.
- Prioritize adding missing essentials: Wifi, Smoke alarm, Heating.
- Consider adding popular differentiators like Shampoo or Hot water to increase appeal.
- Highlight unique or less common amenities you offer (e.g., hot tub, dedicated workspace, EV charger) in your listing description and photos.
- Regularly check competitor amenities in Yeongju-si to stay competitive.
Yeongju-si Airbnb Guest Demographics & Profile Analysis (2026)
Guest Profile Summary for Yeongju-si
- The typical guest profile for Airbnb in Yeongju-si consists of primarily domestic travelers (84%), often arriving from nearby Seoul, typically belonging to the Post-2000s (Gen Z/Alpha) group (50%), primarily speaking Korean or English.
- Domestic travelers account for 84.0% of guests.
- Key international markets include South Korea (84%) and United States (2.5%).
- Top languages spoken are Korean (40.6%) followed by English (36.2%).
- A significant demographic segment is the Post-2000s (Gen Z/Alpha) group, representing 50% of guests.
Recommendations for Hosts
- Target domestic marketing efforts towards travelers from Seoul and Incheon.
- Tailor amenities and listing descriptions to appeal to the dominant Post-2000s (Gen Z/Alpha) demographic (e.g., highlight fast WiFi, smart home features, local guides).
- Highlight unique local experiences or amenities relevant to the primary guest profile.
- Consider seasonal promotions aligned with peak travel times for key origin markets.
Nearby Short-Term Rental Market Comparison
How does the Yeongju-si Airbnb market stack up against its neighbors? Compare key performance metrics like average monthly revenue, ADR, and occupancy rates in surrounding areas to understand the broader regional STR landscape.
| Market | Active Properties | Monthly Revenue | Daily Rate | Avg. Occupancy |
|---|---|---|---|---|
| Homyeong-ri | 12 | $2,746 | $354.97 | 25% |
| Wondeok-ri | 10 | $2,296 | $221.70 | 36% |
| Sang | 15 | $1,951 | $254.39 | 25% |
| Icheon-ri | 10 | $1,713 | $179.19 | 31% |
| Seorak | 10 | $1,702 | $189.17 | 28% |
| Suyeong-gu | 10 | $1,695 | $185.60 | 47% |
| Dojang-ri | 12 | $1,514 | $204.25 | 28% |
| Yeoju-si | 28 | $1,480 | $209.28 | 26% |
| Nomun-ri | 16 | $1,344 | $301.08 | 22% |
| Hwayang-eup | 30 | $1,326 | $180.87 | 26% |