Gyeongsan-si Airbnb Market Analysis 2026: Short Term Rental Data & Vacation Rental Statistics in North Gyeongsang, South Korea
Is Airbnb profitable in Gyeongsan-si in 2026? Explore comprehensive Airbnb analytics for Gyeongsan-si, North Gyeongsang, South Korea to uncover income potential. This 2026 STR market report for Gyeongsan-si, based on AirROI data from February 2025 to January 2026, reveals key trends in the niche market of 52 active listings.
Whether you're considering an Airbnb investment in Gyeongsan-si, optimizing your existing vacation rental, or exploring rental arbitrage opportunities, understanding the Gyeongsan-si Airbnb data is crucial. Navigating the high regulation landscape is key to maximizing your short term rental income potential. Let's dive into the specifics.
Key Gyeongsan-si Airbnb Performance Metrics Overview
Monthly Airbnb Revenue Variations & Income Potential in Gyeongsan-si (2026)
Understanding the monthly revenue variations for Airbnb listings in Gyeongsan-si is key to maximizing your short term rental income potential. Seasonality significantly impacts earnings. Our analysis, based on data from the past 12 months, shows that the peak revenue month for STRs in Gyeongsan-si is typically December, while February often presents the lowest earnings, highlighting opportunities for strategic pricing adjustments during shoulder and low seasons. Explore the typical Airbnb income in Gyeongsan-si across different performance tiers:
- Best-in-class properties (Top 10%) achieve $1,989+ monthly, often utilizing dynamic pricing and superior guest experiences.
- Strong performing properties (Top 25%) earn $911 or more, indicating effective management and desirable locations/amenities.
- Typical properties (Median) generate around $420 per month, representing the average market performance.
- Entry-level properties (Bottom 25%) see earnings around $200, often with potential for optimization.
Average Monthly Airbnb Earnings Trend in Gyeongsan-si
Gyeongsan-si Airbnb Occupancy Rate Trends (2026)
Maximize your bookings by understanding the Gyeongsan-si STR occupancy trends. Seasonal demand shifts significantly influence how often properties are booked. Typically, Julysees the highest demand (peak season occupancy), while April experiences the lowest (low season). Effective strategies, like adjusting minimum stays or offering promotions, can boost occupancy during slower periods. Here's how different property tiers perform in Gyeongsan-si:
- Best-in-class properties (Top 10%) achieve 70%+ occupancy, indicating high desirability and potentially optimized availability.
- Strong performing properties (Top 25%) maintain 50% or higher occupancy, suggesting good market fit and guest satisfaction.
- Typical properties (Median) have an occupancy rate around 29%.
- Entry-level properties (Bottom 25%) average 17% occupancy, potentially facing higher vacancy.
Average Monthly Occupancy Rate Trend in Gyeongsan-si
Average Daily Rate (ADR) Airbnb Trends in Gyeongsan-si (2026)
Effective short term rental pricing strategy in Gyeongsan-si involves understanding monthly ADR fluctuations. The Average Daily Rate (ADR) for Airbnb in Gyeongsan-si typically peaks in December and dips lowest during April. Leveraging Airbnb dynamic pricing tools or strategies based on this seasonality can significantly boost revenue. Here's a look at the typical nightly rates achieved:
- Best-in-class properties (Top 10%) command rates of $192+ per night, often due to premium features or locations.
- Strong performing properties (Top 25%) achieve nightly rates of $49 or more.
- Typical properties (Median) charge around $34 per night.
- Entry-level properties (Bottom 25%) earn around $21 per night.
Average Daily Rate (ADR) Trend by Month in Gyeongsan-si
Get Live Gyeongsan-si Market Intelligence 👇

Explore Real-time Analytics
Airbnb Seasonality Analysis & Trends in Gyeongsan-si (2026)
Peak Season (December, October, March)
- Revenue averages $909 per month
- Occupancy rates average 36.3%
- Daily rates average $67
Shoulder Season
- Revenue averages $727 per month
- Occupancy maintains around 35.3%
- Daily rates hold near $66
Low Season (January, February, June)
- Revenue drops to average $627 per month
- Occupancy decreases to average 33.6%
- Daily rates adjust to average $66
Seasonality Insights for Gyeongsan-si
- The Airbnb seasonality in Gyeongsan-si shows moderate seasonality with distinct peak and low periods. While the sections above show seasonal averages, it's also insightful to look at the extremes:
- During the high season, the absolute peak month showcases Gyeongsan-si's highest earning potential, with monthly revenues capable of climbing to $933, occupancy reaching a high of 44.7%, and ADRs peaking at $68.
- Conversely, the slowest single month of the year, typically falling within the low season, marks the market's lowest point. In this month, revenue might dip to $600, occupancy could drop to 25.5%, and ADRs may adjust down to $63.
- Understanding both the seasonal averages and these monthly peaks and troughs in revenue, occupancy, and ADR is crucial for maximizing your Airbnb profit potential in Gyeongsan-si.
Seasonal Strategies for Maximizing Profit
- Peak Season: Maximize revenue through premium pricing and potentially longer minimum stays. Ensure high availability.
- Low Season: Offer competitive pricing, special promotions (e.g., extended stay discounts), and flexible cancellation policies. Target off-season travelers like remote workers or budget-conscious guests.
- Shoulder Seasons: Implement dynamic pricing that balances peak and low rates. Target weekend travelers or specific events. Offer slightly more flexible terms than peak season.
- Regularly analyze your own performance against these Gyeongsan-si seasonality benchmarks and adjust your pricing and availability strategy accordingly.
Best Areas for Airbnb Investment in Gyeongsan-si (2026)
Exploring the top neighborhoods for short-term rentals in Gyeongsan-si? This section highlights key areas, outlining why they are attractive for hosts and guests, along with notable local attractions. Consider these locations based on your target guest profile and investment strategy.
| Neighborhood / Area | Why Host Here? (Target Guests & Appeal) | Key Attractions & Landmarks |
|---|---|---|
| Gyeongsan City Center | The bustling heart of Gyeongsan with numerous shops, cafes, and restaurants. Ideal for travelers seeking convenience and accessibility to city resources. | Gyeongsan Traditional Market, Gyeongsan Culture and Arts Center, Seongseo Industrial Complex, Daegu International Airport, Pohang Steel Company |
| Gyeongsan Lake Park | A scenic area perfect for families and nature lovers. Offers tranquil views and outdoor recreational activities. | Gyeongsan Lake, Walking trails, Picnic areas, Boat rides, Biking paths |
| Cheongdo_gun | Nearby area known for its scenic beauty and cultural attractions. A great destination for those interested in traditional experiences. | Cheongdo Wine Tunnel, Daegeumjeong Pavilion, Agricultural experience programs, Traditional festivals |
| Gyeongsan University Area | Home to several universities, making it a hub for students and young professionals. Popular for short-term stays and budget-friendly options. | Gyeongsan University, Cafes and eateries, Student events, Shopping centers |
| Yeongsan River | A scenic river area perfect for outdoor activities and relaxation. Attracts those wanting to escape the urban environment. | Walking paths along the river, Fishing spots, Picnic areas, Water sports opportunities |
| Beomeo | A developing area with new apartments and housing, increasingly popular among travelers looking for modern accommodations. | Shopping centers, Restaurants, Proximity to public transportation |
| Daegu District | Adjacent to Gyeongsan, offering additional attractions and amenities. Great for those wanting easy access to Daegu's urban experience while staying in Gyeongsan. | Daegu's parks, Cultural sites, Shopping districts, Transportation hubs |
| Pohang | Close enough for day trips, Pohang offers coastal attractions and seafood dining. Ideal for guests looking for beach experiences and marine activities. | Pohang's beaches, Jukdo Market, Seonbong Park, The POSCO Museum |
Understanding Airbnb License Requirements & STR Laws in Gyeongsan-si (2026)
Yes, Gyeongsan-si, North Gyeongsang, South Korea enforces high STR regulations. Obtaining a license and ensuring compliance is almost certainly required according to current 2026 STR laws. Always verify the latest short term rental regulations and Airbnb license requirements directly with local government authorities for Gyeongsan-si to ensure full compliance before hosting.
(Source: AirROI data, 2026, based on 63% licensed listings)
Top Performing Airbnb Properties in Gyeongsan-si (2026)
Benchmark your potential! Explore examples of top-performing Airbnb properties in Gyeongsan-sibased on Trailing Twelve Month (TTM) revenue. Analyze their characteristics, revenue, occupancy rate, and ADR to understand what drives success in this market.

Hayang-eup, Gyeongsan, the upper and lower house of 'Wolryudang', where the moon stays
Entire Place • 5 bedrooms
![[Spring] Firewood restaurant. Private house. Private lawn yard.Barbecue. Coffee Bean Hangang Ramen F](https://a0.muscache.com/im/pictures/hosting/Hosting-1201944285702680803/original/01b893d8-b1bd-4009-b142-4bfbc47aca00.jpeg?im_w=480&im_format=avif)
[Spring] Firewood restaurant. Private house. Private lawn yard.Barbecue. Coffee Bean Hangang Ramen F
Entire Place • 4 bedrooms
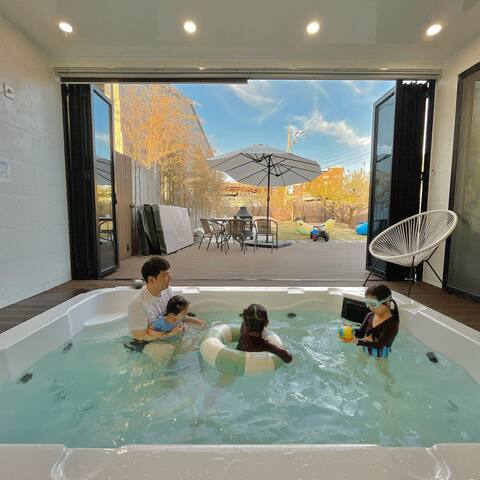
Daldal Villa; Hot water spa pool, garden, fire pit, and barbecue available for private stay
Entire Place • 1 bedroom
Hayang-eup, Gyeongsan's Hanok Private House: Where the moon stays 'Wolryudang'
Entire Place • 3 bedrooms

Pine Breeze
Entire Place • 2 bedrooms
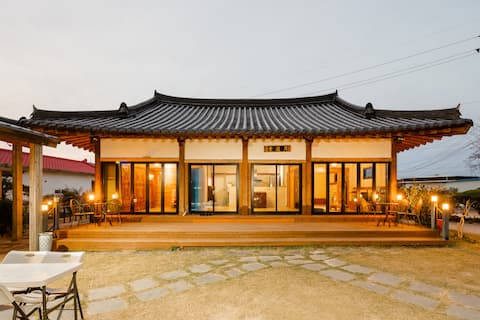
![[SU:M1960]A Modern Hanok near Daegu, built in 1960](https://a0.muscache.com/im/pictures/hosting/Hosting-1003576524077404888/original/cb5352d5-07db-4c33-90ac-fce02125563f.jpeg?im_w=480&im_format=avif)
[SU:M1960]A Modern Hanok near Daegu, built in 1960
Entire Place • 2 bedrooms
Note: Performance varies based on location, size, amenities, seasonality, and management quality. Data reflects the past 12 months.
Top Performing Airbnb Hosts in Gyeongsan-si (2026)
Learn from the best! This table showcases top-performing Airbnb hosts in Gyeongsan-si based on the number of properties managed and estimated total revenue over the past year. Analyze their scale and performance metrics.
| Host Name | Properties | Grossing Revenue | Stay Reviews | Avg Rating |
|---|---|---|---|---|
| 승희 | 3 | $58,503 | 187 | 4.80/5.0 |
| 춘봉 | 1 | $33,039 | 72 | 4.93/5.0 |
| 은애 | 1 | $28,293 | 41 | 4.98/5.0 |
| 스페셜k | 5 | $20,563 | 118 | 4.95/5.0 |
| 민경 | 9 | $18,954 | 253 | 4.86/5.0 |
| 하림 | 11 | $18,389 | 107 | 4.94/5.0 |
| 정호 | 2 | $15,990 | 406 | 4.88/5.0 |
| Clara | 1 | $15,490 | 33 | 5.00/5.0 |
| Koni | 4 | $15,200 | 57 | 4.92/5.0 |
| 순채 | 1 | $13,888 | 26 | 5.00/5.0 |
Analyzing the strategies of top hosts, such as their property selection, pricing, and guest communication, can offer valuable lessons for optimizing your own Airbnb operations in Gyeongsan-si.
Dive Deeper: Advanced Gyeongsan-si STR Market Data (2026)
Ready to unlock more insights? AirROI provides access to advanced metrics and comprehensive Airbnb data for Gyeongsan-si. Explore detailed analytics beyond this report to refine your investment strategy, optimize pricing, and maximize your vacation rental profits.
Explore Advanced MetricsGyeongsan-si Short-Term Rental Market Composition (2026): Property & Room Types
Room Type Distribution
Property Type Distribution
Market Composition Insights for Gyeongsan-si
- The Gyeongsan-si Airbnb market composition is heavily skewed towards Entire Home/Apt listings, which make up 94.2% of the 52 active rentals. This indicates strong guest preference for privacy and space.
- Looking at the property type distribution in Gyeongsan-si, Apartment/Condo properties are the most common (51.9%), reflecting the local real estate landscape.
- Houses represent a significant 42.3% portion, catering likely to families or larger groups.
- Smaller segments like outdoor/unique, hotel/boutique (combined 5.7%) offer potential for unique stay experiences.
Gyeongsan-si Airbnb Room Capacity Analysis (2026): Bedroom Distribution
Distribution of Listings by Number of Bedrooms
Room Capacity Insights for Gyeongsan-si
- The dominant room capacity in Gyeongsan-si is 1 bedroom listings, making up 40.4% of the market. This suggests a strong demand for properties suitable for couples or solo travelers.
- Together, 1 bedroom and 2 bedrooms properties represent 78.9% of the active Airbnb listings in Gyeongsan-si, indicating a high concentration in these sizes.
Gyeongsan-si Vacation Rental Guest Capacity Trends (2026)
Distribution of Listings by Guest Capacity
Guest Capacity Insights for Gyeongsan-si
- The most common guest capacity trend in Gyeongsan-si vacation rentals is listings accommodating 2 guests (40.4%). This suggests the primary traveler segment is likely couples or solo travelers.
- Properties designed for 2 guests and 4 guests dominate the Gyeongsan-si STR market, accounting for 59.6% of listings.
- A significant 40.4% of listings cater specifically to 1-2 guests, highlighting strong demand from couples and solo travelers in Gyeongsan-si.
- 23.1% of properties accommodate 6+ guests, serving the market segment for larger families or group travel in Gyeongsan-si.
- On average, properties in Gyeongsan-si are equipped to host 3.7 guests.
Gyeongsan-si Airbnb Booking Patterns (2026): Available vs. Booked Days
Available Days Distribution
Booked Days Distribution
Booking Pattern Insights for Gyeongsan-si
- The most common availability pattern in Gyeongsan-si falls within the 271-366 days range, representing 63.5% of listings. This suggests many properties have significant open periods on their calendars.
- Approximately 96.2% of listings show high availability (181+ days open annually), indicating potential for increased bookings or specific owner usage patterns.
- For booked days, the 31-90 days range is most frequent in Gyeongsan-si (48.1%), reflecting common guest stay durations or potential owner blocking patterns.
- A notable 3.8% of properties secure long booking periods (181+ days booked per year), highlighting successful long-term rental strategies or significant owner usage.
Gyeongsan-si Airbnb Minimum Stay Requirements Analysis
Distribution of Listings by Minimum Night Requirement
1 Night
26 listings
50% of total
2 Nights
4 listings
7.7% of total
3 Nights
1 listings
1.9% of total
4-6 Nights
4 listings
7.7% of total
30+ Nights
17 listings
32.7% of total
Key Insights
- The most prevalent minimum stay requirement in Gyeongsan-si is 1 Night, adopted by 50% of listings. This highlights the market's preference for shorter, flexible bookings.
- A significant segment (32.7%) caters to monthly stays (30+ nights) in Gyeongsan-si, pointing to opportunities in the extended-stay market.
Recommendations
- Align with the market by considering a 1 Night minimum stay, as 50% of Gyeongsan-si hosts use this setting.
- Explore offering discounts for stays of 30+ nights to attract the 32.7% of the market seeking extended stays.
- Adjust minimum nights based on seasonality – potentially shorter during low season and longer during peak demand periods in Gyeongsan-si.
Gyeongsan-si Airbnb Cancellation Policy Trends Analysis (2026)
Flexible
4 listings
7.7% of total
Moderate
32 listings
61.5% of total
Firm
14 listings
26.9% of total
Strict
2 listings
3.8% of total
Cancellation Policy Insights for Gyeongsan-si
- The prevailing Airbnb cancellation policy trend in Gyeongsan-si is Moderate, used by 61.5% of listings.
- There's a relatively balanced mix between guest-friendly (69.2%) and stricter (30.7%) policies, offering choices for different guest needs.
- Strict cancellation policies are quite rare (3.8%), potentially making listings with this policy less competitive unless justified by high demand or property type.
Recommendations for Hosts
- Consider adopting a Moderate policy to align with the 61.5% market standard in Gyeongsan-si.
- Using a Strict policy might deter some guests, as only 3.8% of listings use it. Evaluate if potential revenue protection outweighs possible lower booking rates.
- Regularly review your cancellation policy against competitors and market demand shifts in Gyeongsan-si.
Gyeongsan-si STR Booking Lead Time Analysis (2026)
Average Booking Lead Time by Month
Booking Lead Time Insights for Gyeongsan-si
- The overall average booking lead time for vacation rentals in Gyeongsan-si is 19 days.
- Guests book furthest in advance for stays during February (average 34 days), likely coinciding with peak travel demand or local events.
- The shortest booking windows occur for stays in December (average 12 days), indicating more last-minute travel plans during this time.
- Seasonally, Spring (23 days avg.) sees the longest lead times, while Summer (17 days avg.) has the shortest, reflecting typical travel planning cycles.
Recommendations for Hosts
- Use the overall average lead time (19 days) as a baseline for your pricing and availability strategy in Gyeongsan-si.
- For February stays, consider implementing length-of-stay discounts or slightly higher rates for bookings made less than 34 days out to capitalize on advance planning.
- Target marketing efforts for the Spring season well in advance (at least 23 days) to capture early planners.
- Monitor your own booking lead times against these Gyeongsan-si averages to identify opportunities for dynamic pricing adjustments.
Popular & Essential Airbnb Amenities in Gyeongsan-si (2026)
Amenity Prevalence
Amenity Insights for Gyeongsan-si
- Essential amenities in Gyeongsan-si that guests expect include: Air conditioning, Wifi, Cooking basics, Heating, Hair dryer. Lacking these (any) could significantly impact bookings.
- Popular amenities like TV, Hot water, Hangers are common but not universal. Offering these can provide a competitive edge.
Recommendations for Hosts
- Ensure your listing includes all essential amenities for Gyeongsan-si: Air conditioning, Wifi, Cooking basics, Heating, Hair dryer.
- Prioritize adding missing essentials: Wifi, Cooking basics, Heating, Hair dryer.
- Consider adding popular differentiators like TV or Hot water to increase appeal.
- Highlight unique or less common amenities you offer (e.g., hot tub, dedicated workspace, EV charger) in your listing description and photos.
- Regularly check competitor amenities in Gyeongsan-si to stay competitive.
Gyeongsan-si Airbnb Guest Demographics & Profile Analysis (2026)
Guest Profile Summary for Gyeongsan-si
- The typical guest profile for Airbnb in Gyeongsan-si consists of primarily domestic travelers (84%), often arriving from nearby Seoul, typically belonging to the Post-2000s (Gen Z/Alpha) group (50%), primarily speaking Korean or English.
- Domestic travelers account for 83.6% of guests.
- Key international markets include South Korea (83.6%) and United States (9.5%).
- Top languages spoken are Korean (49.3%) followed by English (35.6%).
- A significant demographic segment is the Post-2000s (Gen Z/Alpha) group, representing 50% of guests.
Recommendations for Hosts
- Target domestic marketing efforts towards travelers from Seoul and Daegu.
- Tailor amenities and listing descriptions to appeal to the dominant Post-2000s (Gen Z/Alpha) demographic (e.g., highlight fast WiFi, smart home features, local guides).
- Highlight unique local experiences or amenities relevant to the primary guest profile.
- Consider seasonal promotions aligned with peak travel times for key origin markets.
Nearby Short-Term Rental Market Comparison
How does the Gyeongsan-si Airbnb market stack up against its neighbors? Compare key performance metrics like average monthly revenue, ADR, and occupancy rates in surrounding areas to understand the broader regional STR landscape.
| Market | Active Properties | Monthly Revenue | Daily Rate | Avg. Occupancy |
|---|---|---|---|---|
| Suyeong-gu | 10 | $1,695 | $185.60 | 47% |
| Tsushima | 29 | $1,578 | $120.60 | 48% |
| Hwayang-eup | 30 | $1,326 | $180.87 | 26% |
| Busan | 4,887 | $1,165 | $105.29 | 44% |
| Chunyang-myeon | 18 | $1,149 | $115.65 | 40% |
| Gui-myeon | 11 | $1,124 | $173.21 | 24% |
| Nonsan-si | 23 | $1,057 | $143.44 | 29% |
| Gyeongju-si | 1,365 | $1,049 | $131.98 | 31% |
| Sangju-si | 15 | $1,040 | $146.10 | 22% |
| Hakdong-ri | 22 | $1,023 | $173.05 | 27% |