Cheongju-si Airbnb Market Analysis 2026: Short Term Rental Data & Vacation Rental Statistics in North Chungcheong, South Korea
Is Airbnb profitable in Cheongju-si in 2026? Explore comprehensive Airbnb analytics for Cheongju-si, North Chungcheong, South Korea to uncover income potential. This 2026 STR market report for Cheongju-si, based on AirROI data from February 2025 to January 2026, reveals key trends in the niche market of 194 active listings.
Whether you're considering an Airbnb investment in Cheongju-si, optimizing your existing vacation rental, or exploring rental arbitrage opportunities, understanding the Cheongju-si Airbnb data is crucial. Navigating the high regulation landscape is key to maximizing your short term rental income potential. Let's dive into the specifics.
Key Cheongju-si Airbnb Performance Metrics Overview
Monthly Airbnb Revenue Variations & Income Potential in Cheongju-si (2026)
Understanding the monthly revenue variations for Airbnb listings in Cheongju-si is key to maximizing your short term rental income potential. Seasonality significantly impacts earnings. Our analysis, based on data from the past 12 months, shows that the peak revenue month for STRs in Cheongju-si is typically August, while April often presents the lowest earnings, highlighting opportunities for strategic pricing adjustments during shoulder and low seasons. Explore the typical Airbnb income in Cheongju-si across different performance tiers:
- Best-in-class properties (Top 10%) achieve $2,268+ monthly, often utilizing dynamic pricing and superior guest experiences.
- Strong performing properties (Top 25%) earn $1,352 or more, indicating effective management and desirable locations/amenities.
- Typical properties (Median) generate around $796 per month, representing the average market performance.
- Entry-level properties (Bottom 25%) see earnings around $381, often with potential for optimization.
Average Monthly Airbnb Earnings Trend in Cheongju-si
Cheongju-si Airbnb Occupancy Rate Trends (2026)
Maximize your bookings by understanding the Cheongju-si STR occupancy trends. Seasonal demand shifts significantly influence how often properties are booked. Typically, Februarysees the highest demand (peak season occupancy), while December experiences the lowest (low season). Effective strategies, like adjusting minimum stays or offering promotions, can boost occupancy during slower periods. Here's how different property tiers perform in Cheongju-si:
- Best-in-class properties (Top 10%) achieve 78%+ occupancy, indicating high desirability and potentially optimized availability.
- Strong performing properties (Top 25%) maintain 58% or higher occupancy, suggesting good market fit and guest satisfaction.
- Typical properties (Median) have an occupancy rate around 34%.
- Entry-level properties (Bottom 25%) average 18% occupancy, potentially facing higher vacancy.
Average Monthly Occupancy Rate Trend in Cheongju-si
Average Daily Rate (ADR) Airbnb Trends in Cheongju-si (2026)
Effective short term rental pricing strategy in Cheongju-si involves understanding monthly ADR fluctuations. The Average Daily Rate (ADR) for Airbnb in Cheongju-si typically peaks in October and dips lowest during April. Leveraging Airbnb dynamic pricing tools or strategies based on this seasonality can significantly boost revenue. Here's a look at the typical nightly rates achieved:
- Best-in-class properties (Top 10%) command rates of $198+ per night, often due to premium features or locations.
- Strong performing properties (Top 25%) achieve nightly rates of $95 or more.
- Typical properties (Median) charge around $49 per night.
- Entry-level properties (Bottom 25%) earn around $32 per night.
Average Daily Rate (ADR) Trend by Month in Cheongju-si
Get Live Cheongju-si Market Intelligence 👇

Explore Real-time Analytics
Airbnb Seasonality Analysis & Trends in Cheongju-si (2026)
Peak Season (August, October, November)
- Revenue averages $1,262 per month
- Occupancy rates average 40.6%
- Daily rates average $95
Shoulder Season
- Revenue averages $1,041 per month
- Occupancy maintains around 38.1%
- Daily rates hold near $86
Low Season (February, April, September)
- Revenue drops to average $919 per month
- Occupancy decreases to average 40.4%
- Daily rates adjust to average $80
Seasonality Insights for Cheongju-si
- The Airbnb seasonality in Cheongju-si shows moderate seasonality with distinct peak and low periods. While the sections above show seasonal averages, it's also insightful to look at the extremes:
- During the high season, the absolute peak month showcases Cheongju-si's highest earning potential, with monthly revenues capable of climbing to $1,380, occupancy reaching a high of 45.2%, and ADRs peaking at $98.
- Conversely, the slowest single month of the year, typically falling within the low season, marks the market's lowest point. In this month, revenue might dip to $895, occupancy could drop to 33.5%, and ADRs may adjust down to $73.
- Understanding both the seasonal averages and these monthly peaks and troughs in revenue, occupancy, and ADR is crucial for maximizing your Airbnb profit potential in Cheongju-si.
Seasonal Strategies for Maximizing Profit
- Peak Season: Maximize revenue through premium pricing and potentially longer minimum stays. Ensure high availability.
- Low Season: Offer competitive pricing, special promotions (e.g., extended stay discounts), and flexible cancellation policies. Target off-season travelers like remote workers or budget-conscious guests.
- Shoulder Seasons: Implement dynamic pricing that balances peak and low rates. Target weekend travelers or specific events. Offer slightly more flexible terms than peak season.
- Regularly analyze your own performance against these Cheongju-si seasonality benchmarks and adjust your pricing and availability strategy accordingly.
Best Areas for Airbnb Investment in Cheongju-si (2026)
Exploring the top neighborhoods for short-term rentals in Cheongju-si? This section highlights key areas, outlining why they are attractive for hosts and guests, along with notable local attractions. Consider these locations based on your target guest profile and investment strategy.
| Neighborhood / Area | Why Host Here? (Target Guests & Appeal) | Key Attractions & Landmarks |
|---|---|---|
| Sangdang-gu | A vibrant district known for its historic sites and beautiful nature like Sangdang Sanseong Fortress. It attracts both tourists and locals with its cultural significance and outdoor activities. | Sangdang Sanseong Fortress, Cheongju National Museum, Cheongju Early Printing Museum, Uamsan Mountain, Cheongju City Hall |
| Heungdeok-gu | This area is a bustling part of Cheongju with modern amenities, shopping centers, and a variety of restaurants. It appeals to a range of travelers from families to business professionals. | Lotte Mart, CGV Cheongju, Heungdeok Lake, Cheongju Traditional Market, Dongseong Park |
| Downtown Cheongju | The city's heart with easy access to shops, restaurants, and cultural attractions. Ideal for tourists wanting to experience the local culture and vibrant city life. | Cheongju Art Studio, Cheongju Cultural Center, Beomeo Market, Cheongju City Library, Korean-style marts |
| Ok Mountain | Known for its natural beauty and hiking trails, this area attracts nature lovers and those looking to escape the city while still being close to Cheongju. | Ok Mountain Hiking Trails, Scenic viewpoints, Local wildlife, Picnic areas, Cafes with views |
| Wolgok-dong | A residential area with a peaceful atmosphere, great for families and long-term stays. Close to parks and local schools, it attracts those looking for a quieter experience. | Cheongju Forest Park, Wolgok Lake, Local cafes, Residential areas, Community events |
| Seongbuk-dong | This area features a blend of traditional and modern living, with easy access to main roads and public transport, making it a convenient choice for travelers. | Seongbuk Park, Traditional Korean houses, Local dining spots, Cafes and bakeries, Public transport access |
| Jochon-eup | A quaint town atmosphere with close-knit communities, popular for those looking for a more rural experience while still being within driving distance of Cheongju. | Local farms, Traditional markets, Countryside views, Seasonal festivals, Community activities |
| Hongseong-gun | An emerging area with developing infrastructure that offers unique local experiences and attractions, appealing to adventurous travelers. | Countryside attractions, Local eateries, Cultural experiences, Hiking trails, Scenic drives |
Understanding Airbnb License Requirements & STR Laws in Cheongju-si (2026)
Yes, Cheongju-si, North Chungcheong, South Korea enforces high STR regulations. Obtaining a license and ensuring compliance is almost certainly required according to current 2026 STR laws. Always verify the latest short term rental regulations and Airbnb license requirements directly with local government authorities for Cheongju-si to ensure full compliance before hosting.
(Source: AirROI data, 2026, based on 60% licensed listings)
Top Performing Airbnb Properties in Cheongju-si (2026)
Benchmark your potential! Explore examples of top-performing Airbnb properties in Cheongju-sibased on Trailing Twelve Month (TTM) revenue. Analyze their characteristics, revenue, occupancy rate, and ADR to understand what drives success in this market.

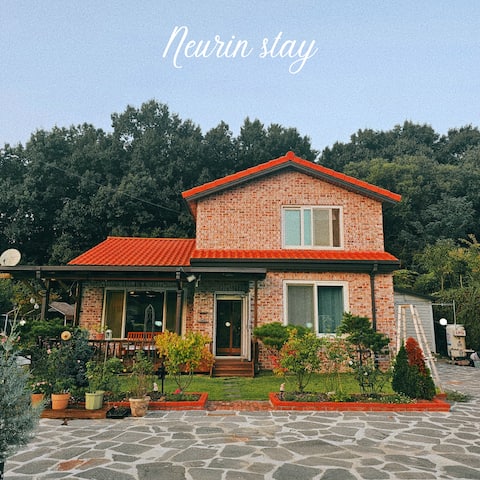
Cheongju Sustay, where the entire hotel is rented to only one team
Entire Place • 11 bedrooms

Hanok Private House: Sol Hwang Stay/Tourism Corporation Excellent Accommodation Support/Precious Peo
Entire Place • 3 bedrooms
Slow Stay # Private Pension # Garden View # 3 Bedrooms # 2 Bathrooms # Barbecue # Party Room # 4-8 P
Entire Place • 3 bedrooms

Jeonhaul Stay/Rural Private Accommodation/300 pyeong yard/55 pyeong private accommodation
Entire Place • 4 bedrooms

Romantic Forest # Cherry Blossom Spot # Maximum 15 People # Lake View # Chungju Lake # Chungju Stati
Entire Place • 2 bedrooms
#Daechung Dam #Okhwa University #Midongsan Arboretum Annex Building
Entire Place • 3 bedrooms
Note: Performance varies based on location, size, amenities, seasonality, and management quality. Data reflects the past 12 months.
Top Performing Airbnb Hosts in Cheongju-si (2026)
Learn from the best! This table showcases top-performing Airbnb hosts in Cheongju-si based on the number of properties managed and estimated total revenue over the past year. Analyze their scale and performance metrics.
| Host Name | Properties | Grossing Revenue | Stay Reviews | Avg Rating |
|---|---|---|---|---|
| Hyesu | 11 | $144,992 | 482 | 4.89/5.0 |
| 니모 | 9 | $137,143 | 719 | 4.89/5.0 |
| 브릭 | 9 | $124,326 | 412 | 4.93/5.0 |
| 테이 | 3 | $118,855 | 12 | 4.50/5.0 |
| Jennifer | 6 | $60,059 | 383 | 4.81/5.0 |
| Nagum | 5 | $59,733 | 421 | 4.87/5.0 |
| 한옥솔솔펜션 | 2 | $59,454 | 29 | 4.63/5.0 |
| 진영 | 1 | $54,184 | 35 | 4.97/5.0 |
| Onda | 2 | $54,154 | 2 | Not Rated |
| Ddnayo | 3 | $45,033 | 3 | Not Rated |
Analyzing the strategies of top hosts, such as their property selection, pricing, and guest communication, can offer valuable lessons for optimizing your own Airbnb operations in Cheongju-si.
Dive Deeper: Advanced Cheongju-si STR Market Data (2026)
Ready to unlock more insights? AirROI provides access to advanced metrics and comprehensive Airbnb data for Cheongju-si. Explore detailed analytics beyond this report to refine your investment strategy, optimize pricing, and maximize your vacation rental profits.
Explore Advanced MetricsCheongju-si Short-Term Rental Market Composition (2026): Property & Room Types
Room Type Distribution
Property Type Distribution
Market Composition Insights for Cheongju-si
- The Cheongju-si Airbnb market composition is heavily skewed towards Entire Home/Apt listings, which make up 84% of the 194 active rentals. This indicates strong guest preference for privacy and space.
- Looking at the property type distribution in Cheongju-si, House properties are the most common (43.3%), reflecting the local real estate landscape.
- Houses represent a significant 43.3% portion, catering likely to families or larger groups.
- The presence of 24.7% Hotel/Boutique listings indicates integration with traditional hospitality.
Cheongju-si Airbnb Room Capacity Analysis (2026): Bedroom Distribution
Distribution of Listings by Number of Bedrooms
Room Capacity Insights for Cheongju-si
- The dominant room capacity in Cheongju-si is 1 bedroom listings, making up 56.7% of the market. This suggests a strong demand for properties suitable for couples or solo travelers.
- Together, 1 bedroom and 2 bedrooms properties represent 77.8% of the active Airbnb listings in Cheongju-si, indicating a high concentration in these sizes.
- With over half the market (56.7%) consisting of studios or 1-bedroom units, Cheongju-si is particularly well-suited for individuals or couples.
Cheongju-si Vacation Rental Guest Capacity Trends (2026)
Distribution of Listings by Guest Capacity
Guest Capacity Insights for Cheongju-si
- The most common guest capacity trend in Cheongju-si vacation rentals is listings accommodating 2 guests (32%). This suggests the primary traveler segment is likely couples or solo travelers.
- Properties designed for 2 guests and 8+ guests dominate the Cheongju-si STR market, accounting for 50.6% of listings.
- 32.5% of properties accommodate 6+ guests, serving the market segment for larger families or group travel in Cheongju-si.
- On average, properties in Cheongju-si are equipped to host 4.0 guests.
Cheongju-si Airbnb Booking Patterns (2026): Available vs. Booked Days
Available Days Distribution
Booked Days Distribution
Booking Pattern Insights for Cheongju-si
- The most common availability pattern in Cheongju-si falls within the 271-366 days range, representing 47.4% of listings. This suggests many properties have significant open periods on their calendars.
- Approximately 80.9% of listings show high availability (181+ days open annually), indicating potential for increased bookings or specific owner usage patterns.
- For booked days, the 91-180 days range is most frequent in Cheongju-si (31.4%), reflecting common guest stay durations or potential owner blocking patterns.
- A notable 21.2% of properties secure long booking periods (181+ days booked per year), highlighting successful long-term rental strategies or significant owner usage.
Cheongju-si Airbnb Minimum Stay Requirements Analysis
Distribution of Listings by Minimum Night Requirement
1 Night
156 listings
80.4% of total
2 Nights
6 listings
3.1% of total
3 Nights
3 listings
1.5% of total
4-6 Nights
12 listings
6.2% of total
7-29 Nights
2 listings
1% of total
30+ Nights
15 listings
7.7% of total
Key Insights
- The most prevalent minimum stay requirement in Cheongju-si is 1 Night, adopted by 80.4% of listings. This highlights the market's preference for shorter, flexible bookings.
- A strong majority (83.5%) of the Cheongju-si Airbnb data shows acceptance of very short stays (1-2 nights), indicating a dynamic, high-turnover market.
Recommendations
- Align with the market by considering a 1 Night minimum stay, as 80.4% of Cheongju-si hosts use this setting.
- Explore offering discounts for stays of 30+ nights to attract the 7.7% of the market seeking extended stays.
- Adjust minimum nights based on seasonality – potentially shorter during low season and longer during peak demand periods in Cheongju-si.
Cheongju-si Airbnb Cancellation Policy Trends Analysis (2026)
Limited
2 listings
1% of total
Flexible
19 listings
9.8% of total
Moderate
59 listings
30.4% of total
Firm
87 listings
44.8% of total
Strict
27 listings
13.9% of total
Cancellation Policy Insights for Cheongju-si
- The prevailing Airbnb cancellation policy trend in Cheongju-si is Firm, used by 44.8% of listings.
- A majority (58.7%) of hosts in Cheongju-si utilize Firm or Strict policies, indicating a market where hosts prioritize booking security.
Recommendations for Hosts
- Consider adopting a Firm policy to align with the 44.8% market standard in Cheongju-si.
- Using a Strict policy might deter some guests, as only 13.9% of listings use it. Evaluate if potential revenue protection outweighs possible lower booking rates.
- Regularly review your cancellation policy against competitors and market demand shifts in Cheongju-si.
Cheongju-si STR Booking Lead Time Analysis (2026)
Average Booking Lead Time by Month
Booking Lead Time Insights for Cheongju-si
- The overall average booking lead time for vacation rentals in Cheongju-si is 22 days.
- Guests book furthest in advance for stays during August (average 26 days), likely coinciding with peak travel demand or local events.
- The shortest booking windows occur for stays in March (average 15 days), indicating more last-minute travel plans during this time.
- Seasonally, Fall (25 days avg.) sees the longest lead times, while Winter (20 days avg.) has the shortest, reflecting typical travel planning cycles.
Recommendations for Hosts
- Use the overall average lead time (22 days) as a baseline for your pricing and availability strategy in Cheongju-si.
- Target marketing efforts for the Fall season well in advance (at least 25 days) to capture early planners.
- Monitor your own booking lead times against these Cheongju-si averages to identify opportunities for dynamic pricing adjustments.
Popular & Essential Airbnb Amenities in Cheongju-si (2026)
Amenity Prevalence
Amenity Insights for Cheongju-si
- Essential amenities in Cheongju-si that guests expect include: Air conditioning, Wifi. Lacking these (any) could significantly impact bookings.
- Popular amenities like Heating, TV, Hair dryer are common but not universal. Offering these can provide a competitive edge.
Recommendations for Hosts
- Ensure your listing includes all essential amenities for Cheongju-si: Air conditioning, Wifi.
- Prioritize adding missing essentials: Air conditioning, Wifi.
- Consider adding popular differentiators like Heating or TV to increase appeal.
- Highlight unique or less common amenities you offer (e.g., hot tub, dedicated workspace, EV charger) in your listing description and photos.
- Regularly check competitor amenities in Cheongju-si to stay competitive.
Cheongju-si Airbnb Guest Demographics & Profile Analysis (2026)
Guest Profile Summary for Cheongju-si
- The typical guest profile for Airbnb in Cheongju-si consists of primarily domestic travelers (77%), often arriving from nearby Seoul, typically belonging to the Post-2000s (Gen Z/Alpha) group (50%), primarily speaking Korean or English.
- Domestic travelers account for 77.4% of guests.
- Key international markets include South Korea (77.4%) and United States (7.7%).
- Top languages spoken are Korean (44.2%) followed by English (36%).
- A significant demographic segment is the Post-2000s (Gen Z/Alpha) group, representing 50% of guests.
Recommendations for Hosts
- Target domestic marketing efforts towards travelers from Seoul and Cheongju-si.
- Tailor amenities and listing descriptions to appeal to the dominant Post-2000s (Gen Z/Alpha) demographic (e.g., highlight fast WiFi, smart home features, local guides).
- Highlight unique local experiences or amenities relevant to the primary guest profile.
- Consider seasonal promotions aligned with peak travel times for key origin markets.
Nearby Short-Term Rental Market Comparison
How does the Cheongju-si Airbnb market stack up against its neighbors? Compare key performance metrics like average monthly revenue, ADR, and occupancy rates in surrounding areas to understand the broader regional STR landscape.
| Market | Active Properties | Monthly Revenue | Daily Rate | Avg. Occupancy |
|---|---|---|---|---|
| Homyeong-ri | 12 | $2,746 | $354.97 | 25% |
| Wondeok-ri | 10 | $2,296 | $221.70 | 36% |
| Sang | 15 | $1,951 | $254.39 | 25% |
| Icheon-ri | 10 | $1,713 | $179.19 | 31% |
| Seorak | 10 | $1,702 | $189.17 | 28% |
| Dojang-ri | 12 | $1,514 | $204.25 | 28% |
| Yeoju-si | 28 | $1,480 | $209.28 | 26% |
| Nomun-ri | 16 | $1,344 | $301.08 | 22% |
| Hwayang-eup | 30 | $1,326 | $180.87 | 26% |
| Jeongbae-ri | 13 | $1,216 | $186.07 | 28% |