Jeonju-si Airbnb Market Analysis 2026: Short Term Rental Data & Vacation Rental Statistics in Jeonbuk State, South Korea
Is Airbnb profitable in Jeonju-si in 2026? Explore comprehensive Airbnb analytics for Jeonju-si, Jeonbuk State, South Korea to uncover income potential. This 2026 STR market report for Jeonju-si, based on AirROI data from February 2025 to January 2026, reveals key trends in the bustling market of 1,168 active listings.
Whether you're considering an Airbnb investment in Jeonju-si, optimizing your existing vacation rental, or exploring rental arbitrage opportunities, understanding the Jeonju-si Airbnb data is crucial. Navigating the high regulation landscape is key to maximizing your short term rental income potential. Let's dive into the specifics.
Key Jeonju-si Airbnb Performance Metrics Overview
Monthly Airbnb Revenue Variations & Income Potential in Jeonju-si (2026)
Understanding the monthly revenue variations for Airbnb listings in Jeonju-si is key to maximizing your short term rental income potential. Seasonality significantly impacts earnings. Our analysis, based on data from the past 12 months, shows that the peak revenue month for STRs in Jeonju-si is typically October, while June often presents the lowest earnings, highlighting opportunities for strategic pricing adjustments during shoulder and low seasons. Explore the typical Airbnb income in Jeonju-si across different performance tiers:
- Best-in-class properties (Top 10%) achieve $2,552+ monthly, often utilizing dynamic pricing and superior guest experiences.
- Strong performing properties (Top 25%) earn $1,324 or more, indicating effective management and desirable locations/amenities.
- Typical properties (Median) generate around $614 per month, representing the average market performance.
- Entry-level properties (Bottom 25%) see earnings around $262, often with potential for optimization.
Average Monthly Airbnb Earnings Trend in Jeonju-si
Jeonju-si Airbnb Occupancy Rate Trends (2026)
Maximize your bookings by understanding the Jeonju-si STR occupancy trends. Seasonal demand shifts significantly influence how often properties are booked. Typically, Februarysees the highest demand (peak season occupancy), while June experiences the lowest (low season). Effective strategies, like adjusting minimum stays or offering promotions, can boost occupancy during slower periods. Here's how different property tiers perform in Jeonju-si:
- Best-in-class properties (Top 10%) achieve 67%+ occupancy, indicating high desirability and potentially optimized availability.
- Strong performing properties (Top 25%) maintain 45% or higher occupancy, suggesting good market fit and guest satisfaction.
- Typical properties (Median) have an occupancy rate around 25%.
- Entry-level properties (Bottom 25%) average 13% occupancy, potentially facing higher vacancy.
Average Monthly Occupancy Rate Trend in Jeonju-si
Average Daily Rate (ADR) Airbnb Trends in Jeonju-si (2026)
Effective short term rental pricing strategy in Jeonju-si involves understanding monthly ADR fluctuations. The Average Daily Rate (ADR) for Airbnb in Jeonju-si typically peaks in August and dips lowest during April. Leveraging Airbnb dynamic pricing tools or strategies based on this seasonality can significantly boost revenue. Here's a look at the typical nightly rates achieved:
- Best-in-class properties (Top 10%) command rates of $190+ per night, often due to premium features or locations.
- Strong performing properties (Top 25%) achieve nightly rates of $117 or more.
- Typical properties (Median) charge around $68 per night.
- Entry-level properties (Bottom 25%) earn around $45 per night.
Average Daily Rate (ADR) Trend by Month in Jeonju-si
Get Live Jeonju-si Market Intelligence 👇

Explore Real-time Analytics
Airbnb Seasonality Analysis & Trends in Jeonju-si (2026)
Peak Season (October, August, May)
- Revenue averages $1,245 per month
- Occupancy rates average 35.7%
- Daily rates average $95
Shoulder Season
- Revenue averages $1,018 per month
- Occupancy maintains around 30.5%
- Daily rates hold near $92
Low Season (March, June, September)
- Revenue drops to average $914 per month
- Occupancy decreases to average 27.6%
- Daily rates adjust to average $92
Seasonality Insights for Jeonju-si
- The Airbnb seasonality in Jeonju-si shows moderate seasonality with distinct peak and low periods. While the sections above show seasonal averages, it's also insightful to look at the extremes:
- During the high season, the absolute peak month showcases Jeonju-si's highest earning potential, with monthly revenues capable of climbing to $1,304, occupancy reaching a high of 36.9%, and ADRs peaking at $97.
- Conversely, the slowest single month of the year, typically falling within the low season, marks the market's lowest point. In this month, revenue might dip to $891, occupancy could drop to 26.0%, and ADRs may adjust down to $89.
- Understanding both the seasonal averages and these monthly peaks and troughs in revenue, occupancy, and ADR is crucial for maximizing your Airbnb profit potential in Jeonju-si.
Seasonal Strategies for Maximizing Profit
- Peak Season: Maximize revenue through premium pricing and potentially longer minimum stays. Ensure high availability.
- Low Season: Offer competitive pricing, special promotions (e.g., extended stay discounts), and flexible cancellation policies. Target off-season travelers like remote workers or budget-conscious guests.
- Shoulder Seasons: Implement dynamic pricing that balances peak and low rates. Target weekend travelers or specific events. Offer slightly more flexible terms than peak season.
- Regularly analyze your own performance against these Jeonju-si seasonality benchmarks and adjust your pricing and availability strategy accordingly.
Best Areas for Airbnb Investment in Jeonju-si (2026)
Exploring the top neighborhoods for short-term rentals in Jeonju-si? This section highlights key areas, outlining why they are attractive for hosts and guests, along with notable local attractions. Consider these locations based on your target guest profile and investment strategy.
| Neighborhood / Area | Why Host Here? (Target Guests & Appeal) | Key Attractions & Landmarks |
|---|---|---|
| Jeonju Hanok Village | A historic area with traditional Korean houses (Hanoks), attracting tourists interested in cultural experiences, local food, and traditional crafts. | Jeondong Catholic Church, Omokdae and Imokdae, Jeonju Traditional Hanok Village, Korean Traditional Music Experience, Nambu Market |
| Namguksa Temple Area | Serene and picturesque, this area is known for its beautiful temples and natural surroundings, appealing to those seeking peaceful retreats and spiritual experiences. | Namguksa Temple, Hyangiram Hermitage, Banchon Hanok Village, Scenic hiking trails |
| Deokjin Park | A popular park known for its beautiful pond and cherry blossoms, attracting families and tourists for outdoor activities and relaxation. | Deokjin Pond, cherry blossom trees, walking trails, sports facilities |
| Jeonju Zoo | A family-friendly area with a local zoo, attracting families and animal lovers looking for activities that cater to children. | Jeonju Zoo, playgrounds, picnic areas, nature trails |
| Jeonju City Center | The bustling heart of Jeonju, filled with shops, restaurants, and cafes, perfect for those seeking urban experiences and conveniences. | Churyeongpo Cultural Center, Nambu Market, local eateries, Jeonju's nightlife |
| Wansan Park | A beautiful park providing scenic views and outdoor activities, suitable for those looking for leisure and outdoor experiences. | hiking trails, open green spaces, community events, picnic areas |
| Jeonju Traditional Food Street | Famous for Jeonju's local culinary delights, this area attracts food enthusiasts eager to taste traditional Korean dishes. | Bibimbap restaurants, street food stalls, traditional tea houses, cooking classes |
| Seosin-dong Street Art Area | A vibrant neighborhood known for its street art and creative spaces, attracting young travelers and art lovers. | street murals, art galleries, local cafes, workshops |
Understanding Airbnb License Requirements & STR Laws in Jeonju-si (2026)
Yes, Jeonju-si, Jeonbuk State, South Korea enforces high STR regulations. Obtaining a license and ensuring compliance is almost certainly required according to current 2026 STR laws. Always verify the latest short term rental regulations and Airbnb license requirements directly with local government authorities for Jeonju-si to ensure full compliance before hosting.
(Source: AirROI data, 2026, based on 72% licensed listings)
Top Performing Airbnb Properties in Jeonju-si (2026)
Benchmark your potential! Explore examples of top-performing Airbnb properties in Jeonju-sibased on Trailing Twelve Month (TTM) revenue. Analyze their characteristics, revenue, occupancy rate, and ADR to understand what drives success in this market.
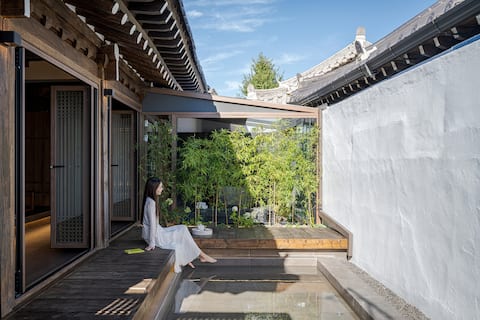
Satisfied. Jeonju Hanok Village Private Pool Villa A day like a "gift"
Entire Place • 1 bedroom
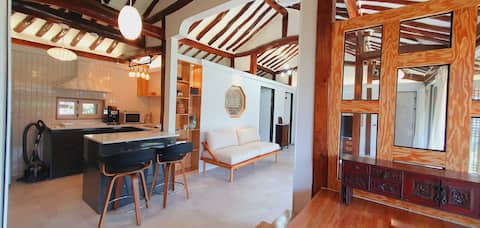
Private house-Jahyeon located in Jeonju Hanok Village
Entire Place • 3 bedrooms
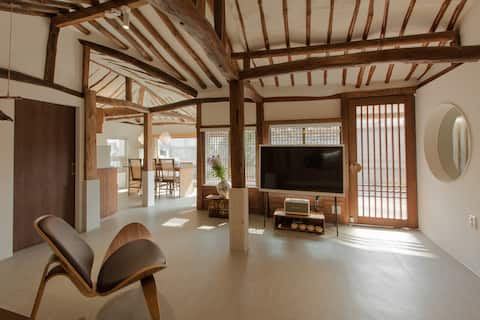
Hanok Stay 'Around', the time when a quiet moment stays in your memory.
Entire Place • 2 bedrooms
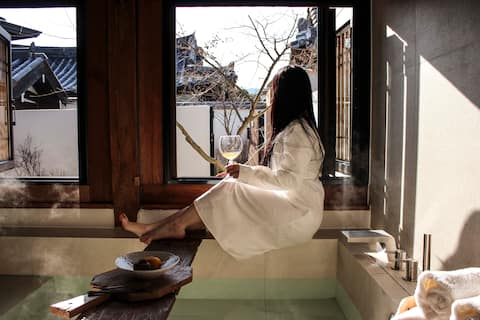
Lalaralan - Lara
Entire Place • 2 bedrooms
The Hanok 123 pyeong private house (main house + love house, 20-30 people)
Entire Place • 7 bedrooms
A peaceful house-type accommodation in the city center surrounded by flower gardens and Hak Mountain
Entire Place • 4 bedrooms
Note: Performance varies based on location, size, amenities, seasonality, and management quality. Data reflects the past 12 months.
Top Performing Airbnb Hosts in Jeonju-si (2026)
Learn from the best! This table showcases top-performing Airbnb hosts in Jeonju-si based on the number of properties managed and estimated total revenue over the past year. Analyze their scale and performance metrics.
| Host Name | Properties | Grossing Revenue | Stay Reviews | Avg Rating |
|---|---|---|---|---|
| H.S | 6 | $259,577 | 541 | 4.97/5.0 |
| 진선 | 4 | $195,686 | 167 | 4.91/5.0 |
| 왕근 | 3 | $191,821 | 774 | 4.94/5.0 |
| 현정 | 7 | $139,136 | 330 | 4.81/5.0 |
| Awake Time | 4 | $123,309 | 253 | 4.83/5.0 |
| 더한옥 | 5 | $122,961 | 84 | 4.78/5.0 |
| 현진 | 6 | $120,849 | 507 | 4.90/5.0 |
| 성남 | 2 | $119,986 | 65 | 5.00/5.0 |
| 선진 | 3 | $116,294 | 48 | 4.97/5.0 |
| Onda | 22 | $114,510 | 111 | 4.82/5.0 |
Analyzing the strategies of top hosts, such as their property selection, pricing, and guest communication, can offer valuable lessons for optimizing your own Airbnb operations in Jeonju-si.
Dive Deeper: Advanced Jeonju-si STR Market Data (2026)
Ready to unlock more insights? AirROI provides access to advanced metrics and comprehensive Airbnb data for Jeonju-si. Explore detailed analytics beyond this report to refine your investment strategy, optimize pricing, and maximize your vacation rental profits.
Explore Advanced MetricsJeonju-si Short-Term Rental Market Composition (2026): Property & Room Types
Room Type Distribution
Property Type Distribution
Market Composition Insights for Jeonju-si
- The Jeonju-si Airbnb market composition is heavily skewed towards Entire Home/Apt listings, which make up 55% of the 1,168 active rentals. This indicates strong guest preference for privacy and space.
- However, a notable 43.3% share for Private Rooms suggests opportunities for budget-conscious travelers or hosts renting out spare rooms.
- Looking at the property type distribution in Jeonju-si, House properties are the most common (52.2%), reflecting the local real estate landscape.
- Houses represent a significant 52.2% portion, catering likely to families or larger groups.
- The presence of 37% Hotel/Boutique listings indicates integration with traditional hospitality.
- Smaller segments like others, outdoor/unique (combined 3.6%) offer potential for unique stay experiences.
Jeonju-si Airbnb Room Capacity Analysis (2026): Bedroom Distribution
Distribution of Listings by Number of Bedrooms
Room Capacity Insights for Jeonju-si
- The dominant room capacity in Jeonju-si is 1 bedroom listings, making up 48.1% of the market. This suggests a strong demand for properties suitable for couples or solo travelers.
- Together, 1 bedroom and 2 bedrooms properties represent 63.6% of the active Airbnb listings in Jeonju-si, indicating a high concentration in these sizes.
Jeonju-si Vacation Rental Guest Capacity Trends (2026)
Distribution of Listings by Guest Capacity
Guest Capacity Insights for Jeonju-si
- The most common guest capacity trend in Jeonju-si vacation rentals is listings accommodating 2 guests (25.1%). This suggests the primary traveler segment is likely couples or solo travelers.
- Properties designed for 2 guests and 4 guests dominate the Jeonju-si STR market, accounting for 44.4% of listings.
- 23.4% of properties accommodate 6+ guests, serving the market segment for larger families or group travel in Jeonju-si.
- On average, properties in Jeonju-si are equipped to host 3.4 guests.
Jeonju-si Airbnb Booking Patterns (2026): Available vs. Booked Days
Available Days Distribution
Booked Days Distribution
Booking Pattern Insights for Jeonju-si
- The most common availability pattern in Jeonju-si falls within the 271-366 days range, representing 65.2% of listings. This suggests many properties have significant open periods on their calendars.
- Approximately 88.9% of listings show high availability (181+ days open annually), indicating potential for increased bookings or specific owner usage patterns.
- For booked days, the 31-90 days range is most frequent in Jeonju-si (35.8%), reflecting common guest stay durations or potential owner blocking patterns.
- A notable 11.8% of properties secure long booking periods (181+ days booked per year), highlighting successful long-term rental strategies or significant owner usage.
Jeonju-si Airbnb Minimum Stay Requirements Analysis
Distribution of Listings by Minimum Night Requirement
1 Night
1127 listings
96.5% of total
2 Nights
11 listings
0.9% of total
4-6 Nights
5 listings
0.4% of total
7-29 Nights
1 listings
0.1% of total
30+ Nights
24 listings
2.1% of total
Key Insights
- The most prevalent minimum stay requirement in Jeonju-si is 1 Night, adopted by 96.5% of listings. This highlights the market's preference for shorter, flexible bookings.
- A strong majority (97.4%) of the Jeonju-si Airbnb data shows acceptance of very short stays (1-2 nights), indicating a dynamic, high-turnover market.
- Dedicated monthly rentals (30+ nights) represent a small niche (2.1%), possibly an untapped area for hosts.
Recommendations
- Align with the market by considering a 1 Night minimum stay, as 96.5% of Jeonju-si hosts use this setting.
- Adjust minimum nights based on seasonality – potentially shorter during low season and longer during peak demand periods in Jeonju-si.
Jeonju-si Airbnb Cancellation Policy Trends Analysis (2026)
Limited
6 listings
0.5% of total
Flexible
110 listings
9.4% of total
Moderate
659 listings
56.4% of total
Firm
299 listings
25.6% of total
Strict
94 listings
8% of total
Cancellation Policy Insights for Jeonju-si
- The prevailing Airbnb cancellation policy trend in Jeonju-si is Moderate, used by 56.4% of listings.
- There's a relatively balanced mix between guest-friendly (65.8%) and stricter (33.6%) policies, offering choices for different guest needs.
- Strict cancellation policies are quite rare (8%), potentially making listings with this policy less competitive unless justified by high demand or property type.
Recommendations for Hosts
- Consider adopting a Moderate policy to align with the 56.4% market standard in Jeonju-si.
- Using a Strict policy might deter some guests, as only 8% of listings use it. Evaluate if potential revenue protection outweighs possible lower booking rates.
- Regularly review your cancellation policy against competitors and market demand shifts in Jeonju-si.
Jeonju-si STR Booking Lead Time Analysis (2026)
Average Booking Lead Time by Month
Booking Lead Time Insights for Jeonju-si
- The overall average booking lead time for vacation rentals in Jeonju-si is 31 days.
- Guests book furthest in advance for stays during October (average 48 days), likely coinciding with peak travel demand or local events.
- The shortest booking windows occur for stays in February (average 17 days), indicating more last-minute travel plans during this time.
- Seasonally, Fall (41 days avg.) sees the longest lead times, while Winter (28 days avg.) has the shortest, reflecting typical travel planning cycles.
Recommendations for Hosts
- Use the overall average lead time (31 days) as a baseline for your pricing and availability strategy in Jeonju-si.
- For October stays, consider implementing length-of-stay discounts or slightly higher rates for bookings made less than 48 days out to capitalize on advance planning.
- Target marketing efforts for the Fall season well in advance (at least 41 days) to capture early planners.
- Monitor your own booking lead times against these Jeonju-si averages to identify opportunities for dynamic pricing adjustments.
Popular & Essential Airbnb Amenities in Jeonju-si (2026)
Amenity Prevalence
Amenity Insights for Jeonju-si
- Essential amenities in Jeonju-si that guests expect include: Air conditioning, Wifi, Heating. Lacking these (any) could significantly impact bookings.
- Popular amenities like Hair dryer, Shampoo, TV are common but not universal. Offering these can provide a competitive edge.
Recommendations for Hosts
- Ensure your listing includes all essential amenities for Jeonju-si: Air conditioning, Wifi, Heating.
- Prioritize adding missing essentials: Air conditioning, Wifi, Heating.
- Consider adding popular differentiators like Hair dryer or Shampoo to increase appeal.
- Highlight unique or less common amenities you offer (e.g., hot tub, dedicated workspace, EV charger) in your listing description and photos.
- Regularly check competitor amenities in Jeonju-si to stay competitive.
Jeonju-si Airbnb Guest Demographics & Profile Analysis (2026)
Guest Profile Summary for Jeonju-si
- The typical guest profile for Airbnb in Jeonju-si consists of a mix of domestic (63%) and international guests, often arriving from nearby Seoul, typically belonging to the Post-2000s (Gen Z/Alpha) group (50%), primarily speaking English or Korean.
- Domestic travelers account for 63.0% of guests.
- Key international markets include South Korea (63%) and United States (8.1%).
- Top languages spoken are English (36.8%) followed by Korean (31.5%).
- A significant demographic segment is the Post-2000s (Gen Z/Alpha) group, representing 50% of guests.
Recommendations for Hosts
- Target domestic marketing efforts towards travelers from Seoul and Jeonju-si.
- Tailor amenities and listing descriptions to appeal to the dominant Post-2000s (Gen Z/Alpha) demographic (e.g., highlight fast WiFi, smart home features, local guides).
- Highlight unique local experiences or amenities relevant to the primary guest profile.
- Consider seasonal promotions aligned with peak travel times for key origin markets.
Nearby Short-Term Rental Market Comparison
How does the Jeonju-si Airbnb market stack up against its neighbors? Compare key performance metrics like average monthly revenue, ADR, and occupancy rates in surrounding areas to understand the broader regional STR landscape.
| Market | Active Properties | Monthly Revenue | Daily Rate | Avg. Occupancy |
|---|---|---|---|---|
| Hwayang-eup | 30 | $1,326 | $180.87 | 26% |
| Buyeo-eup | 11 | $1,185 | $121.79 | 33% |
| Chunyang-myeon | 18 | $1,149 | $115.65 | 40% |
| Janggok-ri | 10 | $1,145 | $150.75 | 28% |
| Gui-myeon | 11 | $1,124 | $173.21 | 24% |
| Jeongeup-si | 26 | $1,057 | $147.63 | 28% |
| Nonsan-si | 23 | $1,057 | $143.44 | 29% |
| Sangju-si | 15 | $1,040 | $146.10 | 22% |
| Hakdong-ri | 22 | $1,023 | $173.05 | 27% |
| Yeongcheon-si | 18 | $1,015 | $139.98 | 26% |