Milnerton Airbnb Market Analysis 2026: Short Term Rental Data & Vacation Rental Statistics in Western Cape, South Africa
Is Airbnb profitable in Milnerton in 2026? Explore comprehensive Airbnb analytics for Milnerton, Western Cape, South Africa to uncover income potential. This 2026 STR market report for Milnerton, based on AirROI data from February 2025 to January 2026, reveals key trends in the market of 553 active listings.
Whether you're considering an Airbnb investment in Milnerton, optimizing your existing vacation rental, or exploring rental arbitrage opportunities, understanding the Milnerton Airbnb data is crucial. Leveraging the low regulation environment is key to maximizing your short term rental income potential. Let's dive into the specifics.
Key Milnerton Airbnb Performance Metrics Overview
Monthly Airbnb Revenue Variations & Income Potential in Milnerton (2026)
Understanding the monthly revenue variations for Airbnb listings in Milnerton is key to maximizing your short term rental income potential. Seasonality significantly impacts earnings. Our analysis, based on data from the past 12 months, shows that the peak revenue month for STRs in Milnerton is typically December, while May often presents the lowest earnings, highlighting opportunities for strategic pricing adjustments during shoulder and low seasons. Explore the typical Airbnb income in Milnerton across different performance tiers:
- Best-in-class properties (Top 10%) achieve $2,918+ monthly, often utilizing dynamic pricing and superior guest experiences.
- Strong performing properties (Top 25%) earn $1,872 or more, indicating effective management and desirable locations/amenities.
- Typical properties (Median) generate around $1,021 per month, representing the average market performance.
- Entry-level properties (Bottom 25%) see earnings around $481, often with potential for optimization.
Average Monthly Airbnb Earnings Trend in Milnerton
Milnerton Airbnb Occupancy Rate Trends (2026)
Maximize your bookings by understanding the Milnerton STR occupancy trends. Seasonal demand shifts significantly influence how often properties are booked. Typically, Februarysees the highest demand (peak season occupancy), while June experiences the lowest (low season). Effective strategies, like adjusting minimum stays or offering promotions, can boost occupancy during slower periods. Here's how different property tiers perform in Milnerton:
- Best-in-class properties (Top 10%) achieve 83%+ occupancy, indicating high desirability and potentially optimized availability.
- Strong performing properties (Top 25%) maintain 65% or higher occupancy, suggesting good market fit and guest satisfaction.
- Typical properties (Median) have an occupancy rate around 39%.
- Entry-level properties (Bottom 25%) average 18% occupancy, potentially facing higher vacancy.
Average Monthly Occupancy Rate Trend in Milnerton
Average Daily Rate (ADR) Airbnb Trends in Milnerton (2026)
Effective short term rental pricing strategy in Milnerton involves understanding monthly ADR fluctuations. The Average Daily Rate (ADR) for Airbnb in Milnerton typically peaks in December and dips lowest during August. Leveraging Airbnb dynamic pricing tools or strategies based on this seasonality can significantly boost revenue. Here's a look at the typical nightly rates achieved:
- Best-in-class properties (Top 10%) command rates of $206+ per night, often due to premium features or locations.
- Strong performing properties (Top 25%) achieve nightly rates of $140 or more.
- Typical properties (Median) charge around $92 per night.
- Entry-level properties (Bottom 25%) earn around $62 per night.
Average Daily Rate (ADR) Trend by Month in Milnerton
Get Live Milnerton Market Intelligence 👇

Explore Real-time Analytics
Airbnb Seasonality Analysis & Trends in Milnerton (2026)
Peak Season (December, February, November)
- Revenue averages $1,963 per month
- Occupancy rates average 50.2%
- Daily rates average $133
Shoulder Season
- Revenue averages $1,396 per month
- Occupancy maintains around 42.5%
- Daily rates hold near $120
Low Season (May, June, August)
- Revenue drops to average $988 per month
- Occupancy decreases to average 34.8%
- Daily rates adjust to average $110
Seasonality Insights for Milnerton
- The Airbnb seasonality in Milnerton shows highly seasonal trends requiring careful strategy. While the sections above show seasonal averages, it's also insightful to look at the extremes:
- During the high season, the absolute peak month showcases Milnerton's highest earning potential, with monthly revenues capable of climbing to $2,217, occupancy reaching a high of 59.1%, and ADRs peaking at $146.
- Conversely, the slowest single month of the year, typically falling within the low season, marks the market's lowest point. In this month, revenue might dip to $921, occupancy could drop to 32.2%, and ADRs may adjust down to $109.
- Understanding both the seasonal averages and these monthly peaks and troughs in revenue, occupancy, and ADR is crucial for maximizing your Airbnb profit potential in Milnerton.
Seasonal Strategies for Maximizing Profit
- Peak Season: Maximize revenue through premium pricing and potentially longer minimum stays. Ensure high availability.
- Low Season: Offer competitive pricing, special promotions (e.g., extended stay discounts), and flexible cancellation policies. Target off-season travelers like remote workers or budget-conscious guests.
- Shoulder Seasons: Implement dynamic pricing that balances peak and low rates. Target weekend travelers or specific events. Offer slightly more flexible terms than peak season.
- Regularly analyze your own performance against these Milnerton seasonality benchmarks and adjust your pricing and availability strategy accordingly.
Best Areas for Airbnb Investment in Milnerton (2026)
Exploring the top neighborhoods for short-term rentals in Milnerton? This section highlights key areas, outlining why they are attractive for hosts and guests, along with notable local attractions. Consider these locations based on your target guest profile and investment strategy.
| Neighborhood / Area | Why Host Here? (Target Guests & Appeal) | Key Attractions & Landmarks |
|---|---|---|
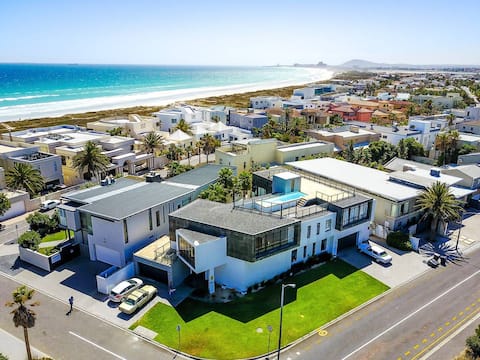
| Milnerton Beach | A scenic beachfront area popular for water sports, sunbathing, and stunning views of Table Mountain. Ideal for tourists looking for a beach vacation close to Cape Town. | Milnerton Beach, Table Mountain, Milnerton Lighthouse, Rietvlei Nature Reserve, Sunset Beach, Woodbridge Island |
| Pavilion Shopping Centre | A major shopping hub in Milnerton, attracting both locals and tourists. Perfect for Airbnb hosts looking to cater to shoppers and those exploring the area. | Pavilion Shopping Centre, Milnerton Golf Club, Various dining options, Local markets, Nearby parks |
| Century City | A vibrant urban district close to Milnerton, featuring modern amenities, business centers, and the well-known Canal Walk Mall. Great for guests seeking a mix of leisure and business. | Canal Walk Shopping Centre, Intaka Island, Century City Conference Centre, Ratanga Junction, Urban parks |
| Table View | Known for its stunning views of Table Mountain and proximity to beach activities, this area attracts families and adventure seekers looking for an active vacation. | Table View Beach, Bloubergstrand, Kite surfing spots, Local restaurants, Public parks |
| Rietvlei Reserve | A natural area promoting outdoor activities such as bird watching and cycling. Ideal for tourists wanting to connect with nature while staying close to urban amenities. | Rietvlei Nature Reserve, Bird watching opportunities, Cycling trails, Picnic areas, Scenic views of the lagoon |
| Woodbridge Island | An exclusive residential area with easy beach access and beautiful views. Suitable for tourists seeking luxury Airbnb options in a peaceful setting. | Woodbridge Island Beach, Lovely walking paths, Close proximity to cafes and shops, Stunning views of Table Mountain |
| Milnerton Golf Club | An excellent spot for golf enthusiasts, offering well-maintained greens and a beautiful setting. Attracts visitors who enjoy sports and leisure activities. | Milnerton Golf Club, Clubhouse dining, Golf tournaments |
| Sunset Beach | A quieter beach area known for its picturesque sunsets and relaxed atmosphere. Great for families and couples looking for a serene getaway. | Sunset Beach, Walking paths, Local eateries, Fishing spots, Surfing opportunities |
Understanding Airbnb License Requirements & STR Laws in Milnerton (2026)
While Milnerton, Western Cape, South Africa currently shows low STR regulations, specific Airbnb license requirements might still exist or change. Always verify the latest short term rental regulations and Airbnb license requirements directly with local government authorities for Milnerton to ensure full compliance before hosting.
(Source: AirROI data, 2026, based on 1% licensed listings)
Top Performing Airbnb Properties in Milnerton (2026)
Benchmark your potential! Explore examples of top-performing Airbnb properties in Milnertonbased on Trailing Twelve Month (TTM) revenue. Analyze their characteristics, revenue, occupancy rate, and ADR to understand what drives success in this market.
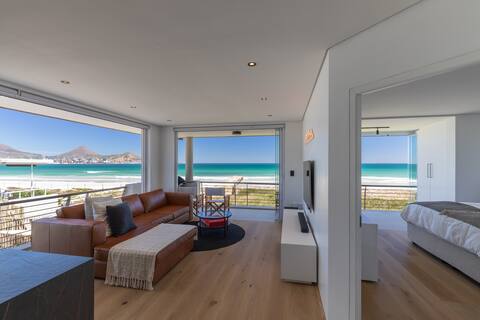
Villa Sunset Beach with rooftop pool & nice view
Entire Place • 9 bedrooms

Beachfront Lodge - First row on the Spot
Entire Place • 3 bedrooms

Beach Penthouse - Rooftop BBQ & Jacuzzi
Entire Place • 2 bedrooms
201 Beach Vista, Cape Town
Entire Place • 2 bedrooms
Ocean Front Beach House
Entire Place • 4 bedrooms
25% off Grand Penthouse / Backup Power / Stunning
Entire Place • 3 bedrooms
Note: Performance varies based on location, size, amenities, seasonality, and management quality. Data reflects the past 12 months.
Top Performing Airbnb Hosts in Milnerton (2026)
Learn from the best! This table showcases top-performing Airbnb hosts in Milnerton based on the number of properties managed and estimated total revenue over the past year. Analyze their scale and performance metrics.
| Host Name | Properties | Grossing Revenue | Stay Reviews | Avg Rating |
|---|---|---|---|---|
| Brett | 18 | $331,743 | 2203 | 4.85/5.0 |
| Safeera | 6 | $189,202 | 284 | 4.80/5.0 |
| Ken | 22 | $173,984 | 160 | 4.94/5.0 |
| Bianca | 1 | $165,067 | 61 | 4.75/5.0 |
| Rene | 5 | $147,024 | 142 | 4.84/5.0 |
| Host Agents | 16 | $146,804 | 207 | 4.29/5.0 |
| Georg | 3 | $146,077 | 45 | 4.99/5.0 |
| Mohammed | 5 | $143,267 | 182 | 4.80/5.0 |
| Zelda | 3 | $132,831 | 478 | 4.95/5.0 |
| Martina | 4 | $115,459 | 62 | 4.84/5.0 |
Analyzing the strategies of top hosts, such as their property selection, pricing, and guest communication, can offer valuable lessons for optimizing your own Airbnb operations in Milnerton.
Dive Deeper: Advanced Milnerton STR Market Data (2026)
Ready to unlock more insights? AirROI provides access to advanced metrics and comprehensive Airbnb data for Milnerton. Explore detailed analytics beyond this report to refine your investment strategy, optimize pricing, and maximize your vacation rental profits.
Explore Advanced MetricsMilnerton Short-Term Rental Market Composition (2026): Property & Room Types
Room Type Distribution
Property Type Distribution
Market Composition Insights for Milnerton
- The Milnerton Airbnb market composition is heavily skewed towards Entire Home/Apt listings, which make up 86.6% of the 553 active rentals. This indicates strong guest preference for privacy and space.
- Looking at the property type distribution in Milnerton, Apartment/Condo properties are the most common (69.8%), reflecting the local real estate landscape.
- Houses represent a significant 21.3% portion, catering likely to families or larger groups.
- Smaller segments like others, hotel/boutique, outdoor/unique (combined 8.9%) offer potential for unique stay experiences.
Milnerton Airbnb Room Capacity Analysis (2026): Bedroom Distribution
Distribution of Listings by Number of Bedrooms
Room Capacity Insights for Milnerton
- The dominant room capacity in Milnerton is 1 bedroom listings, making up 38.5% of the market. This suggests a strong demand for properties suitable for couples or solo travelers.
- Together, 1 bedroom and 2 bedrooms properties represent 73.9% of the active Airbnb listings in Milnerton, indicating a high concentration in these sizes.
Milnerton Vacation Rental Guest Capacity Trends (2026)
Distribution of Listings by Guest Capacity
Guest Capacity Insights for Milnerton
- The most common guest capacity trend in Milnerton vacation rentals is listings accommodating 2 guests (38.3%). This suggests the primary traveler segment is likely couples or solo travelers.
- Properties designed for 2 guests and 4 guests dominate the Milnerton STR market, accounting for 72.8% of listings.
- 13.4% of properties accommodate 6+ guests, serving the market segment for larger families or group travel in Milnerton.
- On average, properties in Milnerton are equipped to host 3.3 guests.
Milnerton Airbnb Booking Patterns (2026): Available vs. Booked Days
Available Days Distribution
Booked Days Distribution
Booking Pattern Insights for Milnerton
- The most common availability pattern in Milnerton falls within the 271-366 days range, representing 54.4% of listings. This suggests many properties have significant open periods on their calendars.
- Approximately 82.2% of listings show high availability (181+ days open annually), indicating potential for increased bookings or specific owner usage patterns.
- For booked days, the 31-90 days range is most frequent in Milnerton (32.5%), reflecting common guest stay durations or potential owner blocking patterns.
- A notable 19.4% of properties secure long booking periods (181+ days booked per year), highlighting successful long-term rental strategies or significant owner usage.
Milnerton Airbnb Minimum Stay Requirements Analysis
Distribution of Listings by Minimum Night Requirement
1 Night
103 listings
18.6% of total
2 Nights
106 listings
19.2% of total
3 Nights
32 listings
5.8% of total
4-6 Nights
53 listings
9.6% of total
7-29 Nights
26 listings
4.7% of total
30+ Nights
233 listings
42.1% of total
Key Insights
- The most prevalent minimum stay requirement in Milnerton is 30+ Nights, adopted by 42.1% of listings. This highlights the market's preference for longer commitments.
- A significant segment (42.1%) caters to monthly stays (30+ nights) in Milnerton, pointing to opportunities in the extended-stay market.
Recommendations
- Align with the market by considering a 30+ Nights minimum stay, as 42.1% of Milnerton hosts use this setting.
- If feasible, allowing 1-night stays, especially midweek or during low season, could capture last-minute bookings, as only 18.6% currently do.
- Explore offering discounts for stays of 30+ nights to attract the 42.1% of the market seeking extended stays.
- Adjust minimum nights based on seasonality – potentially shorter during low season and longer during peak demand periods in Milnerton.
Milnerton Airbnb Cancellation Policy Trends Analysis (2026)
Limited
17 listings
3.1% of total
Refundable
18 listings
3.3% of total
Non-refundable
8 listings
1.5% of total
Super Strict 30 Days
25 listings
4.5% of total
Super Strict 60 Days
5 listings
0.9% of total
Flexible
76 listings
13.8% of total
Moderate
148 listings
26.9% of total
Firm
213 listings
38.7% of total
Strict
41 listings
7.4% of total
Cancellation Policy Insights for Milnerton
- The prevailing Airbnb cancellation policy trend in Milnerton is Firm, used by 38.7% of listings.
- There's a relatively balanced mix between guest-friendly (40.7%) and stricter (46.1%) policies, offering choices for different guest needs.
- Strict cancellation policies are quite rare (7.4%), potentially making listings with this policy less competitive unless justified by high demand or property type.
Recommendations for Hosts
- Consider adopting a Firm policy to align with the 38.7% market standard in Milnerton.
- Using a Strict policy might deter some guests, as only 7.4% of listings use it. Evaluate if potential revenue protection outweighs possible lower booking rates.
- Regularly review your cancellation policy against competitors and market demand shifts in Milnerton.
Milnerton STR Booking Lead Time Analysis (2026)
Average Booking Lead Time by Month
Booking Lead Time Insights for Milnerton
- The overall average booking lead time for vacation rentals in Milnerton is 44 days.
- Guests book furthest in advance for stays during December (average 80 days), likely coinciding with peak travel demand or local events.
- The shortest booking windows occur for stays in June (average 15 days), indicating more last-minute travel plans during this time.
- Seasonally, Winter (64 days avg.) sees the longest lead times, while Summer (22 days avg.) has the shortest, reflecting typical travel planning cycles.
Recommendations for Hosts
- Use the overall average lead time (44 days) as a baseline for your pricing and availability strategy in Milnerton.
- For December stays, consider implementing length-of-stay discounts or slightly higher rates for bookings made less than 80 days out to capitalize on advance planning.
- Target marketing efforts for the Winter season well in advance (at least 64 days) to capture early planners.
- Monitor your own booking lead times against these Milnerton averages to identify opportunities for dynamic pricing adjustments.
Popular & Essential Airbnb Amenities in Milnerton (2026)
Amenity Prevalence
Amenity Insights for Milnerton
- Essential amenities in Milnerton that guests expect include: Wifi. Lacking these (this) could significantly impact bookings.
- Popular amenities like TV, Free parking on premises, Kitchen are common but not universal. Offering these can provide a competitive edge.
Recommendations for Hosts
- Ensure your listing includes all essential amenities for Milnerton: Wifi.
- Prioritize adding missing essentials: Wifi.
- Consider adding popular differentiators like TV or Free parking on premises to increase appeal.
- Highlight unique or less common amenities you offer (e.g., hot tub, dedicated workspace, EV charger) in your listing description and photos.
- Regularly check competitor amenities in Milnerton to stay competitive.
Milnerton Airbnb Guest Demographics & Profile Analysis (2026)
Guest Profile Summary for Milnerton
- The typical guest profile for Airbnb in Milnerton consists of a mix of domestic (56%) and international guests, often arriving from nearby Cape Town, typically belonging to the Post-2000s (Gen Z/Alpha) group (50%), primarily speaking English or Afrikaans.
- Domestic travelers account for 55.8% of guests.
- Key international markets include South Africa (55.8%) and United States (7.2%).
- Top languages spoken are English (56.7%) followed by Afrikaans (12%).
- A significant demographic segment is the Post-2000s (Gen Z/Alpha) group, representing 50% of guests.
Recommendations for Hosts
- Balance marketing efforts between domestic and international channels based on the guest mix.
- Tailor amenities and listing descriptions to appeal to the dominant Post-2000s (Gen Z/Alpha) demographic (e.g., highlight fast WiFi, smart home features, local guides).
- Highlight unique local experiences or amenities relevant to the primary guest profile.
- Consider seasonal promotions aligned with peak travel times for key origin markets.
Nearby Short-Term Rental Market Comparison
How does the Milnerton Airbnb market stack up against its neighbors? Compare key performance metrics like average monthly revenue, ADR, and occupancy rates in surrounding areas to understand the broader regional STR landscape.
| Market | Active Properties | Monthly Revenue | Daily Rate | Avg. Occupancy |
|---|---|---|---|---|
| Stellenbosch Local Municipality | 1,297 | $1,821 | $186.76 | 43% |
| Cape Town | 13,044 | $1,682 | $181.11 | 44% |
| Noordhoek | 225 | $1,582 | $219.93 | 40% |
| Hout Bay | 507 | $1,568 | $201.25 | 41% |
| Sir Lowry's Pass | 19 | $1,427 | $150.64 | 40% |
| Witzenberg Local Municipality | 257 | $1,349 | $133.58 | 35% |
| Simon's Town | 268 | $1,337 | $145.44 | 40% |
| Overstrand Local Municipality | 1,817 | $1,296 | $175.43 | 33% |
| Pine Haven | 11 | $1,254 | $156.97 | 39% |
| Robertson | 12 | $1,101 | $105.42 | 43% |