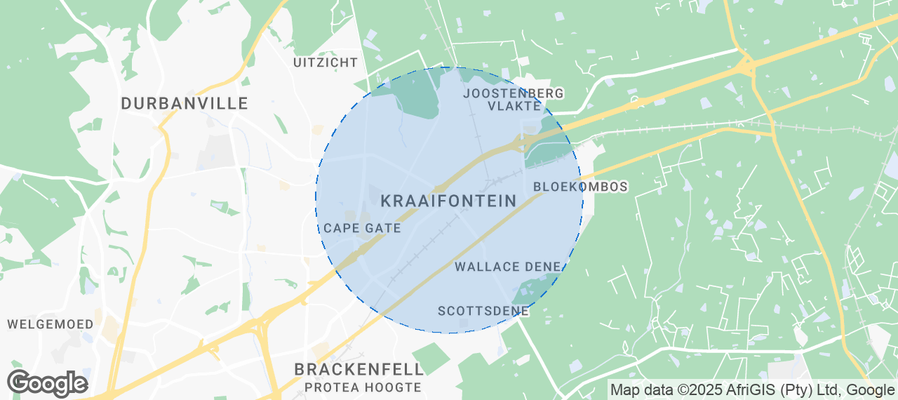
Kraaifontein Airbnb Market Analysis 2026: Short Term Rental Data & Vacation Rental Statistics in Western Cape, South Africa
Is Airbnb profitable in Kraaifontein in 2026? Explore comprehensive Airbnb analytics for Kraaifontein, Western Cape, South Africa to uncover income potential. This 2026 STR market report for Kraaifontein, based on AirROI data from February 2025 to January 2026, reveals key trends in the niche market of 58 active listings.
Whether you're considering an Airbnb investment in Kraaifontein, optimizing your existing vacation rental, or exploring rental arbitrage opportunities, understanding the Kraaifontein Airbnb data is crucial. Leveraging the low regulation environment is key to maximizing your short term rental income potential. Let's dive into the specifics.
Key Kraaifontein Airbnb Performance Metrics Overview
Monthly Airbnb Revenue Variations & Income Potential in Kraaifontein (2026)
Understanding the monthly revenue variations for Airbnb listings in Kraaifontein is key to maximizing your short term rental income potential. Seasonality significantly impacts earnings. Our analysis, based on data from the past 12 months, shows that the peak revenue month for STRs in Kraaifontein is typically December, while September often presents the lowest earnings, highlighting opportunities for strategic pricing adjustments during shoulder and low seasons. Explore the typical Airbnb income in Kraaifontein across different performance tiers:
- Best-in-class properties (Top 10%) achieve $2,078+ monthly, often utilizing dynamic pricing and superior guest experiences.
- Strong performing properties (Top 25%) earn $1,079 or more, indicating effective management and desirable locations/amenities.
- Typical properties (Median) generate around $549 per month, representing the average market performance.
- Entry-level properties (Bottom 25%) see earnings around $267, often with potential for optimization.
Average Monthly Airbnb Earnings Trend in Kraaifontein
Kraaifontein Airbnb Occupancy Rate Trends (2026)
Maximize your bookings by understanding the Kraaifontein STR occupancy trends. Seasonal demand shifts significantly influence how often properties are booked. Typically, Februarysees the highest demand (peak season occupancy), while September experiences the lowest (low season). Effective strategies, like adjusting minimum stays or offering promotions, can boost occupancy during slower periods. Here's how different property tiers perform in Kraaifontein:
- Best-in-class properties (Top 10%) achieve 77%+ occupancy, indicating high desirability and potentially optimized availability.
- Strong performing properties (Top 25%) maintain 60% or higher occupancy, suggesting good market fit and guest satisfaction.
- Typical properties (Median) have an occupancy rate around 37%.
- Entry-level properties (Bottom 25%) average 17% occupancy, potentially facing higher vacancy.
Average Monthly Occupancy Rate Trend in Kraaifontein
Average Daily Rate (ADR) Airbnb Trends in Kraaifontein (2026)
Effective short term rental pricing strategy in Kraaifontein involves understanding monthly ADR fluctuations. The Average Daily Rate (ADR) for Airbnb in Kraaifontein typically peaks in January and dips lowest during April. Leveraging Airbnb dynamic pricing tools or strategies based on this seasonality can significantly boost revenue. Here's a look at the typical nightly rates achieved:
- Best-in-class properties (Top 10%) command rates of $136+ per night, often due to premium features or locations.
- Strong performing properties (Top 25%) achieve nightly rates of $91 or more.
- Typical properties (Median) charge around $50 per night.
- Entry-level properties (Bottom 25%) earn around $37 per night.
Average Daily Rate (ADR) Trend by Month in Kraaifontein
Get Live Kraaifontein Market Intelligence 👇
Explore Real-time Analytics
Airbnb Seasonality Analysis & Trends in Kraaifontein (2026)
Peak Season (December, March, February)
- Revenue averages $1,083 per month
- Occupancy rates average 52.2%
- Daily rates average $70
Shoulder Season
- Revenue averages $859 per month
- Occupancy maintains around 38.6%
- Daily rates hold near $70
Low Season (June, September, October)
- Revenue drops to average $626 per month
- Occupancy decreases to average 29.6%
- Daily rates adjust to average $70
Seasonality Insights for Kraaifontein
- The Airbnb seasonality in Kraaifontein shows highly seasonal trends requiring careful strategy. While the sections above show seasonal averages, it's also insightful to look at the extremes:
- During the high season, the absolute peak month showcases Kraaifontein's highest earning potential, with monthly revenues capable of climbing to $1,127, occupancy reaching a high of 57.5%, and ADRs peaking at $79.
- Conversely, the slowest single month of the year, typically falling within the low season, marks the market's lowest point. In this month, revenue might dip to $446, occupancy could drop to 25.1%, and ADRs may adjust down to $64.
- Understanding both the seasonal averages and these monthly peaks and troughs in revenue, occupancy, and ADR is crucial for maximizing your Airbnb profit potential in Kraaifontein.
Seasonal Strategies for Maximizing Profit
- Peak Season: Maximize revenue through premium pricing and potentially longer minimum stays. Ensure high availability.
- Low Season: Offer competitive pricing, special promotions (e.g., extended stay discounts), and flexible cancellation policies. Target off-season travelers like remote workers or budget-conscious guests.
- Shoulder Seasons: Implement dynamic pricing that balances peak and low rates. Target weekend travelers or specific events. Offer slightly more flexible terms than peak season.
- Regularly analyze your own performance against these Kraaifontein seasonality benchmarks and adjust your pricing and availability strategy accordingly.
Best Areas for Airbnb Investment in Kraaifontein (2026)
Exploring the top neighborhoods for short-term rentals in Kraaifontein? This section highlights key areas, outlining why they are attractive for hosts and guests, along with notable local attractions. Consider these locations based on your target guest profile and investment strategy.
| Neighborhood / Area | Why Host Here? (Target Guests & Appeal) | Key Attractions & Landmarks |
|---|---|---|
| Kraaifontein Central | The heart of Kraaifontein, this area is easily accessible and close to amenities such as shopping centers, schools, and parks, making it a prime location for families and tourists alike. | Kraaifontein Mall, Zevenwacht Wine Estate, Bernadotte Park, Local Markets |
| Peerless Park | This neighborhood is known for its quiet residential streets and proximity to major transport routes, appealing to both short-term and long-term visitors looking for convenience and comfort. | Peerless Park Shopping Center, Playgrounds, Daycare Centers |
| Kraaifontein North | An emerging area with newer developments and a growing community vibe, attracting visitors looking for modern accommodations close to natural attractions. | Cape Garden Centre, Kraaifontein Nature Reserve, Walking Trails |
| Die Heuwel | A family-friendly area with parks and schools, offering a suburban feel while being close to Cape Town's attractions, ideal for vacationing families. | Local Parks, Community Events, Kraaifontein Sports Complex |
| Uitzicht | A scenic suburb known for its breathtaking views and tranquility, ideal for guests looking for a peaceful retreat away from the city bustle. | Table Mountain Views, Hiking Trails, Biking Paths |
| Kraaifontein South | A well-established area with a vibrant community and easy access to local amenities, making it appealing for both leisure and business travelers. | Kraaifontein Library, Local Restaurants, Educational Institutions |
| Chesterfield | An up-and-coming neighborhood with a mixed-use development approach, attracting young professionals and modern explorers. | Shopping Amenities, Social Hubs, Community Parks |
| Dunoon | An area with a rich cultural background and affordable housing options, perfect for tourists looking to experience the local lifestyle and community. | Cultural Festivals, Local Art Exhibits, Community Markets |
Understanding Airbnb License Requirements & STR Laws in Kraaifontein (2026)
While Kraaifontein, Western Cape, South Africa currently shows low STR regulations, specific Airbnb license requirements might still exist or change. Always verify the latest short term rental regulations and Airbnb license requirements directly with local government authorities for Kraaifontein to ensure full compliance before hosting.
(Source: AirROI data, 2026, finding no licensed listings among those analyzed)
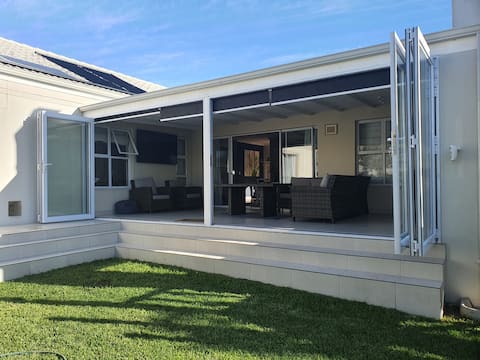
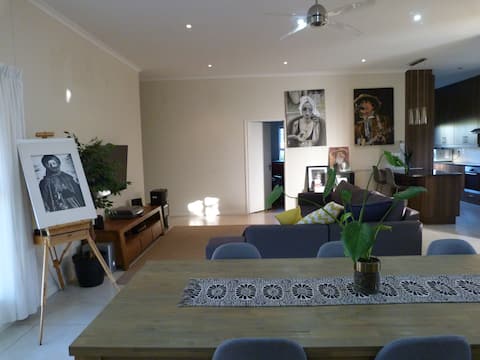
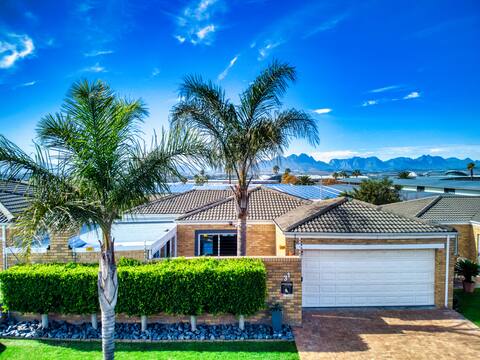
Top Performing Airbnb Properties in Kraaifontein (2026)
Benchmark your potential! Explore examples of top-performing Airbnb properties in Kraaifonteinbased on Trailing Twelve Month (TTM) revenue. Analyze their characteristics, revenue, occupancy rate, and ADR to understand what drives success in this market.
Home Away
Entire Place • 4 bedrooms
Happy Travellers
Entire Place • 4 bedrooms

Williams Residence - Home away
Entire Place • 3 bedrooms
Magnificent Villa (Load-Shedding Free!)
Entire Place • 3 bedrooms
Langeberg Ridge Apartment
Entire Place • 2 bedrooms
Diogo Property in Cape Town
Entire Place • 2 bedrooms
Note: Performance varies based on location, size, amenities, seasonality, and management quality. Data reflects the past 12 months.
Top Performing Airbnb Hosts in Kraaifontein (2026)
Learn from the best! This table showcases top-performing Airbnb hosts in Kraaifontein based on the number of properties managed and estimated total revenue over the past year. Analyze their scale and performance metrics.
| Host Name | Properties | Grossing Revenue | Stay Reviews | Avg Rating |
|---|---|---|---|---|
| Juanita | 1 | $33,515 | 66 | 4.83/5.0 |
| Jason | 1 | $31,701 | 19 | 4.95/5.0 |
| Althea | 1 | $25,318 | 9 | 4.89/5.0 |
| Hansie | 1 | $23,105 | 17 | 4.71/5.0 |
| Leana | 1 | $18,716 | 50 | 4.70/5.0 |
| Antonio | 1 | $18,344 | 42 | 4.55/5.0 |
| Shams | 1 | $16,613 | 24 | 5.00/5.0 |
| Elephants Heart | 6 | $15,220 | 183 | 4.71/5.0 |
| George | 3 | $12,602 | 63 | 4.29/5.0 |
| Yolanda | 2 | $11,298 | 65 | 4.91/5.0 |
Analyzing the strategies of top hosts, such as their property selection, pricing, and guest communication, can offer valuable lessons for optimizing your own Airbnb operations in Kraaifontein.
Dive Deeper: Advanced Kraaifontein STR Market Data (2026)
Ready to unlock more insights? AirROI provides access to advanced metrics and comprehensive Airbnb data for Kraaifontein. Explore detailed analytics beyond this report to refine your investment strategy, optimize pricing, and maximize your vacation rental profits.
Explore Advanced MetricsKraaifontein Short-Term Rental Market Composition (2026): Property & Room Types
Room Type Distribution
Property Type Distribution
Market Composition Insights for Kraaifontein
- The Kraaifontein Airbnb market composition is heavily skewed towards Entire Home/Apt listings, which make up 77.6% of the 58 active rentals. This indicates strong guest preference for privacy and space.
- Looking at the property type distribution in Kraaifontein, Apartment/Condo properties are the most common (36.2%), reflecting the local real estate landscape.
- Houses represent a significant 34.5% portion, catering likely to families or larger groups.
- The presence of 13.8% Hotel/Boutique listings indicates integration with traditional hospitality.
- Smaller segments like outdoor/unique (combined 3.4%) offer potential for unique stay experiences.
Kraaifontein Airbnb Room Capacity Analysis (2026): Bedroom Distribution
Distribution of Listings by Number of Bedrooms
Room Capacity Insights for Kraaifontein
- The dominant room capacity in Kraaifontein is 1 bedroom listings, making up 48.3% of the market. This suggests a strong demand for properties suitable for couples or solo travelers.
- Together, 1 bedroom and 2 bedrooms properties represent 67.3% of the active Airbnb listings in Kraaifontein, indicating a high concentration in these sizes.
Kraaifontein Vacation Rental Guest Capacity Trends (2026)
Distribution of Listings by Guest Capacity
Guest Capacity Insights for Kraaifontein
- The most common guest capacity trend in Kraaifontein vacation rentals is listings accommodating 2 guests (36.2%). This suggests the primary traveler segment is likely couples or solo travelers.
- Properties designed for 2 guests and 4 guests dominate the Kraaifontein STR market, accounting for 55.2% of listings.
- 13.8% of properties accommodate 6+ guests, serving the market segment for larger families or group travel in Kraaifontein.
- On average, properties in Kraaifontein are equipped to host 2.9 guests.
Kraaifontein Airbnb Booking Patterns (2026): Available vs. Booked Days
Available Days Distribution
Booked Days Distribution
Booking Pattern Insights for Kraaifontein
- The most common availability pattern in Kraaifontein falls within the 271-366 days range, representing 65.5% of listings. This suggests many properties have significant open periods on their calendars.
- Approximately 84.5% of listings show high availability (181+ days open annually), indicating potential for increased bookings or specific owner usage patterns.
- For booked days, the 1-30 days range is most frequent in Kraaifontein (36.2%), reflecting common guest stay durations or potential owner blocking patterns.
- A notable 15.5% of properties secure long booking periods (181+ days booked per year), highlighting successful long-term rental strategies or significant owner usage.
Kraaifontein Airbnb Minimum Stay Requirements Analysis
Distribution of Listings by Minimum Night Requirement
1 Night
24 listings
41.4% of total
2 Nights
10 listings
17.2% of total
3 Nights
5 listings
8.6% of total
4-6 Nights
3 listings
5.2% of total
7-29 Nights
5 listings
8.6% of total
30+ Nights
11 listings
19% of total
Key Insights
- The most prevalent minimum stay requirement in Kraaifontein is 1 Night, adopted by 41.4% of listings. This highlights the market's preference for shorter, flexible bookings.
- A significant segment (19%) caters to monthly stays (30+ nights) in Kraaifontein, pointing to opportunities in the extended-stay market.
Recommendations
- Align with the market by considering a 1 Night minimum stay, as 41.4% of Kraaifontein hosts use this setting.
- Explore offering discounts for stays of 30+ nights to attract the 19% of the market seeking extended stays.
- Adjust minimum nights based on seasonality – potentially shorter during low season and longer during peak demand periods in Kraaifontein.
Kraaifontein Airbnb Cancellation Policy Trends Analysis (2026)
Limited
2 listings
3.4% of total
Flexible
23 listings
39.7% of total
Moderate
19 listings
32.8% of total
Firm
10 listings
17.2% of total
Strict
4 listings
6.9% of total
Cancellation Policy Insights for Kraaifontein
- The prevailing Airbnb cancellation policy trend in Kraaifontein is Flexible, used by 39.7% of listings.
- The market strongly favors guest-friendly terms, with 72.5% of listings offering Flexible or Moderate policies. This suggests guests in Kraaifontein may expect booking flexibility.
- Strict cancellation policies are quite rare (6.9%), potentially making listings with this policy less competitive unless justified by high demand or property type.
Recommendations for Hosts
- Consider adopting a Flexible policy to align with the 39.7% market standard in Kraaifontein.
- Using a Strict policy might deter some guests, as only 6.9% of listings use it. Evaluate if potential revenue protection outweighs possible lower booking rates.
- Regularly review your cancellation policy against competitors and market demand shifts in Kraaifontein.
Kraaifontein STR Booking Lead Time Analysis (2026)
Average Booking Lead Time by Month
Booking Lead Time Insights for Kraaifontein
- The overall average booking lead time for vacation rentals in Kraaifontein is 34 days.
- Guests book furthest in advance for stays during January (average 67 days), likely coinciding with peak travel demand or local events.
- The shortest booking windows occur for stays in May (average 12 days), indicating more last-minute travel plans during this time.
- Seasonally, Winter (53 days avg.) sees the longest lead times, while Spring (16 days avg.) has the shortest, reflecting typical travel planning cycles.
Recommendations for Hosts
- Use the overall average lead time (34 days) as a baseline for your pricing and availability strategy in Kraaifontein.
- For January stays, consider implementing length-of-stay discounts or slightly higher rates for bookings made less than 67 days out to capitalize on advance planning.
- During May, focus on last-minute booking availability and promotions, as guests book with very short notice (12 days avg.).
- Target marketing efforts for the Winter season well in advance (at least 53 days) to capture early planners.
- Monitor your own booking lead times against these Kraaifontein averages to identify opportunities for dynamic pricing adjustments.
Popular & Essential Airbnb Amenities in Kraaifontein (2026)
Amenity Prevalence
Amenity Insights for Kraaifontein
- Essential amenities in Kraaifontein that guests expect include: Wifi. Lacking these (this) could significantly impact bookings.
- Popular amenities like Free parking on premises, TV, Kitchen are common but not universal. Offering these can provide a competitive edge.
Recommendations for Hosts
- Ensure your listing includes all essential amenities for Kraaifontein: Wifi.
- Prioritize adding missing essentials: Wifi.
- Consider adding popular differentiators like Free parking on premises or TV to increase appeal.
- Highlight unique or less common amenities you offer (e.g., hot tub, dedicated workspace, EV charger) in your listing description and photos.
- Regularly check competitor amenities in Kraaifontein to stay competitive.
Kraaifontein Airbnb Guest Demographics & Profile Analysis (2026)
Guest Profile Summary for Kraaifontein
- The typical guest profile for Airbnb in Kraaifontein consists of primarily domestic travelers (74%), often arriving from nearby Cape Town, typically belonging to the Post-2000s (Gen Z/Alpha) group (50%), primarily speaking English or Afrikaans.
- Domestic travelers account for 73.8% of guests.
- Key international markets include South Africa (73.8%) and Germany (4.1%).
- Top languages spoken are English (60.6%) followed by Afrikaans (23.1%).
- A significant demographic segment is the Post-2000s (Gen Z/Alpha) group, representing 50% of guests.
Recommendations for Hosts
- Target domestic marketing efforts towards travelers from Cape Town and Johannesburg.
- Tailor amenities and listing descriptions to appeal to the dominant Post-2000s (Gen Z/Alpha) demographic (e.g., highlight fast WiFi, smart home features, local guides).
- Highlight unique local experiences or amenities relevant to the primary guest profile.
- Consider seasonal promotions aligned with peak travel times for key origin markets.
Nearby Short-Term Rental Market Comparison
How does the Kraaifontein Airbnb market stack up against its neighbors? Compare key performance metrics like average monthly revenue, ADR, and occupancy rates in surrounding areas to understand the broader regional STR landscape.
| Market | Active Properties | Monthly Revenue | Daily Rate | Avg. Occupancy |
|---|---|---|---|---|
| Stellenbosch Local Municipality | 1,297 | $1,821 | $186.76 | 43% |
| Cape Town | 13,044 | $1,682 | $181.11 | 44% |
| Noordhoek | 225 | $1,582 | $219.93 | 40% |
| Hout Bay | 507 | $1,568 | $201.25 | 41% |
| Sir Lowry's Pass | 19 | $1,427 | $150.64 | 40% |
| Witzenberg Local Municipality | 257 | $1,349 | $133.58 | 35% |
| Simon's Town | 268 | $1,337 | $145.44 | 40% |
| Overstrand Local Municipality | 1,817 | $1,296 | $175.43 | 33% |
| Pine Haven | 11 | $1,254 | $156.97 | 39% |
| Robertson | 12 | $1,101 | $105.42 | 43% |