George Airbnb Market Analysis 2026: Short Term Rental Data & Vacation Rental Statistics in Western Cape, South Africa
Is Airbnb profitable in George in 2026? Explore comprehensive Airbnb analytics for George, Western Cape, South Africa to uncover income potential. This 2026 STR market report for George, based on AirROI data from February 2025 to January 2026, reveals key trends in the bustling market of 4,909 active listings.
Whether you're considering an Airbnb investment in George, optimizing your existing vacation rental, or exploring rental arbitrage opportunities, understanding the George Airbnb data is crucial. Leveraging the low regulation environment is key to maximizing your short term rental income potential. Let's dive into the specifics.
Key George Airbnb Performance Metrics Overview
Monthly Airbnb Revenue Variations & Income Potential in George (2026)
Understanding the monthly revenue variations for Airbnb listings in George is key to maximizing your short term rental income potential. Seasonality significantly impacts earnings. Our analysis, based on data from the past 12 months, shows that the peak revenue month for STRs in George is typically December, while June often presents the lowest earnings, highlighting opportunities for strategic pricing adjustments during shoulder and low seasons. Explore the typical Airbnb income in George across different performance tiers:
- Best-in-class properties (Top 10%) achieve $3,156+ monthly, often utilizing dynamic pricing and superior guest experiences.
- Strong performing properties (Top 25%) earn $1,663 or more, indicating effective management and desirable locations/amenities.
- Typical properties (Median) generate around $784 per month, representing the average market performance.
- Entry-level properties (Bottom 25%) see earnings around $344, often with potential for optimization.
Average Monthly Airbnb Earnings Trend in George
George Airbnb Occupancy Rate Trends (2026)
Maximize your bookings by understanding the George STR occupancy trends. Seasonal demand shifts significantly influence how often properties are booked. Typically, Decembersees the highest demand (peak season occupancy), while June experiences the lowest (low season). Effective strategies, like adjusting minimum stays or offering promotions, can boost occupancy during slower periods. Here's how different property tiers perform in George:
- Best-in-class properties (Top 10%) achieve 69%+ occupancy, indicating high desirability and potentially optimized availability.
- Strong performing properties (Top 25%) maintain 48% or higher occupancy, suggesting good market fit and guest satisfaction.
- Typical properties (Median) have an occupancy rate around 27%.
- Entry-level properties (Bottom 25%) average 13% occupancy, potentially facing higher vacancy.
Average Monthly Occupancy Rate Trend in George
Average Daily Rate (ADR) Airbnb Trends in George (2026)
Effective short term rental pricing strategy in George involves understanding monthly ADR fluctuations. The Average Daily Rate (ADR) for Airbnb in George typically peaks in December and dips lowest during August. Leveraging Airbnb dynamic pricing tools or strategies based on this seasonality can significantly boost revenue. Here's a look at the typical nightly rates achieved:
- Best-in-class properties (Top 10%) command rates of $288+ per night, often due to premium features or locations.
- Strong performing properties (Top 25%) achieve nightly rates of $173 or more.
- Typical properties (Median) charge around $100 per night.
- Entry-level properties (Bottom 25%) earn around $62 per night.
Average Daily Rate (ADR) Trend by Month in George
Get Live George Market Intelligence 👇

Explore Real-time Analytics
Airbnb Seasonality Analysis & Trends in George (2026)
Peak Season (December, February, March)
- Revenue averages $1,877 per month
- Occupancy rates average 42.0%
- Daily rates average $152
Shoulder Season
- Revenue averages $1,318 per month
- Occupancy maintains around 32.0%
- Daily rates hold near $145
Low Season (May, June, September)
- Revenue drops to average $898 per month
- Occupancy decreases to average 24.6%
- Daily rates adjust to average $136
Seasonality Insights for George
- The Airbnb seasonality in George shows highly seasonal trends requiring careful strategy. While the sections above show seasonal averages, it's also insightful to look at the extremes:
- During the high season, the absolute peak month showcases George's highest earning potential, with monthly revenues capable of climbing to $2,380, occupancy reaching a high of 45.1%, and ADRs peaking at $175.
- Conversely, the slowest single month of the year, typically falling within the low season, marks the market's lowest point. In this month, revenue might dip to $786, occupancy could drop to 21.4%, and ADRs may adjust down to $134.
- Understanding both the seasonal averages and these monthly peaks and troughs in revenue, occupancy, and ADR is crucial for maximizing your Airbnb profit potential in George.
Seasonal Strategies for Maximizing Profit
- Peak Season: Maximize revenue through premium pricing and potentially longer minimum stays. Ensure high availability.
- Low Season: Offer competitive pricing, special promotions (e.g., extended stay discounts), and flexible cancellation policies. Target off-season travelers like remote workers or budget-conscious guests.
- Shoulder Seasons: Implement dynamic pricing that balances peak and low rates. Target weekend travelers or specific events. Offer slightly more flexible terms than peak season.
- Regularly analyze your own performance against these George seasonality benchmarks and adjust your pricing and availability strategy accordingly.
Best Areas for Airbnb Investment in George (2026)
Exploring the top neighborhoods for short-term rentals in George? This section highlights key areas, outlining why they are attractive for hosts and guests, along with notable local attractions. Consider these locations based on your target guest profile and investment strategy.
| Neighborhood / Area | Why Host Here? (Target Guests & Appeal) | Key Attractions & Landmarks |
|---|---|---|
| Herolds Bay | A picturesque coastal village known for its stunning beach and outdoor activities. Popular for families and couples looking for a relaxing getaway close to nature. | Herolds Bay Beach, Hiking trails, Whale watching, Fynbos Nature Reserve, Nearby George Golf Club |
| Victoria Bay | A small, scenic bay renowned for its beauty and excellent surf conditions. Ideal for surfers and those looking for a tranquil seaside escape. | Victoria Bay Beach, Surfing spots, Beachfront restaurants, Hiking trails, Coastal nature walks |
| George City Centre | The bustling heart of George, offering access to shopping, dining, and cultural experiences. A great base for exploring the Garden Route. | George Museum, Railway Museum, Outeniqua Transport Museum, Local markets, Shopping malls |
| Fancourt | An upscale resort area known for world-class golf courses and luxury amenities. Attracts golf enthusiasts and luxury travelers. | Fancourt Golf Estate, Spa and wellness centres, Fine dining restaurants, Nature trails, Conference facilities |
| Knysna Heads | A scenic area near the Knysna Lagoon and coastline, perfect for tourists wanting a mix of relaxation and adventure. | Knysna Heads viewpoint, Kayaking, Beaches, Knysna Elephant Park, Local arts and crafts shops |
| Sedgefield | A tranquil town known for its natural beauty and proximity to the ocean, ideal for nature lovers and families. | Sedgefield Beach, Swartvlei Lagoon, Birdwatching hotspots, Market days, Nature reserves |
| Wilderness | A serene town surrounded by nature, beautiful beaches, and lagoons, attracting those who love outdoor activities and tranquility. | Wilderness Beach, Wilderness National Park, Kayaking on the lagoon, Hiking trails, Bird watching |
| Plettenberg Bay | A premier vacation destination famous for its beaches and vibrant marine life. Ideal for families and holidaymakers seeking luxurious experiences. | Plettenberg Bay beaches, Robberg Nature Reserve, Whale watching cruises, Adventure activities (bungee jumping, ziplining), Shopping and dining areas |
Understanding Airbnb License Requirements & STR Laws in George (2026)
While George, Western Cape, South Africa currently shows low STR regulations, specific Airbnb license requirements might still exist or change. Always verify the latest short term rental regulations and Airbnb license requirements directly with local government authorities for George to ensure full compliance before hosting.
(Source: AirROI data, 2026, based on 0% licensed listings)
Top Performing Airbnb Properties in George (2026)
Benchmark your potential! Explore examples of top-performing Airbnb properties in Georgebased on Trailing Twelve Month (TTM) revenue. Analyze their characteristics, revenue, occupancy rate, and ADR to understand what drives success in this market.
Luxury Beach Villa. Heated Pool & Private Cinema
Entire Place • 8 bedrooms

Cloud 9 – Exclusive Luxury Villa in Sedgefield
Entire Place • 8 bedrooms
Rock Pool Villa
Entire Place • 9 bedrooms

Tides End On Beach 14 Guests 7 BR 6 BA Pool Gym
Entire Place • 6 bedrooms
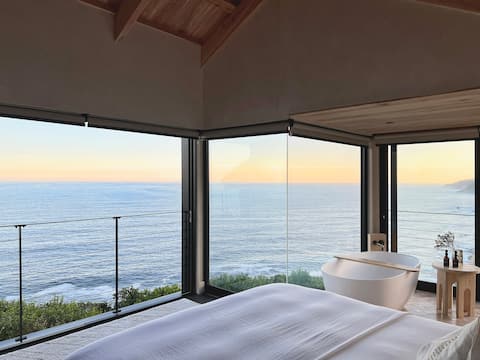
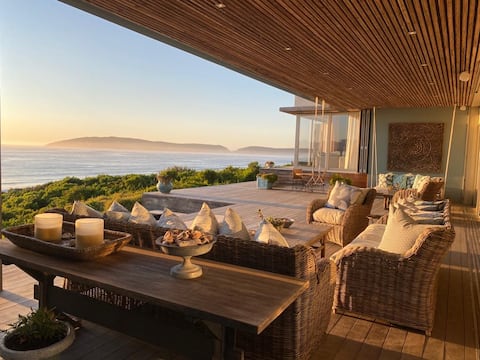
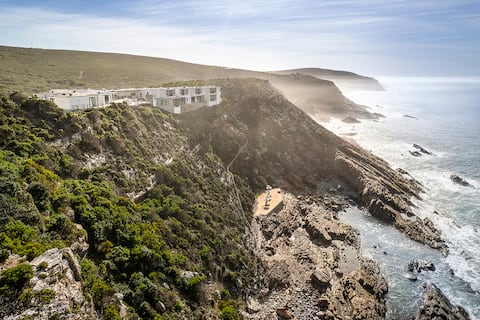
Luxury in nature. Solar Powered. Endless sea views
Entire Place • 3 bedrooms

Dizzy Hill Villa | 270° Sea Views. Pool & Patio
Entire Place • 6 bedrooms
Note: Performance varies based on location, size, amenities, seasonality, and management quality. Data reflects the past 12 months.
Top Performing Airbnb Hosts in George (2026)
Learn from the best! This table showcases top-performing Airbnb hosts in George based on the number of properties managed and estimated total revenue over the past year. Analyze their scale and performance metrics.
| Host Name | Properties | Grossing Revenue | Stay Reviews | Avg Rating |
|---|---|---|---|---|
| Linda | 63 | $995,678 | 1215 | 4.44/5.0 |
| Frikkie | 11 | $568,565 | 902 | 4.88/5.0 |
| Jonathan | 32 | $529,670 | 722 | 4.86/5.0 |
| Heather | 32 | $447,463 | 940 | 4.89/5.0 |
| Kobus | 25 | $397,785 | 562 | 4.88/5.0 |
| Magru | 19 | $381,784 | 1005 | 4.69/5.0 |
| Samantha Jayne | 11 | $349,129 | 322 | 4.82/5.0 |
| Dean And Matilda | 14 | $322,855 | 430 | 4.87/5.0 |
| Danny & Stacey | 18 | $319,529 | 771 | 4.80/5.0 |
| Two Keens | 13 | $310,995 | 262 | 4.91/5.0 |
Analyzing the strategies of top hosts, such as their property selection, pricing, and guest communication, can offer valuable lessons for optimizing your own Airbnb operations in George.
Dive Deeper: Advanced George STR Market Data (2026)
Ready to unlock more insights? AirROI provides access to advanced metrics and comprehensive Airbnb data for George. Explore detailed analytics beyond this report to refine your investment strategy, optimize pricing, and maximize your vacation rental profits.
Explore Advanced MetricsGeorge Short-Term Rental Market Composition (2026): Property & Room Types
Room Type Distribution
Property Type Distribution
Market Composition Insights for George
- The George Airbnb market composition is heavily skewed towards Entire Home/Apt listings, which make up 84.2% of the 4,909 active rentals. This indicates strong guest preference for privacy and space.
- Looking at the property type distribution in George, House properties are the most common (44.9%), reflecting the local real estate landscape.
- Houses represent a significant 44.9% portion, catering likely to families or larger groups.
- The presence of 10.1% Hotel/Boutique listings indicates integration with traditional hospitality.
- Smaller segments like unique stays (combined 0.6%) offer potential for unique stay experiences.
George Airbnb Room Capacity Analysis (2026): Bedroom Distribution
Distribution of Listings by Number of Bedrooms
Room Capacity Insights for George
- The dominant room capacity in George is 1 bedroom listings, making up 29.2% of the market. This suggests a strong demand for properties suitable for couples or solo travelers.
- Together, 1 bedroom and 2 bedrooms properties represent 54.0% of the active Airbnb listings in George, indicating a high concentration in these sizes.
- A significant 38.1% of listings offer 3+ bedrooms, catering to larger groups and families seeking more space in George.
George Vacation Rental Guest Capacity Trends (2026)
Distribution of Listings by Guest Capacity
Guest Capacity Insights for George
- The most common guest capacity trend in George vacation rentals is listings accommodating 4 guests (23.1%). This suggests the primary traveler segment is likely small families or groups.
- Properties designed for 4 guests and 2 guests dominate the George STR market, accounting for 45.8% of listings.
- 39.0% of properties accommodate 6+ guests, serving the market segment for larger families or group travel in George.
- On average, properties in George are equipped to host 4.4 guests.
George Airbnb Booking Patterns (2026): Available vs. Booked Days
Available Days Distribution
Booked Days Distribution
Booking Pattern Insights for George
- The most common availability pattern in George falls within the 271-366 days range, representing 66.7% of listings. This suggests many properties have significant open periods on their calendars.
- Approximately 90.0% of listings show high availability (181+ days open annually), indicating potential for increased bookings or specific owner usage patterns.
- For booked days, the 31-90 days range is most frequent in George (35.5%), reflecting common guest stay durations or potential owner blocking patterns.
- A notable 10.8% of properties secure long booking periods (181+ days booked per year), highlighting successful long-term rental strategies or significant owner usage.
George Airbnb Minimum Stay Requirements Analysis
Distribution of Listings by Minimum Night Requirement
1 Night
1471 listings
30% of total
2 Nights
1030 listings
21% of total
3 Nights
234 listings
4.8% of total
4-6 Nights
264 listings
5.4% of total
7-29 Nights
145 listings
3% of total
30+ Nights
1765 listings
36% of total
Key Insights
- The most prevalent minimum stay requirement in George is 30+ Nights, adopted by 36% of listings. This highlights the market's preference for longer commitments.
- A significant segment (36%) caters to monthly stays (30+ nights) in George, pointing to opportunities in the extended-stay market.
Recommendations
- Align with the market by considering a 30+ Nights minimum stay, as 36% of George hosts use this setting.
- Explore offering discounts for stays of 30+ nights to attract the 36% of the market seeking extended stays.
- Adjust minimum nights based on seasonality – potentially shorter during low season and longer during peak demand periods in George.
George Airbnb Cancellation Policy Trends Analysis (2026)
Full Refundable Until 72 Hours Before Check-in
1 listings
0% of total
Full Refundable Until Check-in
1 listings
0% of total
Limited
120 listings
2.5% of total
Super Strict 60 Days
21 listings
0.4% of total
Super Strict 30 Days
84 listings
1.7% of total
Non-refundable
245 listings
5% of total
Refundable
289 listings
5.9% of total
Flexible
892 listings
18.2% of total
Moderate
800 listings
16.4% of total
Firm
1902 listings
38.9% of total
Strict
533 listings
10.9% of total
Cancellation Policy Insights for George
- The prevailing Airbnb cancellation policy trend in George is Firm, used by 38.9% of listings.
- There's a relatively balanced mix between guest-friendly (34.6%) and stricter (49.8%) policies, offering choices for different guest needs.
Recommendations for Hosts
- Consider adopting a Firm policy to align with the 38.9% market standard in George.
- Using a Strict policy might deter some guests, as only 10.9% of listings use it. Evaluate if potential revenue protection outweighs possible lower booking rates.
- Regularly review your cancellation policy against competitors and market demand shifts in George.
George STR Booking Lead Time Analysis (2026)
Average Booking Lead Time by Month
Booking Lead Time Insights for George
- The overall average booking lead time for vacation rentals in George is 67 days.
- Guests book furthest in advance for stays during December (average 123 days), likely coinciding with peak travel demand or local events.
- The shortest booking windows occur for stays in June (average 29 days), indicating more last-minute travel plans during this time.
- Seasonally, Winter (90 days avg.) sees the longest lead times, while Summer (40 days avg.) has the shortest, reflecting typical travel planning cycles.
Recommendations for Hosts
- Use the overall average lead time (67 days) as a baseline for your pricing and availability strategy in George.
- For December stays, consider implementing length-of-stay discounts or slightly higher rates for bookings made less than 123 days out to capitalize on advance planning.
- Target marketing efforts for the Winter season well in advance (at least 90 days) to capture early planners.
- Monitor your own booking lead times against these George averages to identify opportunities for dynamic pricing adjustments.
Popular & Essential Airbnb Amenities in George (2026)
Amenity Prevalence
Amenity Insights for George
- Essential amenities in George that guests expect include: Free parking on premises. Lacking these (this) could significantly impact bookings.
- Popular amenities like Wifi, Kitchen, TV are common but not universal. Offering these can provide a competitive edge.
- Warning: Wifi is not universally provided but is considered essential globally. Ensure reliable Wifi is offered.
Recommendations for Hosts
- Ensure your listing includes all essential amenities for George: Free parking on premises.
- Prioritize adding missing essentials: Free parking on premises.
- Consider adding popular differentiators like Wifi or Kitchen to increase appeal.
- Highlight unique or less common amenities you offer (e.g., hot tub, dedicated workspace, EV charger) in your listing description and photos.
- Regularly check competitor amenities in George to stay competitive.
George Airbnb Guest Demographics & Profile Analysis (2026)
Guest Profile Summary for George
- The typical guest profile for Airbnb in George consists of a mix of domestic (53%) and international guests, often arriving from nearby Cape Town, typically belonging to the Post-2000s (Gen Z/Alpha) group (50%), primarily speaking English or Afrikaans.
- Domestic travelers account for 53.2% of guests.
- Key international markets include South Africa (53.2%) and Germany (11.8%).
- Top languages spoken are English (52.2%) followed by Afrikaans (13.2%).
- A significant demographic segment is the Post-2000s (Gen Z/Alpha) group, representing 50% of guests.
Recommendations for Hosts
- Balance marketing efforts between domestic and international channels based on the guest mix.
- Tailor amenities and listing descriptions to appeal to the dominant Post-2000s (Gen Z/Alpha) demographic (e.g., highlight fast WiFi, smart home features, local guides).
- Highlight unique local experiences or amenities relevant to the primary guest profile.
- Consider seasonal promotions aligned with peak travel times for key origin markets.
Nearby Short-Term Rental Market Comparison
How does the George Airbnb market stack up against its neighbors? Compare key performance metrics like average monthly revenue, ADR, and occupancy rates in surrounding areas to understand the broader regional STR landscape.
| Market | Active Properties | Monthly Revenue | Daily Rate | Avg. Occupancy |
|---|---|---|---|---|
| Plettenberg Bay | 33 | $877 | $177.06 | 31% |
| Knysna | 43 | $842 | $147.34 | 31% |
| Wilderness | 14 | $783 | $136.22 | 33% |
| Mossel Bay | 37 | $766 | $113.39 | 31% |
| Kou-Kamma Local Municipality | 113 | $701 | $92.75 | 29% |
| Prince Albert Local Municipality | 139 | $686 | $94.99 | 27% |
| Garden Route District Municipality | 10 | $346 | $76.57 | 28% |
| Baviaans Local Municipality | 19 | $258 | $66.75 | 16% |
| Laingsburg Local Municipality | 12 | $253 | $59.97 | 24% |
| Groot Brakrivier | 10 | $188 | $80.87 | 23% |