Okhahlamba Local Municipality Airbnb Market Analysis 2026: Short Term Rental Data & Vacation Rental Statistics in KwaZulu-Natal, South Africa
Is Airbnb profitable in Okhahlamba Local Municipality in 2026? Explore comprehensive Airbnb analytics for Okhahlamba Local Municipality, KwaZulu-Natal, South Africa to uncover income potential. This 2026 STR market report for Okhahlamba Local Municipality, based on AirROI data from February 2025 to January 2026, reveals key trends in the niche market of 173 active listings.
Whether you're considering an Airbnb investment in Okhahlamba Local Municipality, optimizing your existing vacation rental, or exploring rental arbitrage opportunities, understanding the Okhahlamba Local Municipality Airbnb data is crucial. Leveraging the low regulation environment is key to maximizing your short term rental income potential. Let's dive into the specifics.
Key Okhahlamba Local Municipality Airbnb Performance Metrics Overview
Monthly Airbnb Revenue Variations & Income Potential in Okhahlamba Local Municipality (2026)
Understanding the monthly revenue variations for Airbnb listings in Okhahlamba Local Municipality is key to maximizing your short term rental income potential. Seasonality significantly impacts earnings. Our analysis, based on data from the past 12 months, shows that the peak revenue month for STRs in Okhahlamba Local Municipality is typically December, while February often presents the lowest earnings, highlighting opportunities for strategic pricing adjustments during shoulder and low seasons. Explore the typical Airbnb income in Okhahlamba Local Municipality across different performance tiers:
- Best-in-class properties (Top 10%) achieve $2,567+ monthly, often utilizing dynamic pricing and superior guest experiences.
- Strong performing properties (Top 25%) earn $1,727 or more, indicating effective management and desirable locations/amenities.
- Typical properties (Median) generate around $987 per month, representing the average market performance.
- Entry-level properties (Bottom 25%) see earnings around $449, often with potential for optimization.
Average Monthly Airbnb Earnings Trend in Okhahlamba Local Municipality
Okhahlamba Local Municipality Airbnb Occupancy Rate Trends (2026)
Maximize your bookings by understanding the Okhahlamba Local Municipality STR occupancy trends. Seasonal demand shifts significantly influence how often properties are booked. Typically, Aprilsees the highest demand (peak season occupancy), while January experiences the lowest (low season). Effective strategies, like adjusting minimum stays or offering promotions, can boost occupancy during slower periods. Here's how different property tiers perform in Okhahlamba Local Municipality:
- Best-in-class properties (Top 10%) achieve 65%+ occupancy, indicating high desirability and potentially optimized availability.
- Strong performing properties (Top 25%) maintain 48% or higher occupancy, suggesting good market fit and guest satisfaction.
- Typical properties (Median) have an occupancy rate around 31%.
- Entry-level properties (Bottom 25%) average 16% occupancy, potentially facing higher vacancy.
Average Monthly Occupancy Rate Trend in Okhahlamba Local Municipality
Average Daily Rate (ADR) Airbnb Trends in Okhahlamba Local Municipality (2026)
Effective short term rental pricing strategy in Okhahlamba Local Municipality involves understanding monthly ADR fluctuations. The Average Daily Rate (ADR) for Airbnb in Okhahlamba Local Municipality typically peaks in December and dips lowest during November. Leveraging Airbnb dynamic pricing tools or strategies based on this seasonality can significantly boost revenue. Here's a look at the typical nightly rates achieved:
- Best-in-class properties (Top 10%) command rates of $242+ per night, often due to premium features or locations.
- Strong performing properties (Top 25%) achieve nightly rates of $168 or more.
- Typical properties (Median) charge around $113 per night.
- Entry-level properties (Bottom 25%) earn around $64 per night.
Average Daily Rate (ADR) Trend by Month in Okhahlamba Local Municipality
Get Live Okhahlamba Local Municipality Market Intelligence 👇

Explore Real-time Analytics
Airbnb Seasonality Analysis & Trends in Okhahlamba Local Municipality (2026)
Peak Season (December, July, April)
- Revenue averages $1,669 per month
- Occupancy rates average 42.4%
- Daily rates average $149
Shoulder Season
- Revenue averages $1,126 per month
- Occupancy maintains around 31.4%
- Daily rates hold near $146
Low Season (January, February, November)
- Revenue drops to average $987 per month
- Occupancy decreases to average 29.8%
- Daily rates adjust to average $144
Seasonality Insights for Okhahlamba Local Municipality
- The Airbnb seasonality in Okhahlamba Local Municipality shows moderate seasonality with distinct peak and low periods. While the sections above show seasonal averages, it's also insightful to look at the extremes:
- During the high season, the absolute peak month showcases Okhahlamba Local Municipality's highest earning potential, with monthly revenues capable of climbing to $1,747, occupancy reaching a high of 45.5%, and ADRs peaking at $151.
- Conversely, the slowest single month of the year, typically falling within the low season, marks the market's lowest point. In this month, revenue might dip to $963, occupancy could drop to 26.0%, and ADRs may adjust down to $142.
- Understanding both the seasonal averages and these monthly peaks and troughs in revenue, occupancy, and ADR is crucial for maximizing your Airbnb profit potential in Okhahlamba Local Municipality.
Seasonal Strategies for Maximizing Profit
- Peak Season: Maximize revenue through premium pricing and potentially longer minimum stays. Ensure high availability.
- Low Season: Offer competitive pricing, special promotions (e.g., extended stay discounts), and flexible cancellation policies. Target off-season travelers like remote workers or budget-conscious guests.
- Shoulder Seasons: Implement dynamic pricing that balances peak and low rates. Target weekend travelers or specific events. Offer slightly more flexible terms than peak season.
- Regularly analyze your own performance against these Okhahlamba Local Municipality seasonality benchmarks and adjust your pricing and availability strategy accordingly.
Best Areas for Airbnb Investment in Okhahlamba Local Municipality (2026)
Exploring the top neighborhoods for short-term rentals in Okhahlamba Local Municipality? This section highlights key areas, outlining why they are attractive for hosts and guests, along with notable local attractions. Consider these locations based on your target guest profile and investment strategy.
| Neighborhood / Area | Why Host Here? (Target Guests & Appeal) | Key Attractions & Landmarks |
|---|---|---|
| Bergville | The main town in Okhahlamba with access to the Drakensberg mountains, popular among hikers and visitors looking for outdoor activities. | Royal Natal National Park, Drakensberg Mountains, Cathedral Peak, Amphitheatre, Team Building Adventures |
| Royal Natal National Park | A stunning national park famous for its dramatic mountain scenery and outdoor activities. It's ideal for nature lovers and adventure tourists. | Amphitheatre, Tugela Falls, Hiking trails, Nature photography, Wildlife viewing |
| Glencomma Estate | A serene getaway spot known for its beautiful scenery and tranquility, attracting visitors seeking relaxation away from urban life. | Scenic views, Nature trails, Accommodation options, Cultural experiences |
| Tugela River | Offering beautiful river landscapes and opportunities for activities such as fishing and rafting, making it a desirable destination for adventure seekers. | Fishing spots, River rafting, Picnic areas, Nature walks |
| Thendele | A small village located within the Royal Natal National Park known for its breathtaking views and access to hiking trails, appealing to outdoor enthusiasts. | Scenic hiking routes, Camping areas, Viewpoints over the mountains, Cultural heritage sites |
| Winterton | A charming town serving as a gateway to the Drakensberg, popular for those looking to explore the nearby natural attractions and experiences. | Drakensberg Canopy Tour, Cultural villages, Artisan shops, Farming experiences |
| Okhahlamba Cultural Heritage Center | An important cultural center that showcases the rich history and culture of the area, attracting both tourists and locals interested in cultural experiences. | Cultural exhibits, Workshops, Guided tours, Craft markets |
| Cederberg Valley | Known for its breathtaking natural beauty and opportunities for hiking and rock climbing, making it a great spot for active travelers. | Hiking trails, Rock climbing, Historical rock art, Nature photography |
Understanding Airbnb License Requirements & STR Laws in Okhahlamba Local Municipality (2026)
While Okhahlamba Local Municipality, KwaZulu-Natal, South Africa currently shows low STR regulations, specific Airbnb license requirements might still exist or change. Always verify the latest short term rental regulations and Airbnb license requirements directly with local government authorities for Okhahlamba Local Municipality to ensure full compliance before hosting.
(Source: AirROI data, 2026, finding no licensed listings among those analyzed)
Top Performing Airbnb Properties in Okhahlamba Local Municipality (2026)
Benchmark your potential! Explore examples of top-performing Airbnb properties in Okhahlamba Local Municipalitybased on Trailing Twelve Month (TTM) revenue. Analyze their characteristics, revenue, occupancy rate, and ADR to understand what drives success in this market.
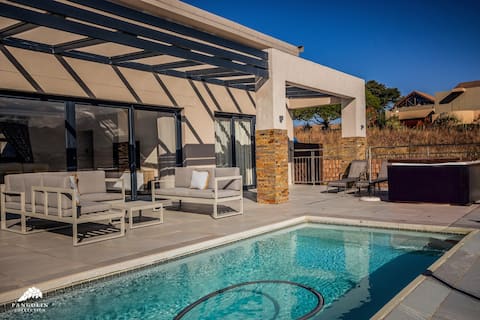
Modern Berg Home | Pool | Hot Tub | Scenic Views
Entire Place • 3 bedrooms
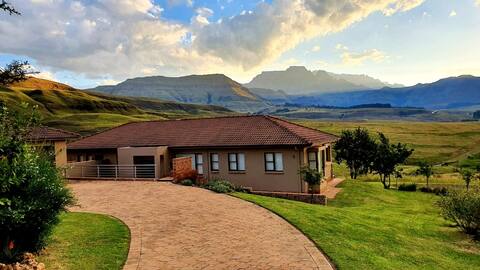
Grassroots Guesthouse - DRAKENSBERG ECO ESTATE
Entire Place • 4 bedrooms
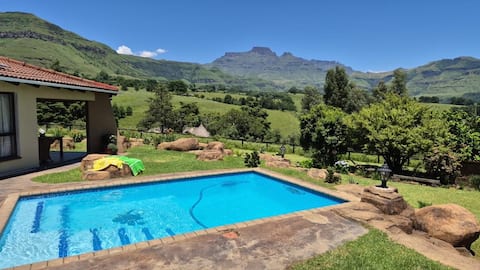
Nyati Valley Berg House, Champagne Castle
Entire Place • 3 bedrooms

Spacious 4BR Getaway | Mountain Views & Fireplace
Entire Place • 4 bedrooms

Plain Champagne Guest Farm
Entire Place • 6 bedrooms

Dragon View Estate, Central Drakensberg
Entire Place • 4 bedrooms
Note: Performance varies based on location, size, amenities, seasonality, and management quality. Data reflects the past 12 months.
Top Performing Airbnb Hosts in Okhahlamba Local Municipality (2026)
Learn from the best! This table showcases top-performing Airbnb hosts in Okhahlamba Local Municipality based on the number of properties managed and estimated total revenue over the past year. Analyze their scale and performance metrics.
| Host Name | Properties | Grossing Revenue | Stay Reviews | Avg Rating |
|---|---|---|---|---|
| Euphoric | 8 | $242,886 | 223 | 4.82/5.0 |
| Julian | 5 | $79,348 | 93 | 4.88/5.0 |
| Maryke | 4 | $73,662 | 371 | 4.93/5.0 |
| Sasi Bush Lodge | 4 | $71,376 | 28 | 5.00/5.0 |
| Jessica | 3 | $53,042 | 50 | 4.82/5.0 |
| Jess | 3 | $52,677 | 58 | 5.00/5.0 |
| James | 1 | $46,564 | 151 | 4.97/5.0 |
| Mark | 1 | $34,780 | 56 | 4.80/5.0 |
| Giselle | 2 | $34,065 | 139 | 4.97/5.0 |
| Graeme | 1 | $33,927 | 143 | 4.87/5.0 |
Analyzing the strategies of top hosts, such as their property selection, pricing, and guest communication, can offer valuable lessons for optimizing your own Airbnb operations in Okhahlamba Local Municipality.
Dive Deeper: Advanced Okhahlamba Local Municipality STR Market Data (2026)
Ready to unlock more insights? AirROI provides access to advanced metrics and comprehensive Airbnb data for Okhahlamba Local Municipality. Explore detailed analytics beyond this report to refine your investment strategy, optimize pricing, and maximize your vacation rental profits.
Explore Advanced MetricsOkhahlamba Local Municipality Short-Term Rental Market Composition (2026): Property & Room Types
Room Type Distribution
Property Type Distribution
Market Composition Insights for Okhahlamba Local Municipality
- The Okhahlamba Local Municipality Airbnb market composition is heavily skewed towards Entire Home/Apt listings, which make up 85.5% of the 173 active rentals. This indicates strong guest preference for privacy and space.
- Looking at the property type distribution in Okhahlamba Local Municipality, House properties are the most common (66.5%), reflecting the local real estate landscape.
- Houses represent a significant 66.5% portion, catering likely to families or larger groups.
- Smaller segments like hotel/boutique, unique stays, apartment/condo (combined 7.5%) offer potential for unique stay experiences.
Okhahlamba Local Municipality Airbnb Room Capacity Analysis (2026): Bedroom Distribution
Distribution of Listings by Number of Bedrooms
Room Capacity Insights for Okhahlamba Local Municipality
- The dominant room capacity in Okhahlamba Local Municipality is 1 bedroom listings, making up 24.3% of the market. This suggests a strong demand for properties suitable for couples or solo travelers.
- Together, 1 bedroom and 2 bedrooms properties represent 45.1% of the active Airbnb listings in Okhahlamba Local Municipality, indicating a high concentration in these sizes.
- A significant 47.4% of listings offer 3+ bedrooms, catering to larger groups and families seeking more space in Okhahlamba Local Municipality.
Okhahlamba Local Municipality Vacation Rental Guest Capacity Trends (2026)
Distribution of Listings by Guest Capacity
Guest Capacity Insights for Okhahlamba Local Municipality
- The most common guest capacity trend in Okhahlamba Local Municipality vacation rentals is listings accommodating 8+ guests (27.2%). This suggests the primary traveler segment is likely larger groups.
- Properties designed for 8+ guests and 6 guests dominate the Okhahlamba Local Municipality STR market, accounting for 46.9% of listings.
- 49.2% of properties accommodate 6+ guests, serving the market segment for larger families or group travel in Okhahlamba Local Municipality.
- On average, properties in Okhahlamba Local Municipality are equipped to host 4.9 guests.
Okhahlamba Local Municipality Airbnb Booking Patterns (2026): Available vs. Booked Days
Available Days Distribution
Booked Days Distribution
Booking Pattern Insights for Okhahlamba Local Municipality
- The most common availability pattern in Okhahlamba Local Municipality falls within the 271-366 days range, representing 56.6% of listings. This suggests many properties have significant open periods on their calendars.
- Approximately 86.1% of listings show high availability (181+ days open annually), indicating potential for increased bookings or specific owner usage patterns.
- For booked days, the 31-90 days range is most frequent in Okhahlamba Local Municipality (35.3%), reflecting common guest stay durations or potential owner blocking patterns.
- A notable 13.9% of properties secure long booking periods (181+ days booked per year), highlighting successful long-term rental strategies or significant owner usage.
Okhahlamba Local Municipality Airbnb Minimum Stay Requirements Analysis
Distribution of Listings by Minimum Night Requirement
1 Night
80 listings
46.2% of total
2 Nights
53 listings
30.6% of total
3 Nights
2 listings
1.2% of total
30+ Nights
38 listings
22% of total
Key Insights
- The most prevalent minimum stay requirement in Okhahlamba Local Municipality is 1 Night, adopted by 46.2% of listings. This highlights the market's preference for shorter, flexible bookings.
- A strong majority (76.8%) of the Okhahlamba Local Municipality Airbnb data shows acceptance of very short stays (1-2 nights), indicating a dynamic, high-turnover market.
- A significant segment (22%) caters to monthly stays (30+ nights) in Okhahlamba Local Municipality, pointing to opportunities in the extended-stay market.
Recommendations
- Align with the market by considering a 1 Night minimum stay, as 46.2% of Okhahlamba Local Municipality hosts use this setting.
- Explore offering discounts for stays of 30+ nights to attract the 22% of the market seeking extended stays.
- Adjust minimum nights based on seasonality – potentially shorter during low season and longer during peak demand periods in Okhahlamba Local Municipality.
Okhahlamba Local Municipality Airbnb Cancellation Policy Trends Analysis (2026)
Refundable
13 listings
7.6% of total
Non-refundable
11 listings
6.5% of total
Super Strict 60 Days
1 listings
0.6% of total
Limited
1 listings
0.6% of total
Super Strict 30 Days
6 listings
3.5% of total
Flexible
33 listings
19.4% of total
Moderate
35 listings
20.6% of total
Firm
61 listings
35.9% of total
Strict
9 listings
5.3% of total
Cancellation Policy Insights for Okhahlamba Local Municipality
- The prevailing Airbnb cancellation policy trend in Okhahlamba Local Municipality is Firm, used by 35.9% of listings.
- There's a relatively balanced mix between guest-friendly (40.0%) and stricter (41.2%) policies, offering choices for different guest needs.
- Strict cancellation policies are quite rare (5.3%), potentially making listings with this policy less competitive unless justified by high demand or property type.
Recommendations for Hosts
- Consider adopting a Firm policy to align with the 35.9% market standard in Okhahlamba Local Municipality.
- Using a Strict policy might deter some guests, as only 5.3% of listings use it. Evaluate if potential revenue protection outweighs possible lower booking rates.
- Regularly review your cancellation policy against competitors and market demand shifts in Okhahlamba Local Municipality.
Okhahlamba Local Municipality STR Booking Lead Time Analysis (2026)
Average Booking Lead Time by Month
Booking Lead Time Insights for Okhahlamba Local Municipality
- The overall average booking lead time for vacation rentals in Okhahlamba Local Municipality is 61 days.
- Guests book furthest in advance for stays during December (average 85 days), likely coinciding with peak travel demand or local events.
- The shortest booking windows occur for stays in June (average 43 days), indicating more last-minute travel plans during this time.
- Seasonally, Winter (66 days avg.) sees the longest lead times, while Summer (53 days avg.) has the shortest, reflecting typical travel planning cycles.
Recommendations for Hosts
- Use the overall average lead time (61 days) as a baseline for your pricing and availability strategy in Okhahlamba Local Municipality.
- For December stays, consider implementing length-of-stay discounts or slightly higher rates for bookings made less than 85 days out to capitalize on advance planning.
- Target marketing efforts for the Winter season well in advance (at least 66 days) to capture early planners.
- Monitor your own booking lead times against these Okhahlamba Local Municipality averages to identify opportunities for dynamic pricing adjustments.
Popular & Essential Airbnb Amenities in Okhahlamba Local Municipality (2026)
Amenity Prevalence
Amenity Insights for Okhahlamba Local Municipality
- Essential amenities in Okhahlamba Local Municipality that guests expect include: Free parking on premises. Lacking these (this) could significantly impact bookings.
- Popular amenities like Kitchen, Hangers, Refrigerator are common but not universal. Offering these can provide a competitive edge.
- Warning: Wifi is not universally provided but is considered essential globally. Ensure reliable Wifi is offered.
Recommendations for Hosts
- Ensure your listing includes all essential amenities for Okhahlamba Local Municipality: Free parking on premises.
- Prioritize adding missing essentials: Free parking on premises.
- Consider adding popular differentiators like Kitchen or Hangers to increase appeal.
- Highlight unique or less common amenities you offer (e.g., hot tub, dedicated workspace, EV charger) in your listing description and photos.
- Regularly check competitor amenities in Okhahlamba Local Municipality to stay competitive.
Okhahlamba Local Municipality Airbnb Guest Demographics & Profile Analysis (2026)
Guest Profile Summary for Okhahlamba Local Municipality
- The typical guest profile for Airbnb in Okhahlamba Local Municipality consists of primarily domestic travelers (71%), often arriving from nearby Johannesburg, typically belonging to the Post-2000s (Gen Z/Alpha) group (50%), primarily speaking English or Afrikaans.
- Domestic travelers account for 70.7% of guests.
- Key international markets include South Africa (70.7%) and United Kingdom (5.6%).
- Top languages spoken are English (58.9%) followed by Afrikaans (13.8%).
- A significant demographic segment is the Post-2000s (Gen Z/Alpha) group, representing 50% of guests.
Recommendations for Hosts
- Target domestic marketing efforts towards travelers from Johannesburg and KwaZulu-Natal.
- Tailor amenities and listing descriptions to appeal to the dominant Post-2000s (Gen Z/Alpha) demographic (e.g., highlight fast WiFi, smart home features, local guides).
- Highlight unique local experiences or amenities relevant to the primary guest profile.
- Consider seasonal promotions aligned with peak travel times for key origin markets.
Nearby Short-Term Rental Market Comparison
How does the Okhahlamba Local Municipality Airbnb market stack up against its neighbors? Compare key performance metrics like average monthly revenue, ADR, and occupancy rates in surrounding areas to understand the broader regional STR landscape.
| Market | Active Properties | Monthly Revenue | Daily Rate | Avg. Occupancy |
|---|---|---|---|---|
| Impendle Local Municipality | 18 | $994 | $136.32 | 30% |
| uMgeni Local Municipality | 387 | $949 | $108.51 | 33% |
| Dihlabeng Local Municipality | 378 | $708 | $105.67 | 25% |
| Mpofana Local Municipality | 57 | $653 | $102.23 | 25% |
| uMshwathi Local Municipality | 10 | $622 | $117.47 | 23% |
| Clarens | 15 | $580 | $104.95 | 27% |
| Kwa Sani Local Municipality | 130 | $569 | $110.57 | 23% |
| Hillcrest | 70 | $535 | $63.08 | 38% |
| Gillitts | 14 | $476 | $65.77 | 30% |
| Queensburgh | 33 | $470 | $50.45 | 46% |