Moqhaka Local Municipality Airbnb Market Analysis 2026: Short Term Rental Data & Vacation Rental Statistics in Free State, South Africa
Is Airbnb profitable in Moqhaka Local Municipality in 2026? Explore comprehensive Airbnb analytics for Moqhaka Local Municipality, Free State, South Africa to uncover income potential. This 2026 STR market report for Moqhaka Local Municipality, based on AirROI data from February 2025 to January 2026, reveals key trends in the niche market of 27 active listings.
Whether you're considering an Airbnb investment in Moqhaka Local Municipality, optimizing your existing vacation rental, or exploring rental arbitrage opportunities, understanding the Moqhaka Local Municipality Airbnb data is crucial. Leveraging the low regulation environment is key to maximizing your short term rental income potential. Let's dive into the specifics.
Key Moqhaka Local Municipality Airbnb Performance Metrics Overview
Monthly Airbnb Revenue Variations & Income Potential in Moqhaka Local Municipality (2026)
Understanding the monthly revenue variations for Airbnb listings in Moqhaka Local Municipality is key to maximizing your short term rental income potential. Seasonality significantly impacts earnings. Our analysis, based on data from the past 12 months, shows that the peak revenue month for STRs in Moqhaka Local Municipality is typically November, while September often presents the lowest earnings, highlighting opportunities for strategic pricing adjustments during shoulder and low seasons. Explore the typical Airbnb income in Moqhaka Local Municipality across different performance tiers:
- Best-in-class properties (Top 10%) achieve $648+ monthly, often utilizing dynamic pricing and superior guest experiences.
- Strong performing properties (Top 25%) earn $426 or more, indicating effective management and desirable locations/amenities.
- Typical properties (Median) generate around $217 per month, representing the average market performance.
- Entry-level properties (Bottom 25%) see earnings around $115, often with potential for optimization.
Average Monthly Airbnb Earnings Trend in Moqhaka Local Municipality
Moqhaka Local Municipality Airbnb Occupancy Rate Trends (2026)
Maximize your bookings by understanding the Moqhaka Local Municipality STR occupancy trends. Seasonal demand shifts significantly influence how often properties are booked. Typically, Novembersees the highest demand (peak season occupancy), while September experiences the lowest (low season). Effective strategies, like adjusting minimum stays or offering promotions, can boost occupancy during slower periods. Here's how different property tiers perform in Moqhaka Local Municipality:
- Best-in-class properties (Top 10%) achieve 49%+ occupancy, indicating high desirability and potentially optimized availability.
- Strong performing properties (Top 25%) maintain 29% or higher occupancy, suggesting good market fit and guest satisfaction.
- Typical properties (Median) have an occupancy rate around 13%.
- Entry-level properties (Bottom 25%) average 8% occupancy, potentially facing higher vacancy.
Average Monthly Occupancy Rate Trend in Moqhaka Local Municipality
Average Daily Rate (ADR) Airbnb Trends in Moqhaka Local Municipality (2026)
Effective short term rental pricing strategy in Moqhaka Local Municipality involves understanding monthly ADR fluctuations. The Average Daily Rate (ADR) for Airbnb in Moqhaka Local Municipality typically peaks in August and dips lowest during November. Leveraging Airbnb dynamic pricing tools or strategies based on this seasonality can significantly boost revenue. Here's a look at the typical nightly rates achieved:
- Best-in-class properties (Top 10%) command rates of $89+ per night, often due to premium features or locations.
- Strong performing properties (Top 25%) achieve nightly rates of $60 or more.
- Typical properties (Median) charge around $44 per night.
- Entry-level properties (Bottom 25%) earn around $35 per night.
Average Daily Rate (ADR) Trend by Month in Moqhaka Local Municipality
Get Live Moqhaka Local Municipality Market Intelligence 👇

Explore Real-time Analytics
Airbnb Seasonality Analysis & Trends in Moqhaka Local Municipality (2026)
Peak Season (November, October, April)
- Revenue averages $493 per month
- Occupancy rates average 25.8%
- Daily rates average $57
Shoulder Season
- Revenue averages $324 per month
- Occupancy maintains around 22.2%
- Daily rates hold near $58
Low Season (January, August, September)
- Revenue drops to average $217 per month
- Occupancy decreases to average 14.8%
- Daily rates adjust to average $57
Seasonality Insights for Moqhaka Local Municipality
- The Airbnb seasonality in Moqhaka Local Municipality shows highly seasonal trends requiring careful strategy. While the sections above show seasonal averages, it's also insightful to look at the extremes:
- During the high season, the absolute peak month showcases Moqhaka Local Municipality's highest earning potential, with monthly revenues capable of climbing to $607, occupancy reaching a high of 32.0%, and ADRs peaking at $58.
- Conversely, the slowest single month of the year, typically falling within the low season, marks the market's lowest point. In this month, revenue might dip to $197, occupancy could drop to 13.8%, and ADRs may adjust down to $56.
- Understanding both the seasonal averages and these monthly peaks and troughs in revenue, occupancy, and ADR is crucial for maximizing your Airbnb profit potential in Moqhaka Local Municipality.
Seasonal Strategies for Maximizing Profit
- Peak Season: Maximize revenue through premium pricing and potentially longer minimum stays. Ensure high availability.
- Low Season: Offer competitive pricing, special promotions (e.g., extended stay discounts), and flexible cancellation policies. Target off-season travelers like remote workers or budget-conscious guests.
- Shoulder Seasons: Implement dynamic pricing that balances peak and low rates. Target weekend travelers or specific events. Offer slightly more flexible terms than peak season.
- Regularly analyze your own performance against these Moqhaka Local Municipality seasonality benchmarks and adjust your pricing and availability strategy accordingly.
Best Areas for Airbnb Investment in Moqhaka Local Municipality (2026)
Exploring the top neighborhoods for short-term rentals in Moqhaka Local Municipality? This section highlights key areas, outlining why they are attractive for hosts and guests, along with notable local attractions. Consider these locations based on your target guest profile and investment strategy.
| Neighborhood / Area | Why Host Here? (Target Guests & Appeal) | Key Attractions & Landmarks |
|---|---|---|
| Kroonstad | The largest town in the Moqhaka Local Municipality, Kroonstad offers a blend of history and modern conveniences. It's a hub for travelers needing a stopover or exploring the Free State region. | Hoogland Nature Reserve, Kroonstad Golf Club, Kroonstad Lighthouse, Third Roberston Street Museum, Tskhuyo Hike |
| Viljoenskroon | A town that serves as a convenient access point for both travelers and locals. It's known for its community spirit and proximity to various scenic routes and attractions. | Viljoenskroon Dam, The Village Gym, Historical Walk of Viljoenskroon |
| Koppies | A small town with a rural charm that attracts both local and international visitors looking for a peaceful stay. It provides an authentic experience of South African small-town life. | Koppies Nature Reserve, Koppies Railway Station |
| Sannaspos | Sannaspos is a quieter area that attracts nature lovers and those looking for a retreat from city life, making it ideal for short-term rentals. | Sannaspos Hiking Trails, Local Farms and Markets |
| Mokwalo | This area is appealing for its unique culture and traditional lifestyle, drawing in those wanting to experience the Free State's authentic heritage. | Cultural Tours, Mokwalo Nature Walks |
| Sewende Stad | A burgeoning area with potential for growth in tourism as it develops, ideal for those looking to invest early in promising locations. | Local Markets, Traditional Festivals |
| Warden | Nestled near major transport routes, Warden is a strategic stop for travelers and offers numerous outdoor activities nearby. | Warden Nature Reserve, Fishing and Boating at local dams |
| Riemland | A peaceful area known for its natural beauty and outdoor activities, perfect for visitors wishing to explore the Free State's landscapes. | Outdoor Hiking Trails, Bird Watching, Cultural Sites |
Understanding Airbnb License Requirements & STR Laws in Moqhaka Local Municipality (2026)
While Moqhaka Local Municipality, Free State, South Africa currently shows low STR regulations, specific Airbnb license requirements might still exist or change. Always verify the latest short term rental regulations and Airbnb license requirements directly with local government authorities for Moqhaka Local Municipality to ensure full compliance before hosting.
(Source: AirROI data, 2026, based on 4% licensed listings)
Top Performing Airbnb Properties in Moqhaka Local Municipality (2026)
Benchmark your potential! Explore examples of top-performing Airbnb properties in Moqhaka Local Municipalitybased on Trailing Twelve Month (TTM) revenue. Analyze their characteristics, revenue, occupancy rate, and ADR to understand what drives success in this market.

House Musantwi
Entire Place • 5 bedrooms

The Nutcracker Homestead
Entire Place • 5 bedrooms

Oudewerf Fly Fishing Eco House
Entire Place • 3 bedrooms
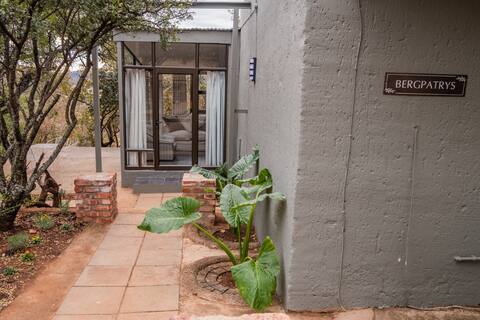
Bergpatrys - Kieriebos (in the Vredefort Dome)
Entire Place • 2 bedrooms

Honeypot Fly Fishing Eco Chalet
Entire Place • 1 bedroom
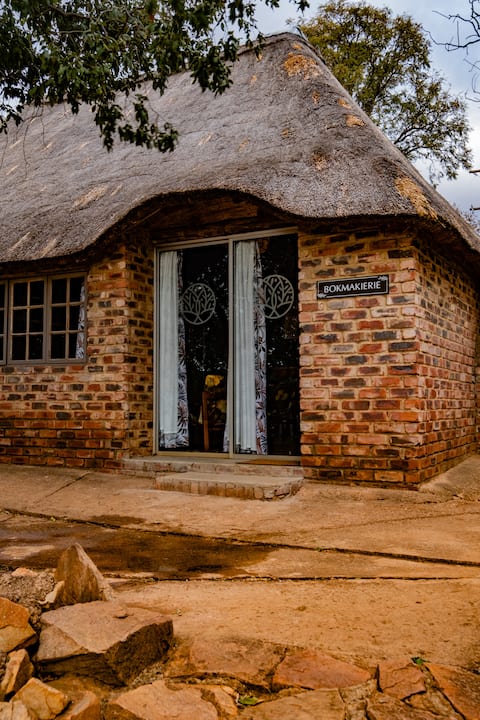
Bokmakierie - Kieriebos (in the Vredefort Dome)
Entire Place • 2 bedrooms
Note: Performance varies based on location, size, amenities, seasonality, and management quality. Data reflects the past 12 months.
Top Performing Airbnb Hosts in Moqhaka Local Municipality (2026)
Learn from the best! This table showcases top-performing Airbnb hosts in Moqhaka Local Municipality based on the number of properties managed and estimated total revenue over the past year. Analyze their scale and performance metrics.
| Host Name | Properties | Grossing Revenue | Stay Reviews | Avg Rating |
|---|---|---|---|---|
| Gunther | 3 | $12,462 | 17 | 4.87/5.0 |
| Anushca | 3 | $10,349 | 71 | 4.89/5.0 |
| Tafadzwa | 1 | $7,372 | 15 | 4.53/5.0 |
| Graham | 1 | $7,304 | 3 | 4.67/5.0 |
| Ryno | 2 | $2,653 | 41 | 4.75/5.0 |
| Rene | 1 | $2,324 | 10 | 4.80/5.0 |
| Gizelle | 1 | $2,198 | 8 | 4.25/5.0 |
| Janita | 1 | $2,175 | 6 | 5.00/5.0 |
| Rethabile | 3 | $1,590 | 6 | 4.75/5.0 |
| Inance | 1 | $1,499 | 6 | 4.83/5.0 |
Analyzing the strategies of top hosts, such as their property selection, pricing, and guest communication, can offer valuable lessons for optimizing your own Airbnb operations in Moqhaka Local Municipality.
Dive Deeper: Advanced Moqhaka Local Municipality STR Market Data (2026)
Ready to unlock more insights? AirROI provides access to advanced metrics and comprehensive Airbnb data for Moqhaka Local Municipality. Explore detailed analytics beyond this report to refine your investment strategy, optimize pricing, and maximize your vacation rental profits.
Explore Advanced MetricsMoqhaka Local Municipality Short-Term Rental Market Composition (2026): Property & Room Types
Room Type Distribution
Property Type Distribution
Market Composition Insights for Moqhaka Local Municipality
- The Moqhaka Local Municipality Airbnb market composition is heavily skewed towards Entire Home/Apt listings, which make up 51.9% of the 27 active rentals. This indicates strong guest preference for privacy and space.
- However, a notable 44.4% share for Private Rooms suggests opportunities for budget-conscious travelers or hosts renting out spare rooms.
- Looking at the property type distribution in Moqhaka Local Municipality, Outdoor/Unique properties are the most common (37%), reflecting the local real estate landscape.
- Houses represent a significant 33.3% portion, catering likely to families or larger groups.
- The presence of 18.5% Hotel/Boutique listings indicates integration with traditional hospitality.
- Smaller segments like apartment/condo (combined 3.7%) offer potential for unique stay experiences.
Moqhaka Local Municipality Airbnb Room Capacity Analysis (2026): Bedroom Distribution
Distribution of Listings by Number of Bedrooms
Room Capacity Insights for Moqhaka Local Municipality
- The dominant room capacity in Moqhaka Local Municipality is 1 bedroom listings, making up 40.7% of the market. This suggests a strong demand for properties suitable for couples or solo travelers.
- Together, 1 bedroom and 5+ bedrooms properties represent 59.2% of the active Airbnb listings in Moqhaka Local Municipality, indicating a high concentration in these sizes.
- A significant 29.6% of listings offer 3+ bedrooms, catering to larger groups and families seeking more space in Moqhaka Local Municipality.
Moqhaka Local Municipality Vacation Rental Guest Capacity Trends (2026)
Distribution of Listings by Guest Capacity
Guest Capacity Insights for Moqhaka Local Municipality
- The most common guest capacity trend in Moqhaka Local Municipality vacation rentals is listings accommodating 2 guests (18.5%). This suggests the primary traveler segment is likely couples or solo travelers.
- Properties designed for 2 guests and 4 guests dominate the Moqhaka Local Municipality STR market, accounting for 33.3% of listings.
- 22.2% of properties accommodate 6+ guests, serving the market segment for larger families or group travel in Moqhaka Local Municipality.
- On average, properties in Moqhaka Local Municipality are equipped to host 3.3 guests.
Moqhaka Local Municipality Airbnb Booking Patterns (2026): Available vs. Booked Days
Available Days Distribution
Booked Days Distribution
Booking Pattern Insights for Moqhaka Local Municipality
- The most common availability pattern in Moqhaka Local Municipality falls within the 271-366 days range, representing 85.2% of listings. This suggests many properties have significant open periods on their calendars.
- Approximately 100.0% of listings show high availability (181+ days open annually), indicating potential for increased bookings or specific owner usage patterns.
- For booked days, the 1-30 days range is most frequent in Moqhaka Local Municipality (63%), reflecting common guest stay durations or potential owner blocking patterns.
Moqhaka Local Municipality Airbnb Minimum Stay Requirements Analysis
Distribution of Listings by Minimum Night Requirement
1 Night
18 listings
66.7% of total
2 Nights
6 listings
22.2% of total
30+ Nights
3 listings
11.1% of total
Key Insights
- The most prevalent minimum stay requirement in Moqhaka Local Municipality is 1 Night, adopted by 66.7% of listings. This highlights the market's preference for shorter, flexible bookings.
- A strong majority (88.9%) of the Moqhaka Local Municipality Airbnb data shows acceptance of very short stays (1-2 nights), indicating a dynamic, high-turnover market.
- A significant segment (11.1%) caters to monthly stays (30+ nights) in Moqhaka Local Municipality, pointing to opportunities in the extended-stay market.
Recommendations
- Align with the market by considering a 1 Night minimum stay, as 66.7% of Moqhaka Local Municipality hosts use this setting.
- Explore offering discounts for stays of 30+ nights to attract the 11.1% of the market seeking extended stays.
- Adjust minimum nights based on seasonality – potentially shorter during low season and longer during peak demand periods in Moqhaka Local Municipality.
Moqhaka Local Municipality Airbnb Cancellation Policy Trends Analysis (2026)
Non-refundable
3 listings
11.1% of total
Refundable
2 listings
7.4% of total
Flexible
14 listings
51.9% of total
Moderate
3 listings
11.1% of total
Firm
3 listings
11.1% of total
Strict
2 listings
7.4% of total
Cancellation Policy Insights for Moqhaka Local Municipality
- The prevailing Airbnb cancellation policy trend in Moqhaka Local Municipality is Flexible, used by 51.9% of listings.
- There's a relatively balanced mix between guest-friendly (63.0%) and stricter (18.5%) policies, offering choices for different guest needs.
- Strict cancellation policies are quite rare (7.4%), potentially making listings with this policy less competitive unless justified by high demand or property type.
Recommendations for Hosts
- Consider adopting a Flexible policy to align with the 51.9% market standard in Moqhaka Local Municipality.
- Given the high prevalence of Flexible policies (51.9%), offering this can enhance booking appeal, especially during shoulder seasons.
- Using a Strict policy might deter some guests, as only 7.4% of listings use it. Evaluate if potential revenue protection outweighs possible lower booking rates.
- Regularly review your cancellation policy against competitors and market demand shifts in Moqhaka Local Municipality.
Moqhaka Local Municipality STR Booking Lead Time Analysis (2026)
Average Booking Lead Time by Month
Booking Lead Time Insights for Moqhaka Local Municipality
- The overall average booking lead time for vacation rentals in Moqhaka Local Municipality is 27 days.
- Guests book furthest in advance for stays during November (average 85 days), likely coinciding with peak travel demand or local events.
- The shortest booking windows occur for stays in July (average 12 days), indicating more last-minute travel plans during this time.
- Seasonally, Fall (56 days avg.) sees the longest lead times, while Spring (20 days avg.) has the shortest, reflecting typical travel planning cycles.
Recommendations for Hosts
- Use the overall average lead time (27 days) as a baseline for your pricing and availability strategy in Moqhaka Local Municipality.
- For November stays, consider implementing length-of-stay discounts or slightly higher rates for bookings made less than 85 days out to capitalize on advance planning.
- During July, focus on last-minute booking availability and promotions, as guests book with very short notice (12 days avg.).
- Target marketing efforts for the Fall season well in advance (at least 56 days) to capture early planners.
- Monitor your own booking lead times against these Moqhaka Local Municipality averages to identify opportunities for dynamic pricing adjustments.
Popular & Essential Airbnb Amenities in Moqhaka Local Municipality (2026)
Amenity Prevalence
Amenity Insights for Moqhaka Local Municipality
- Essential amenities in Moqhaka Local Municipality that guests expect include: Free parking on premises. Lacking these (this) could significantly impact bookings.
- Popular amenities like Wifi, BBQ grill, Kitchen are common but not universal. Offering these can provide a competitive edge.
- Warning: Wifi is not universally provided but is considered essential globally. Ensure reliable Wifi is offered.
Recommendations for Hosts
- Ensure your listing includes all essential amenities for Moqhaka Local Municipality: Free parking on premises.
- Prioritize adding missing essentials: Free parking on premises.
- Consider adding popular differentiators like Wifi or BBQ grill to increase appeal.
- Highlight unique or less common amenities you offer (e.g., hot tub, dedicated workspace, EV charger) in your listing description and photos.
- Regularly check competitor amenities in Moqhaka Local Municipality to stay competitive.
Moqhaka Local Municipality Airbnb Guest Demographics & Profile Analysis (2026)
Guest Profile Summary for Moqhaka Local Municipality
- The typical guest profile for Airbnb in Moqhaka Local Municipality consists of primarily domestic travelers (87%), often arriving from nearby Cape Town, typically belonging to the Post-2000s (Gen Z/Alpha) group (50%), primarily speaking English or Afrikaans.
- Domestic travelers account for 87.2% of guests.
- Key international markets include South Africa (87.2%) and United Kingdom (2.6%).
- Top languages spoken are English (70%) followed by Afrikaans (13.3%).
- A significant demographic segment is the Post-2000s (Gen Z/Alpha) group, representing 50% of guests.
Recommendations for Hosts
- Target domestic marketing efforts towards travelers from Cape Town and Johannesburg.
- Tailor amenities and listing descriptions to appeal to the dominant Post-2000s (Gen Z/Alpha) demographic (e.g., highlight fast WiFi, smart home features, local guides).
- Highlight unique local experiences or amenities relevant to the primary guest profile.
- Consider seasonal promotions aligned with peak travel times for key origin markets.
Nearby Short-Term Rental Market Comparison
How does the Moqhaka Local Municipality Airbnb market stack up against its neighbors? Compare key performance metrics like average monthly revenue, ADR, and occupancy rates in surrounding areas to understand the broader regional STR landscape.
| Market | Active Properties | Monthly Revenue | Daily Rate | Avg. Occupancy |
|---|---|---|---|---|
| Metsimaholo Local Municipality | 44 | $1,245 | $153.66 | 24% |
| Ngwathe Local Municipality | 102 | $760 | $115.68 | 25% |
| Dihlabeng Local Municipality | 378 | $708 | $105.67 | 25% |
| Rosebank | 612 | $692 | $78.11 | 38% |
| Emfuleni Local Municipality | 101 | $640 | $134.88 | 19% |
| Sandton | 1,347 | $587 | $77.74 | 36% |
| Clarens | 15 | $580 | $104.95 | 27% |
| Midvaal Local Municipality | 51 | $566 | $96.75 | 22% |
| Randburg | 724 | $539 | $64.79 | 35% |
| Bedfordview | 12 | $431 | $76.63 | 29% |