Inxuba Yethemba Local Municipality Airbnb Market Analysis 2026: Short Term Rental Data & Vacation Rental Statistics in Eastern Cape, South Africa
Is Airbnb profitable in Inxuba Yethemba Local Municipality in 2026? Explore comprehensive Airbnb analytics for Inxuba Yethemba Local Municipality, Eastern Cape, South Africa to uncover income potential. This 2026 STR market report for Inxuba Yethemba Local Municipality, based on AirROI data from February 2025 to January 2026, reveals key trends in the niche market of 57 active listings.
Whether you're considering an Airbnb investment in Inxuba Yethemba Local Municipality, optimizing your existing vacation rental, or exploring rental arbitrage opportunities, understanding the Inxuba Yethemba Local Municipality Airbnb data is crucial. Leveraging the low regulation environment is key to maximizing your short term rental income potential. Let's dive into the specifics.
Key Inxuba Yethemba Local Municipality Airbnb Performance Metrics Overview
Monthly Airbnb Revenue Variations & Income Potential in Inxuba Yethemba Local Municipality (2026)
Understanding the monthly revenue variations for Airbnb listings in Inxuba Yethemba Local Municipality is key to maximizing your short term rental income potential. Seasonality significantly impacts earnings. Our analysis, based on data from the past 12 months, shows that the peak revenue month for STRs in Inxuba Yethemba Local Municipality is typically July, while January often presents the lowest earnings, highlighting opportunities for strategic pricing adjustments during shoulder and low seasons. Explore the typical Airbnb income in Inxuba Yethemba Local Municipality across different performance tiers:
- Best-in-class properties (Top 10%) achieve $689+ monthly, often utilizing dynamic pricing and superior guest experiences.
- Strong performing properties (Top 25%) earn $423 or more, indicating effective management and desirable locations/amenities.
- Typical properties (Median) generate around $196 per month, representing the average market performance.
- Entry-level properties (Bottom 25%) see earnings around $104, often with potential for optimization.
Average Monthly Airbnb Earnings Trend in Inxuba Yethemba Local Municipality
Inxuba Yethemba Local Municipality Airbnb Occupancy Rate Trends (2026)
Maximize your bookings by understanding the Inxuba Yethemba Local Municipality STR occupancy trends. Seasonal demand shifts significantly influence how often properties are booked. Typically, Julysees the highest demand (peak season occupancy), while January experiences the lowest (low season). Effective strategies, like adjusting minimum stays or offering promotions, can boost occupancy during slower periods. Here's how different property tiers perform in Inxuba Yethemba Local Municipality:
- Best-in-class properties (Top 10%) achieve 49%+ occupancy, indicating high desirability and potentially optimized availability.
- Strong performing properties (Top 25%) maintain 31% or higher occupancy, suggesting good market fit and guest satisfaction.
- Typical properties (Median) have an occupancy rate around 15%.
- Entry-level properties (Bottom 25%) average 8% occupancy, potentially facing higher vacancy.
Average Monthly Occupancy Rate Trend in Inxuba Yethemba Local Municipality
Average Daily Rate (ADR) Airbnb Trends in Inxuba Yethemba Local Municipality (2026)
Effective short term rental pricing strategy in Inxuba Yethemba Local Municipality involves understanding monthly ADR fluctuations. The Average Daily Rate (ADR) for Airbnb in Inxuba Yethemba Local Municipality typically peaks in January and dips lowest during March. Leveraging Airbnb dynamic pricing tools or strategies based on this seasonality can significantly boost revenue. Here's a look at the typical nightly rates achieved:
- Best-in-class properties (Top 10%) command rates of $73+ per night, often due to premium features or locations.
- Strong performing properties (Top 25%) achieve nightly rates of $57 or more.
- Typical properties (Median) charge around $45 per night.
- Entry-level properties (Bottom 25%) earn around $32 per night.
Average Daily Rate (ADR) Trend by Month in Inxuba Yethemba Local Municipality
Get Live Inxuba Yethemba Local Municipality Market Intelligence 👇

Explore Real-time Analytics
Airbnb Seasonality Analysis & Trends in Inxuba Yethemba Local Municipality (2026)
Peak Season (July, December, March)
- Revenue averages $389 per month
- Occupancy rates average 26.4%
- Daily rates average $49
Shoulder Season
- Revenue averages $300 per month
- Occupancy maintains around 20.9%
- Daily rates hold near $49
Low Season (January, May, June)
- Revenue drops to average $253 per month
- Occupancy decreases to average 17.7%
- Daily rates adjust to average $49
Seasonality Insights for Inxuba Yethemba Local Municipality
- The Airbnb seasonality in Inxuba Yethemba Local Municipality shows moderate seasonality with distinct peak and low periods. While the sections above show seasonal averages, it's also insightful to look at the extremes:
- During the high season, the absolute peak month showcases Inxuba Yethemba Local Municipality's highest earning potential, with monthly revenues capable of climbing to $406, occupancy reaching a high of 27.4%, and ADRs peaking at $51.
- Conversely, the slowest single month of the year, typically falling within the low season, marks the market's lowest point. In this month, revenue might dip to $220, occupancy could drop to 14.5%, and ADRs may adjust down to $48.
- Understanding both the seasonal averages and these monthly peaks and troughs in revenue, occupancy, and ADR is crucial for maximizing your Airbnb profit potential in Inxuba Yethemba Local Municipality.
Seasonal Strategies for Maximizing Profit
- Peak Season: Maximize revenue through premium pricing and potentially longer minimum stays. Ensure high availability.
- Low Season: Offer competitive pricing, special promotions (e.g., extended stay discounts), and flexible cancellation policies. Target off-season travelers like remote workers or budget-conscious guests.
- Shoulder Seasons: Implement dynamic pricing that balances peak and low rates. Target weekend travelers or specific events. Offer slightly more flexible terms than peak season.
- Regularly analyze your own performance against these Inxuba Yethemba Local Municipality seasonality benchmarks and adjust your pricing and availability strategy accordingly.
Best Areas for Airbnb Investment in Inxuba Yethemba Local Municipality (2026)
Exploring the top neighborhoods for short-term rentals in Inxuba Yethemba Local Municipality? This section highlights key areas, outlining why they are attractive for hosts and guests, along with notable local attractions. Consider these locations based on your target guest profile and investment strategy.
| Neighborhood / Area | Why Host Here? (Target Guests & Appeal) | Key Attractions & Landmarks |
|---|---|---|
| Cradock | A charming town, known for its historical significance and Karoo hospitality. Ideal for guests looking to explore the Great Karoo region with easy access to various natural attractions. | Cradock Four Passes, Karoo Nature Reserve, Cradock Museum, Zuurberg Pass, Historical buildings of Cradock |
| Somerset East | Nestled at the foot of the picturesque Boschberg Mountains, Somerset East is great for nature lovers and those interested in historical architecture and outdoor activities. | Boschberg Nature Reserve, Somerset East Historical Museum, St. Jude's Church, Kelly's View, Local hiking trails |
| Pearston | A small town that offers a peaceful retreat in the Eastern Cape, ideal for guests wanting to immerse themselves in rural life and community. | Local farms, Historical sites, Pearston Lodge, Nature walks, Community markets |
| Cookhouse | An agricultural town known for its beautiful scenery and close-knit community, providing a serene getaway for visitors wanting to experience rural South Africa. | Local farms, Cookhouse Historical Museum, Picnic spots, Nature trails, Wildlife viewing |
| Grahamstown (Makhanda) | Known for its annual arts festival and rich historical background, this university town attracts cultural enthusiasts and students. | National Arts Festival, Rhodes University, Cheap Suite Museum, Fort England, African Heritage sites |
| Fort Beaufort | A small town rich in historical significance, it offers a glimpse into the colonial past of South Africa and attracts history buffs and nature lovers alike. | Fort Beaufort Museum, Bushman’s River, Nature reserves, Historical buildings, Local craft markets |
| Alice | Home to the University of Fort Hare, Alice is a vibrant town attracting students and visitors interested in educational tourism and historical exploration. | University of Fort Hare, Alice Museum, Ngqushwa Local Municipality, Nature reserves, Cultural experiences |
| Bedford | A quaint village known for its charming architecture and tranquil surroundings, ideal for those looking for a peaceful rural escape with a touch of history. | Bedford Museum, Local artisan shops, St. Michael's Church, Hiking trails, Nature reserves |
Understanding Airbnb License Requirements & STR Laws in Inxuba Yethemba Local Municipality (2026)
While Inxuba Yethemba Local Municipality, Eastern Cape, South Africa currently shows low STR regulations, specific Airbnb license requirements might still exist or change. Always verify the latest short term rental regulations and Airbnb license requirements directly with local government authorities for Inxuba Yethemba Local Municipality to ensure full compliance before hosting.
(Source: AirROI data, 2026, finding no licensed listings among those analyzed)
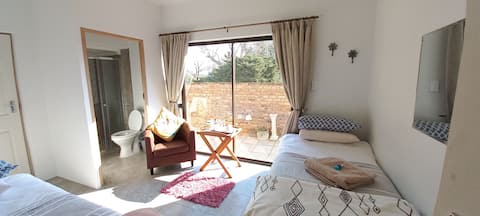
Top Performing Airbnb Properties in Inxuba Yethemba Local Municipality (2026)
Benchmark your potential! Explore examples of top-performing Airbnb properties in Inxuba Yethemba Local Municipalitybased on Trailing Twelve Month (TTM) revenue. Analyze their characteristics, revenue, occupancy rate, and ADR to understand what drives success in this market.
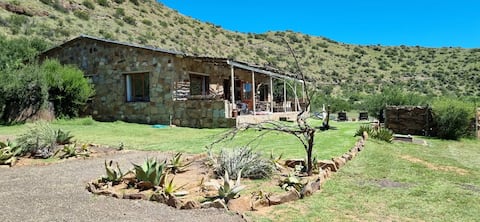
Karoo Ridge River Lodge
Entire Place • 4 bedrooms

The Self-Catering Cottage House
Entire Place • 1 bedroom

Peaceful gem in the historic town of Cradock
Private Room • 1 bedroom
Starry Nights 1
Entire Place • 2 bedrooms

Doringvygie
Entire Place • 3 bedrooms

Midholme Farm Stay
Entire Place • 2 bedrooms
Note: Performance varies based on location, size, amenities, seasonality, and management quality. Data reflects the past 12 months.
Top Performing Airbnb Hosts in Inxuba Yethemba Local Municipality (2026)
Learn from the best! This table showcases top-performing Airbnb hosts in Inxuba Yethemba Local Municipality based on the number of properties managed and estimated total revenue over the past year. Analyze their scale and performance metrics.
| Host Name | Properties | Grossing Revenue | Stay Reviews | Avg Rating |
|---|---|---|---|---|
| Helen | 1 | $12,928 | 108 | 4.99/5.0 |
| Altus | 1 | $10,073 | 51 | 5.00/5.0 |
| Deone | 6 | $7,722 | 40 | 3.96/5.0 |
| Freyni | 3 | $5,470 | 11 | 4.71/5.0 |
| Andre | 4 | $5,447 | 168 | 4.90/5.0 |
| James | 1 | $5,398 | 30 | 5.00/5.0 |
| Helga | 1 | $4,112 | 11 | 4.64/5.0 |
| Lisa | 1 | $3,815 | 12 | 5.00/5.0 |
| Marna | 1 | $3,605 | 124 | 4.77/5.0 |
| Jan Joan | 2 | $3,517 | 193 | 4.88/5.0 |
Analyzing the strategies of top hosts, such as their property selection, pricing, and guest communication, can offer valuable lessons for optimizing your own Airbnb operations in Inxuba Yethemba Local Municipality.
Dive Deeper: Advanced Inxuba Yethemba Local Municipality STR Market Data (2026)
Ready to unlock more insights? AirROI provides access to advanced metrics and comprehensive Airbnb data for Inxuba Yethemba Local Municipality. Explore detailed analytics beyond this report to refine your investment strategy, optimize pricing, and maximize your vacation rental profits.
Explore Advanced MetricsInxuba Yethemba Local Municipality Short-Term Rental Market Composition (2026): Property & Room Types
Room Type Distribution
Property Type Distribution
Market Composition Insights for Inxuba Yethemba Local Municipality
- The Inxuba Yethemba Local Municipality Airbnb market composition is heavily skewed towards Private Room listings, which make up 68.4% of the 57 active rentals. This indicates strong guest preference for privacy and space.
- Looking at the property type distribution in Inxuba Yethemba Local Municipality, Hotel/Boutique properties are the most common (49.1%), reflecting the local real estate landscape.
- The presence of 49.1% Hotel/Boutique listings indicates integration with traditional hospitality.
Inxuba Yethemba Local Municipality Airbnb Room Capacity Analysis (2026): Bedroom Distribution
Distribution of Listings by Number of Bedrooms
Room Capacity Insights for Inxuba Yethemba Local Municipality
- The dominant room capacity in Inxuba Yethemba Local Municipality is 1 bedroom listings, making up 40.4% of the market. This suggests a strong demand for properties suitable for couples or solo travelers.
- Together, 1 bedroom and 2 bedrooms properties represent 52.7% of the active Airbnb listings in Inxuba Yethemba Local Municipality, indicating a high concentration in these sizes.
Inxuba Yethemba Local Municipality Vacation Rental Guest Capacity Trends (2026)
Distribution of Listings by Guest Capacity
Guest Capacity Insights for Inxuba Yethemba Local Municipality
- The most common guest capacity trend in Inxuba Yethemba Local Municipality vacation rentals is listings accommodating 2 guests (21.1%). This suggests the primary traveler segment is likely couples or solo travelers.
- Properties designed for 2 guests and 4 guests dominate the Inxuba Yethemba Local Municipality STR market, accounting for 38.6% of listings.
- 10.6% of properties accommodate 6+ guests, serving the market segment for larger families or group travel in Inxuba Yethemba Local Municipality.
- On average, properties in Inxuba Yethemba Local Municipality are equipped to host 2.5 guests.
Inxuba Yethemba Local Municipality Airbnb Booking Patterns (2026): Available vs. Booked Days
Available Days Distribution
Booked Days Distribution
Booking Pattern Insights for Inxuba Yethemba Local Municipality
- The most common availability pattern in Inxuba Yethemba Local Municipality falls within the 271-366 days range, representing 93% of listings. This suggests many properties have significant open periods on their calendars.
- Approximately 98.3% of listings show high availability (181+ days open annually), indicating potential for increased bookings or specific owner usage patterns.
- For booked days, the 1-30 days range is most frequent in Inxuba Yethemba Local Municipality (64.9%), reflecting common guest stay durations or potential owner blocking patterns.
- A notable 1.8% of properties secure long booking periods (181+ days booked per year), highlighting successful long-term rental strategies or significant owner usage.
Inxuba Yethemba Local Municipality Airbnb Minimum Stay Requirements Analysis
Distribution of Listings by Minimum Night Requirement
1 Night
55 listings
96.5% of total
2 Nights
1 listings
1.8% of total
3 Nights
1 listings
1.8% of total
Key Insights
- The most prevalent minimum stay requirement in Inxuba Yethemba Local Municipality is 1 Night, adopted by 96.5% of listings. This highlights the market's preference for shorter, flexible bookings.
- A strong majority (98.3%) of the Inxuba Yethemba Local Municipality Airbnb data shows acceptance of very short stays (1-2 nights), indicating a dynamic, high-turnover market.
Recommendations
- Align with the market by considering a 1 Night minimum stay, as 96.5% of Inxuba Yethemba Local Municipality hosts use this setting.
- Adjust minimum nights based on seasonality – potentially shorter during low season and longer during peak demand periods in Inxuba Yethemba Local Municipality.
Inxuba Yethemba Local Municipality Airbnb Cancellation Policy Trends Analysis (2026)
Refundable
6 listings
10.5% of total
Non-refundable
4 listings
7% of total
Flexible
28 listings
49.1% of total
Moderate
8 listings
14% of total
Firm
11 listings
19.3% of total
Cancellation Policy Insights for Inxuba Yethemba Local Municipality
- The prevailing Airbnb cancellation policy trend in Inxuba Yethemba Local Municipality is Flexible, used by 49.1% of listings.
- There's a relatively balanced mix between guest-friendly (63.1%) and stricter (19.3%) policies, offering choices for different guest needs.
Recommendations for Hosts
- Consider adopting a Flexible policy to align with the 49.1% market standard in Inxuba Yethemba Local Municipality.
- Regularly review your cancellation policy against competitors and market demand shifts in Inxuba Yethemba Local Municipality.
Inxuba Yethemba Local Municipality STR Booking Lead Time Analysis (2026)
Average Booking Lead Time by Month
Booking Lead Time Insights for Inxuba Yethemba Local Municipality
- The overall average booking lead time for vacation rentals in Inxuba Yethemba Local Municipality is 39 days.
- Guests book furthest in advance for stays during October (average 64 days), likely coinciding with peak travel demand or local events.
- The shortest booking windows occur for stays in June (average 19 days), indicating more last-minute travel plans during this time.
- Seasonally, Fall (53 days avg.) sees the longest lead times, while Winter (35 days avg.) has the shortest, reflecting typical travel planning cycles.
Recommendations for Hosts
- Use the overall average lead time (39 days) as a baseline for your pricing and availability strategy in Inxuba Yethemba Local Municipality.
- For October stays, consider implementing length-of-stay discounts or slightly higher rates for bookings made less than 64 days out to capitalize on advance planning.
- Target marketing efforts for the Fall season well in advance (at least 53 days) to capture early planners.
- Monitor your own booking lead times against these Inxuba Yethemba Local Municipality averages to identify opportunities for dynamic pricing adjustments.
Popular & Essential Airbnb Amenities in Inxuba Yethemba Local Municipality (2026)
Amenity Prevalence
Amenity Insights for Inxuba Yethemba Local Municipality
- Essential amenities in Inxuba Yethemba Local Municipality that guests expect include: Free parking on premises. Lacking these (this) could significantly impact bookings.
- Popular amenities like Wifi, Essentials, TV are common but not universal. Offering these can provide a competitive edge.
- A pool is a highly desired but not standard amenity, making it a key feature for attracting guests seeking leisure in Inxuba Yethemba Local Municipality.
- Warning: Wifi is not universally provided but is considered essential globally. Ensure reliable Wifi is offered.
Recommendations for Hosts
- Ensure your listing includes all essential amenities for Inxuba Yethemba Local Municipality: Free parking on premises.
- Prioritize adding missing essentials: Free parking on premises.
- Consider adding popular differentiators like Wifi or Essentials to increase appeal.
- Highlight unique or less common amenities you offer (e.g., hot tub, dedicated workspace, EV charger) in your listing description and photos.
- Regularly check competitor amenities in Inxuba Yethemba Local Municipality to stay competitive.
Inxuba Yethemba Local Municipality Airbnb Guest Demographics & Profile Analysis (2026)
Guest Profile Summary for Inxuba Yethemba Local Municipality
- The typical guest profile for Airbnb in Inxuba Yethemba Local Municipality consists of primarily domestic travelers (76%), often arriving from nearby Cape Town, typically belonging to the Post-2000s (Gen Z/Alpha) group (50%), primarily speaking English or Afrikaans.
- Domestic travelers account for 76.3% of guests.
- Key international markets include South Africa (76.3%) and Germany (7.5%).
- Top languages spoken are English (60%) followed by Afrikaans (21.4%).
- A significant demographic segment is the Post-2000s (Gen Z/Alpha) group, representing 50% of guests.
Recommendations for Hosts
- Target domestic marketing efforts towards travelers from Cape Town and Johannesburg.
- Tailor amenities and listing descriptions to appeal to the dominant Post-2000s (Gen Z/Alpha) demographic (e.g., highlight fast WiFi, smart home features, local guides).
- Highlight unique local experiences or amenities relevant to the primary guest profile.
- Consider seasonal promotions aligned with peak travel times for key origin markets.
Nearby Short-Term Rental Market Comparison
How does the Inxuba Yethemba Local Municipality Airbnb market stack up against its neighbors? Compare key performance metrics like average monthly revenue, ADR, and occupancy rates in surrounding areas to understand the broader regional STR landscape.
| Market | Active Properties | Monthly Revenue | Daily Rate | Avg. Occupancy |
|---|---|---|---|---|
| Camdeboo Local Municipality | 202 | $421 | $72.61 | 25% |
| Nkonkobe Local Municipality | 81 | $407 | $72.82 | 23% |
| Gariep Local Municipality | 12 | $331 | $62.81 | 23% |
| Umsobomvu Local Municipality | 79 | $322 | $54.11 | 26% |
| Kopanong Local Municipality | 69 | $301 | $58.93 | 22% |
| Emthanjeni Local Municipality | 40 | $244 | $61.53 | 19% |
| Lukhanji Local Municipality | 35 | $109 | $46.39 | 15% |
| Mohokare Local Municipality | 14 | $104 | $44.94 | 18% |
| Blue Crane Route Local Municipality | 10 | $85 | $57.78 | 19% |