Vysoké Tatry Airbnb Market Analysis 2026: Short Term Rental Data & Vacation Rental Statistics in Region of Prešov, Slovakia
Is Airbnb profitable in Vysoké Tatry in 2026? Explore comprehensive Airbnb analytics for Vysoké Tatry, Region of Prešov, Slovakia to uncover income potential. This 2026 STR market report for Vysoké Tatry, based on AirROI data from February 2025 to January 2026, reveals key trends in the niche market of 140 active listings.
Whether you're considering an Airbnb investment in Vysoké Tatry, optimizing your existing vacation rental, or exploring rental arbitrage opportunities, understanding the Vysoké Tatry Airbnb data is crucial. Leveraging the low regulation environment is key to maximizing your short term rental income potential. Let's dive into the specifics.
Key Vysoké Tatry Airbnb Performance Metrics Overview
Monthly Airbnb Revenue Variations & Income Potential in Vysoké Tatry (2026)
Understanding the monthly revenue variations for Airbnb listings in Vysoké Tatry is key to maximizing your short term rental income potential. Seasonality significantly impacts earnings. Our analysis, based on data from the past 12 months, shows that the peak revenue month for STRs in Vysoké Tatry is typically August, while April often presents the lowest earnings, highlighting opportunities for strategic pricing adjustments during shoulder and low seasons. Explore the typical Airbnb income in Vysoké Tatry across different performance tiers:
- Best-in-class properties (Top 10%) achieve $2,348+ monthly, often utilizing dynamic pricing and superior guest experiences.
- Strong performing properties (Top 25%) earn $1,438 or more, indicating effective management and desirable locations/amenities.
- Typical properties (Median) generate around $808 per month, representing the average market performance.
- Entry-level properties (Bottom 25%) see earnings around $426, often with potential for optimization.
Average Monthly Airbnb Earnings Trend in Vysoké Tatry
Vysoké Tatry Airbnb Occupancy Rate Trends (2026)
Maximize your bookings by understanding the Vysoké Tatry STR occupancy trends. Seasonal demand shifts significantly influence how often properties are booked. Typically, Augustsees the highest demand (peak season occupancy), while November experiences the lowest (low season). Effective strategies, like adjusting minimum stays or offering promotions, can boost occupancy during slower periods. Here's how different property tiers perform in Vysoké Tatry:
- Best-in-class properties (Top 10%) achieve 52%+ occupancy, indicating high desirability and potentially optimized availability.
- Strong performing properties (Top 25%) maintain 36% or higher occupancy, suggesting good market fit and guest satisfaction.
- Typical properties (Median) have an occupancy rate around 21%.
- Entry-level properties (Bottom 25%) average 13% occupancy, potentially facing higher vacancy.
Average Monthly Occupancy Rate Trend in Vysoké Tatry
Average Daily Rate (ADR) Airbnb Trends in Vysoké Tatry (2026)
Effective short term rental pricing strategy in Vysoké Tatry involves understanding monthly ADR fluctuations. The Average Daily Rate (ADR) for Airbnb in Vysoké Tatry typically peaks in January and dips lowest during November. Leveraging Airbnb dynamic pricing tools or strategies based on this seasonality can significantly boost revenue. Here's a look at the typical nightly rates achieved:
- Best-in-class properties (Top 10%) command rates of $246+ per night, often due to premium features or locations.
- Strong performing properties (Top 25%) achieve nightly rates of $158 or more.
- Typical properties (Median) charge around $116 per night.
- Entry-level properties (Bottom 25%) earn around $87 per night.
Average Daily Rate (ADR) Trend by Month in Vysoké Tatry
Get Live Vysoké Tatry Market Intelligence 👇

Explore Real-time Analytics
Airbnb Seasonality Analysis & Trends in Vysoké Tatry (2026)
Peak Season (August, July, February)
- Revenue averages $1,702 per month
- Occupancy rates average 37.0%
- Daily rates average $148
Shoulder Season
- Revenue averages $1,043 per month
- Occupancy maintains around 24.6%
- Daily rates hold near $142
Low Season (March, April, November)
- Revenue drops to average $767 per month
- Occupancy decreases to average 18.9%
- Daily rates adjust to average $137
Seasonality Insights for Vysoké Tatry
- The Airbnb seasonality in Vysoké Tatry shows highly seasonal trends requiring careful strategy. While the sections above show seasonal averages, it's also insightful to look at the extremes:
- During the high season, the absolute peak month showcases Vysoké Tatry's highest earning potential, with monthly revenues capable of climbing to $1,879, occupancy reaching a high of 39.5%, and ADRs peaking at $154.
- Conversely, the slowest single month of the year, typically falling within the low season, marks the market's lowest point. In this month, revenue might dip to $704, occupancy could drop to 17.6%, and ADRs may adjust down to $134.
- Understanding both the seasonal averages and these monthly peaks and troughs in revenue, occupancy, and ADR is crucial for maximizing your Airbnb profit potential in Vysoké Tatry.
Seasonal Strategies for Maximizing Profit
- Peak Season: Maximize revenue through premium pricing and potentially longer minimum stays. Ensure high availability.
- Low Season: Offer competitive pricing, special promotions (e.g., extended stay discounts), and flexible cancellation policies. Target off-season travelers like remote workers or budget-conscious guests.
- Shoulder Seasons: Implement dynamic pricing that balances peak and low rates. Target weekend travelers or specific events. Offer slightly more flexible terms than peak season.
- Regularly analyze your own performance against these Vysoké Tatry seasonality benchmarks and adjust your pricing and availability strategy accordingly.
Best Areas for Airbnb Investment in Vysoké Tatry (2026)
Exploring the top neighborhoods for short-term rentals in Vysoké Tatry? This section highlights key areas, outlining why they are attractive for hosts and guests, along with notable local attractions. Consider these locations based on your target guest profile and investment strategy.
| Neighborhood / Area | Why Host Here? (Target Guests & Appeal) | Key Attractions & Landmarks |
|---|---|---|
| Štrbské Pleso | A picturesque glacial lake and popular destination for skiing, hiking, and nature activities. An excellent choice for year-round hosting given its appeal to both summer and winter tourists. | Štrbské Pleso Lake, Tatra National Park, Ski Resort Štrbské Pleso, Mountain trails, Cable cars to Hrebienok |
| Starý Smokovec | Known for its charming alpine atmosphere and proximity to hiking trails and ski resorts. It's a gateway to the High Tatras, attracting outdoor enthusiasts and families alike. | Cable Car to Hrebienok, Tatra Museum, Tennis courts, Hiking trails, Skiing opportunities |
| Hrebienok | A popular mountain that offers stunning views and great hiking trails. Attracts visitors in both winter and summer, making it a great site for Airbnb. | Hrebienok Mountain, Hrebienok Waterfalls, Café and restaurants, Various hiking routes, Skiing facilities |
| Tatranská Lomnica | One of the largest settlements in the High Tatra Mountains, it offers a range of activities from skiing to hiking and has good public transport connections. | Tatranská Lomnica Ski Resort, The Lomnicky Peak, Mountain hiking routes, Botanical Garden, Historic villas |
| Liptovský Jan | Located near the High Tatras, this area is famous for wellness and relaxation, appealing to guests looking for spa experiences and natural beauty. | Thermal springs, Spa hotels, Hiking trails, Close to Tatra Mountains, Historical architecture |
| Poprad | A larger town that serves as a hub for tourists visiting the High Tatras. Offers amenities, restaurants and easy access to nature. | AquaCity Poprad, Poprad-Tatry Airport, Tatranská galéria, Historic square, Shopping opportunities |
| Gerlachovský Peak | The highest peak in the High Tatras, drawing adventurous tourists interested in mountain climbing and breathtaking views. | Gerlachovský Peak, Mountain climbing routes, Protected areas, Scenic valleys, Flora and fauna diversity |
| Nová Lesná | A small town with a peaceful atmosphere, ideal for travelers looking for tranquility while being close to the attractions of the Tatras. | Quiet surroundings, Access to hiking trails, Local restaurants, Traditional architecture, Views of the Tatras |
Understanding Airbnb License Requirements & STR Laws in Vysoké Tatry (2026)
While Vysoké Tatry, Region of Prešov, Slovakia currently shows low STR regulations, specific Airbnb license requirements might still exist or change. Always verify the latest short term rental regulations and Airbnb license requirements directly with local government authorities for Vysoké Tatry to ensure full compliance before hosting.
(Source: AirROI data, 2026, finding no licensed listings among those analyzed)
Top Performing Airbnb Properties in Vysoké Tatry (2026)
Benchmark your potential! Explore examples of top-performing Airbnb properties in Vysoké Tatrybased on Trailing Twelve Month (TTM) revenue. Analyze their characteristics, revenue, occupancy rate, and ADR to understand what drives success in this market.
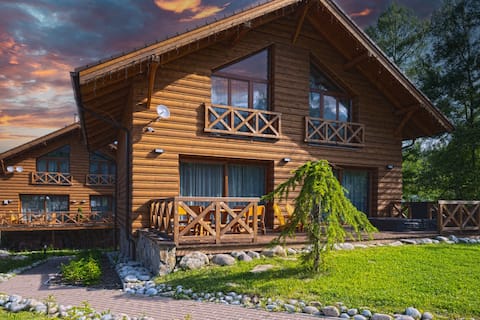
Luxurious chalet with a private jacuzzi
Entire Place • 4 bedrooms
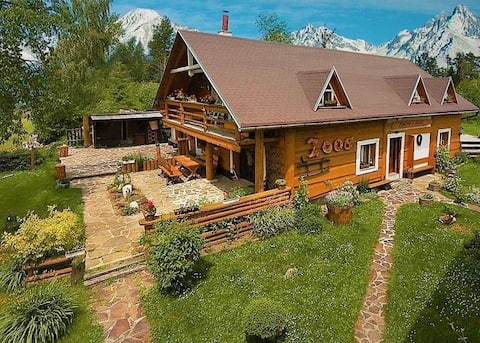
Drevenica V Ihličí - High Tatras
Entire Place • 5 bedrooms
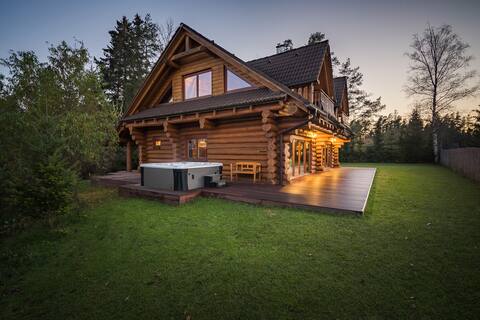
Luxury Chalet in High Tatras
Entire Place • 4 bedrooms

Jambrichova chata
Entire Place • 3 bedrooms

5*VILA STUDIENKA VYSOKE TATRY, BEST LOCATION
Entire Place • 3 bedrooms

Two-bedroom apartment HOREC
Entire Place • 2 bedrooms
Note: Performance varies based on location, size, amenities, seasonality, and management quality. Data reflects the past 12 months.
Top Performing Airbnb Hosts in Vysoké Tatry (2026)
Learn from the best! This table showcases top-performing Airbnb hosts in Vysoké Tatry based on the number of properties managed and estimated total revenue over the past year. Analyze their scale and performance metrics.
| Host Name | Properties | Grossing Revenue | Stay Reviews | Avg Rating |
|---|---|---|---|---|
| Apartments | 19 | $190,307 | 100 | 4.91/5.0 |
| Chalets Royal | 3 | $78,934 | 40 | 4.99/5.0 |
| Vila | 7 | $59,531 | 88 | 4.94/5.0 |
| Viktor | 1 | $52,469 | 3 | 5.00/5.0 |
| Daniela | 8 | $51,676 | 62 | 4.60/5.0 |
| Jan | 1 | $49,025 | 4 | 5.00/5.0 |
| Marcela | 2 | $41,607 | 4 | 4.33/5.0 |
| Emma | 1 | $37,024 | 13 | 5.00/5.0 |
| Martin | 3 | $36,848 | 130 | 4.95/5.0 |
| Lucia | 1 | $34,361 | 31 | 4.94/5.0 |
Analyzing the strategies of top hosts, such as their property selection, pricing, and guest communication, can offer valuable lessons for optimizing your own Airbnb operations in Vysoké Tatry.
Dive Deeper: Advanced Vysoké Tatry STR Market Data (2026)
Ready to unlock more insights? AirROI provides access to advanced metrics and comprehensive Airbnb data for Vysoké Tatry. Explore detailed analytics beyond this report to refine your investment strategy, optimize pricing, and maximize your vacation rental profits.
Explore Advanced MetricsVysoké Tatry Short-Term Rental Market Composition (2026): Property & Room Types
Room Type Distribution
Property Type Distribution
Market Composition Insights for Vysoké Tatry
- The Vysoké Tatry Airbnb market composition is heavily skewed towards Entire Home/Apt listings, which make up 87.9% of the 140 active rentals. This indicates strong guest preference for privacy and space.
- Looking at the property type distribution in Vysoké Tatry, Apartment/Condo properties are the most common (81.4%), reflecting the local real estate landscape.
- Smaller segments like outdoor/unique, hotel/boutique, others (combined 4.9%) offer potential for unique stay experiences.
Vysoké Tatry Airbnb Room Capacity Analysis (2026): Bedroom Distribution
Distribution of Listings by Number of Bedrooms
Room Capacity Insights for Vysoké Tatry
- The dominant room capacity in Vysoké Tatry is 1 bedroom listings, making up 49.3% of the market. This suggests a strong demand for properties suitable for couples or solo travelers.
- Together, 1 bedroom and 2 bedrooms properties represent 79.3% of the active Airbnb listings in Vysoké Tatry, indicating a high concentration in these sizes.
Vysoké Tatry Vacation Rental Guest Capacity Trends (2026)
Distribution of Listings by Guest Capacity
Guest Capacity Insights for Vysoké Tatry
- The most common guest capacity trend in Vysoké Tatry vacation rentals is listings accommodating 4 guests (33.6%). This suggests the primary traveler segment is likely small families or groups.
- Properties designed for 4 guests and 2 guests dominate the Vysoké Tatry STR market, accounting for 50.7% of listings.
- 25.7% of properties accommodate 6+ guests, serving the market segment for larger families or group travel in Vysoké Tatry.
- On average, properties in Vysoké Tatry are equipped to host 4.1 guests.
Vysoké Tatry Airbnb Booking Patterns (2026): Available vs. Booked Days
Available Days Distribution
Booked Days Distribution
Booking Pattern Insights for Vysoké Tatry
- The most common availability pattern in Vysoké Tatry falls within the 271-366 days range, representing 77.9% of listings. This suggests many properties have significant open periods on their calendars.
- Approximately 97.2% of listings show high availability (181+ days open annually), indicating potential for increased bookings or specific owner usage patterns.
- For booked days, the 31-90 days range is most frequent in Vysoké Tatry (45.7%), reflecting common guest stay durations or potential owner blocking patterns.
- A notable 3.6% of properties secure long booking periods (181+ days booked per year), highlighting successful long-term rental strategies or significant owner usage.
Vysoké Tatry Airbnb Minimum Stay Requirements Analysis
Distribution of Listings by Minimum Night Requirement
1 Night
14 listings
10% of total
2 Nights
66 listings
47.1% of total
3 Nights
6 listings
4.3% of total
4-6 Nights
3 listings
2.1% of total
30+ Nights
51 listings
36.4% of total
Key Insights
- The most prevalent minimum stay requirement in Vysoké Tatry is 2 Nights, adopted by 47.1% of listings. This highlights the market's preference for shorter, flexible bookings.
- A significant segment (36.4%) caters to monthly stays (30+ nights) in Vysoké Tatry, pointing to opportunities in the extended-stay market.
Recommendations
- Align with the market by considering a 2 Nights minimum stay, as 47.1% of Vysoké Tatry hosts use this setting.
- If feasible, allowing 1-night stays, especially midweek or during low season, could capture last-minute bookings, as only 10% currently do.
- A 2-night minimum appears standard (47.1%). Consider this for weekends or peak periods.
- Explore offering discounts for stays of 30+ nights to attract the 36.4% of the market seeking extended stays.
- Adjust minimum nights based on seasonality – potentially shorter during low season and longer during peak demand periods in Vysoké Tatry.
Vysoké Tatry Airbnb Cancellation Policy Trends Analysis (2026)
Super Strict 30 Days
1 listings
0.7% of total
Flexible
31 listings
22.1% of total
Moderate
54 listings
38.6% of total
Firm
41 listings
29.3% of total
Strict
13 listings
9.3% of total
Cancellation Policy Insights for Vysoké Tatry
- The prevailing Airbnb cancellation policy trend in Vysoké Tatry is Moderate, used by 38.6% of listings.
- There's a relatively balanced mix between guest-friendly (60.7%) and stricter (38.6%) policies, offering choices for different guest needs.
- Strict cancellation policies are quite rare (9.3%), potentially making listings with this policy less competitive unless justified by high demand or property type.
Recommendations for Hosts
- Consider adopting a Moderate policy to align with the 38.6% market standard in Vysoké Tatry.
- Using a Strict policy might deter some guests, as only 9.3% of listings use it. Evaluate if potential revenue protection outweighs possible lower booking rates.
- Regularly review your cancellation policy against competitors and market demand shifts in Vysoké Tatry.
Vysoké Tatry STR Booking Lead Time Analysis (2026)
Average Booking Lead Time by Month
Booking Lead Time Insights for Vysoké Tatry
- The overall average booking lead time for vacation rentals in Vysoké Tatry is 53 days.
- Guests book furthest in advance for stays during December (average 68 days), likely coinciding with peak travel demand or local events.
- The shortest booking windows occur for stays in November (average 27 days), indicating more last-minute travel plans during this time.
- Seasonally, Winter (63 days avg.) sees the longest lead times, while Spring (42 days avg.) has the shortest, reflecting typical travel planning cycles.
Recommendations for Hosts
- Use the overall average lead time (53 days) as a baseline for your pricing and availability strategy in Vysoké Tatry.
- For December stays, consider implementing length-of-stay discounts or slightly higher rates for bookings made less than 68 days out to capitalize on advance planning.
- Target marketing efforts for the Winter season well in advance (at least 63 days) to capture early planners.
- Monitor your own booking lead times against these Vysoké Tatry averages to identify opportunities for dynamic pricing adjustments.
Popular & Essential Airbnb Amenities in Vysoké Tatry (2026)
Amenity Prevalence
Amenity Insights for Vysoké Tatry
- Essential amenities in Vysoké Tatry that guests expect include: TV, Wifi. Lacking these (any) could significantly impact bookings.
- Popular amenities like Heating, Kitchen, Essentials are common but not universal. Offering these can provide a competitive edge.
Recommendations for Hosts
- Ensure your listing includes all essential amenities for Vysoké Tatry: TV, Wifi.
- Prioritize adding missing essentials: TV, Wifi.
- Consider adding popular differentiators like Heating or Kitchen to increase appeal.
- Highlight unique or less common amenities you offer (e.g., hot tub, dedicated workspace, EV charger) in your listing description and photos.
- Regularly check competitor amenities in Vysoké Tatry to stay competitive.
Vysoké Tatry Airbnb Guest Demographics & Profile Analysis (2026)
Guest Profile Summary for Vysoké Tatry
- The typical guest profile for Airbnb in Vysoké Tatry consists of predominantly international visitors (82%), with top international origins including Poland, typically belonging to the Post-2000s (Gen Z/Alpha) group (50%), primarily speaking English or German.
- Domestic travelers account for 17.6% of guests.
- Key international markets include Slovakia (17.6%) and Poland (12.1%).
- Top languages spoken are English (39.5%) followed by German (12.2%).
- A significant demographic segment is the Post-2000s (Gen Z/Alpha) group, representing 50% of guests.
Recommendations for Hosts
- Focus marketing internationally, particularly towards travelers from Poland.
- Tailor amenities and listing descriptions to appeal to the dominant Post-2000s (Gen Z/Alpha) demographic (e.g., highlight fast WiFi, smart home features, local guides).
- Highlight unique local experiences or amenities relevant to the primary guest profile.
- Consider seasonal promotions aligned with peak travel times for key origin markets.
Nearby Short-Term Rental Market Comparison
How does the Vysoké Tatry Airbnb market stack up against its neighbors? Compare key performance metrics like average monthly revenue, ADR, and occupancy rates in surrounding areas to understand the broader regional STR landscape.
| Market | Active Properties | Monthly Revenue | Daily Rate | Avg. Occupancy |
|---|---|---|---|---|
| Pribylina | 12 | $2,041 | $233.47 | 37% |
| Skawica | 10 | $1,960 | $196.94 | 34% |
| Zawoja | 40 | $1,857 | $215.79 | 31% |
| Dzianisz | 14 | $1,810 | $259.90 | 32% |
| Czarna Góra | 18 | $1,644 | $423.32 | 22% |
| Kluszkowce | 26 | $1,594 | $200.63 | 31% |
| Tylmanowa | 11 | $1,568 | $183.05 | 42% |
| Sidzina | 15 | $1,531 | $182.66 | 37% |
| Cholerzyn | 17 | $1,520 | $139.04 | 41% |
| Maniowy | 19 | $1,416 | $228.38 | 24% |