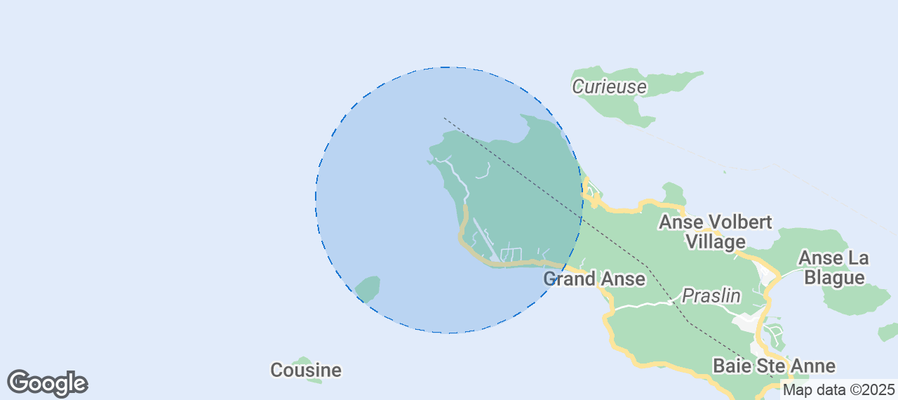
Anse Kerlan Airbnb Market Analysis 2026: Short Term Rental Data & Vacation Rental Statistics in Praslin, Seychelles
Is Airbnb profitable in Anse Kerlan in 2026? Explore comprehensive Airbnb analytics for Anse Kerlan, Praslin, Seychelles to uncover income potential. This 2026 STR market report for Anse Kerlan, based on AirROI data from February 2025 to January 2026, reveals key trends in the niche market of 24 active listings.
Whether you're considering an Airbnb investment in Anse Kerlan, optimizing your existing vacation rental, or exploring rental arbitrage opportunities, understanding the Anse Kerlan Airbnb data is crucial. Understanding the local regulations is key to maximizing your short term rental income potential. Let's dive into the specifics.
Key Anse Kerlan Airbnb Performance Metrics Overview
Monthly Airbnb Revenue Variations & Income Potential in Anse Kerlan (2026)
Understanding the monthly revenue variations for Airbnb listings in Anse Kerlan is key to maximizing your short term rental income potential. Seasonality significantly impacts earnings. Our analysis, based on data from the past 12 months, shows that the peak revenue month for STRs in Anse Kerlan is typically July, while January often presents the lowest earnings, highlighting opportunities for strategic pricing adjustments during shoulder and low seasons. Explore the typical Airbnb income in Anse Kerlan across different performance tiers:
- Best-in-class properties (Top 10%) achieve $6,318+ monthly, often utilizing dynamic pricing and superior guest experiences.
- Strong performing properties (Top 25%) earn $3,555 or more, indicating effective management and desirable locations/amenities.
- Typical properties (Median) generate around $1,841 per month, representing the average market performance.
- Entry-level properties (Bottom 25%) see earnings around $1,016, often with potential for optimization.
Average Monthly Airbnb Earnings Trend in Anse Kerlan
Anse Kerlan Airbnb Occupancy Rate Trends (2026)
Maximize your bookings by understanding the Anse Kerlan STR occupancy trends. Seasonal demand shifts significantly influence how often properties are booked. Typically, Octobersees the highest demand (peak season occupancy), while January experiences the lowest (low season). Effective strategies, like adjusting minimum stays or offering promotions, can boost occupancy during slower periods. Here's how different property tiers perform in Anse Kerlan:
- Best-in-class properties (Top 10%) achieve 72%+ occupancy, indicating high desirability and potentially optimized availability.
- Strong performing properties (Top 25%) maintain 53% or higher occupancy, suggesting good market fit and guest satisfaction.
- Typical properties (Median) have an occupancy rate around 31%.
- Entry-level properties (Bottom 25%) average 19% occupancy, potentially facing higher vacancy.
Average Monthly Occupancy Rate Trend in Anse Kerlan
Average Daily Rate (ADR) Airbnb Trends in Anse Kerlan (2026)
Effective short term rental pricing strategy in Anse Kerlan involves understanding monthly ADR fluctuations. The Average Daily Rate (ADR) for Airbnb in Anse Kerlan typically peaks in September and dips lowest during March. Leveraging Airbnb dynamic pricing tools or strategies based on this seasonality can significantly boost revenue. Here's a look at the typical nightly rates achieved:
- Best-in-class properties (Top 10%) command rates of $428+ per night, often due to premium features or locations.
- Strong performing properties (Top 25%) achieve nightly rates of $244 or more.
- Typical properties (Median) charge around $160 per night.
- Entry-level properties (Bottom 25%) earn around $102 per night.
Average Daily Rate (ADR) Trend by Month in Anse Kerlan
Get Live Anse Kerlan Market Intelligence 👇
Explore Real-time Analytics
Airbnb Seasonality Analysis & Trends in Anse Kerlan (2026)
Peak Season (July, August, September)
- Revenue averages $3,723 per month
- Occupancy rates average 43.3%
- Daily rates average $229
Shoulder Season
- Revenue averages $2,792 per month
- Occupancy maintains around 41.3%
- Daily rates hold near $221
Low Season (January, May, December)
- Revenue drops to average $1,370 per month
- Occupancy decreases to average 21.1%
- Daily rates adjust to average $224
Seasonality Insights for Anse Kerlan
- The Airbnb seasonality in Anse Kerlan shows highly seasonal trends requiring careful strategy. While the sections above show seasonal averages, it's also insightful to look at the extremes:
- During the high season, the absolute peak month showcases Anse Kerlan's highest earning potential, with monthly revenues capable of climbing to $4,015, occupancy reaching a high of 46.6%, and ADRs peaking at $244.
- Conversely, the slowest single month of the year, typically falling within the low season, marks the market's lowest point. In this month, revenue might dip to $936, occupancy could drop to 16.1%, and ADRs may adjust down to $213.
- Understanding both the seasonal averages and these monthly peaks and troughs in revenue, occupancy, and ADR is crucial for maximizing your Airbnb profit potential in Anse Kerlan.
Seasonal Strategies for Maximizing Profit
- Peak Season: Maximize revenue through premium pricing and potentially longer minimum stays. Ensure high availability.
- Low Season: Offer competitive pricing, special promotions (e.g., extended stay discounts), and flexible cancellation policies. Target off-season travelers like remote workers or budget-conscious guests.
- Shoulder Seasons: Implement dynamic pricing that balances peak and low rates. Target weekend travelers or specific events. Offer slightly more flexible terms than peak season.
- Regularly analyze your own performance against these Anse Kerlan seasonality benchmarks and adjust your pricing and availability strategy accordingly.
Best Areas for Airbnb Investment in Anse Kerlan (2026)
Exploring the top neighborhoods for short-term rentals in Anse Kerlan? This section highlights key areas, outlining why they are attractive for hosts and guests, along with notable local attractions. Consider these locations based on your target guest profile and investment strategy.
| Neighborhood / Area | Why Host Here? (Target Guests & Appeal) | Key Attractions & Landmarks |
|---|---|---|
| Anse Kerlan Beach | Stunning beach known for its crystal-clear waters and white sandy shores, making it perfect for tourists seeking relaxation and beauty. | Anse Kerlan Beach, Luxury resorts, snorkeling and diving spots, bird watching, Praslin Island |
| Vallee de Mai | A UNESCO World Heritage Site, home to unique plant species including the Coco de Mer palm. Ideal for eco-tourism and nature lovers. | Vallee de Mai Nature Reserve, Coco de Mer, rare bird species, hiking trails, guided nature tours |
| Grand Anse | Wide beach with a laid-back atmosphere, a favorite among locals, and great for families and visitors who want a less crowded beach. | Grand Anse Beach, local eateries, swimming and sunbathing, sandy shoreline, tranquil environment |
| Anse Lazio | Often rated as one of the best beaches in the world, it attracts those looking for picturesque scenery and ideal swimming conditions. | Anse Lazio Beach, snorkeling, photography opportunities, hiking trails nearby, secluded paradise |
| Curieuse Island | Known for its giant tortoises and natural beauty, offers unique experiences for tourists seeking adventure and nature. | Curieuse Island National Park, giant tortoises, snorkeling, tropical walking trails, beach picnics |
| Praslin Island | A hub for travelers exploring Seychelles, with a variety of accommodations and dining options, as well as direct access to other islands. | Praslin Island, local markets, ferry services, diving opportunities, beach clubs |
| Cote d'Or | Popular area with a range of accommodations, restaurants, and activities, making it a vibrant spot for tourists. | Cote d'Or Beach, water sports, beachfront dining, nightlife, family friendly activities |
| La Digue | A short ferry ride away, known for its stunning beaches and relaxed island vibe, appealing to those looking for a quieter stay. | Anse Source d'Argent, La Digue beaches, bicycling tours, granite boulders, La Digue culture |
Understanding Airbnb License Requirements & STR Laws in Anse Kerlan (2026)
With 17% of listings showing registration in 2026, understanding potential Airbnb license requirements is crucial in Anse Kerlan. Always verify the latest short term rental regulations and Airbnb license requirements directly with local government authorities for Anse Kerlan to ensure full compliance before hosting.
(Source: AirROI data, 2026, based on 17% licensed listings)
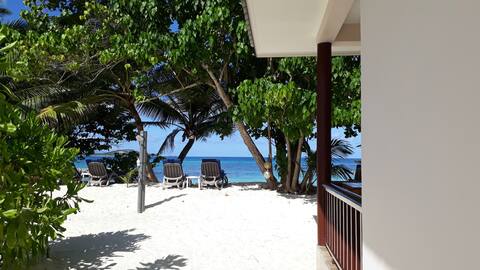
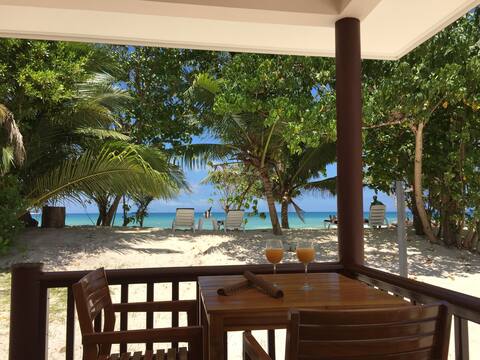
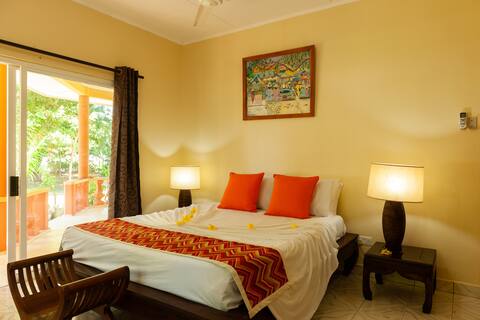
Top Performing Airbnb Properties in Anse Kerlan (2026)
Benchmark your potential! Explore examples of top-performing Airbnb properties in Anse Kerlanbased on Trailing Twelve Month (TTM) revenue. Analyze their characteristics, revenue, occupancy rate, and ADR to understand what drives success in this market.

Villas Du Voyageur Beachfront
Entire Place • 2 bedrooms

COMFORT VILLA
Entire Place • 6 bedrooms
Beach side hideaway in total tranquility free wifi
Entire Place • 1 bedroom
Secluded beachfront villa with FREE WiFi internet
Entire Place • 1 bedroom
villas des alizes
Entire Place • 2 bedrooms

Islander Hotel - Family Apartment (Half Board)
Entire Place • 2 bedrooms
Note: Performance varies based on location, size, amenities, seasonality, and management quality. Data reflects the past 12 months.
Top Performing Airbnb Hosts in Anse Kerlan (2026)
Learn from the best! This table showcases top-performing Airbnb hosts in Anse Kerlan based on the number of properties managed and estimated total revenue over the past year. Analyze their scale and performance metrics.
| Host Name | Properties | Grossing Revenue | Stay Reviews | Avg Rating |
|---|---|---|---|---|
| Bertrand | 2 | $104,169 | 162 | 4.96/5.0 |
| Lisa | 3 | $96,280 | 16 | 4.50/5.0 |
| Marcel | 1 | $90,886 | 69 | 4.97/5.0 |
| Miette | 2 | $47,908 | 5 | 4.25/5.0 |
| Basil | 2 | $46,605 | 14 | 5.00/5.0 |
| Casa Tara | 1 | $22,531 | 34 | 4.97/5.0 |
| Sylvie | 1 | $21,118 | 5 | 4.60/5.0 |
| Denise | 1 | $20,310 | 7 | 5.00/5.0 |
| Seashell Beach Villa | 1 | $18,022 | 15 | 5.00/5.0 |
| George | 1 | $15,573 | 183 | 4.82/5.0 |
Analyzing the strategies of top hosts, such as their property selection, pricing, and guest communication, can offer valuable lessons for optimizing your own Airbnb operations in Anse Kerlan.
Dive Deeper: Advanced Anse Kerlan STR Market Data (2026)
Ready to unlock more insights? AirROI provides access to advanced metrics and comprehensive Airbnb data for Anse Kerlan. Explore detailed analytics beyond this report to refine your investment strategy, optimize pricing, and maximize your vacation rental profits.
Explore Advanced MetricsAnse Kerlan Short-Term Rental Market Composition (2026): Property & Room Types
Room Type Distribution
Property Type Distribution
Market Composition Insights for Anse Kerlan
- The Anse Kerlan Airbnb market composition is heavily skewed towards Entire Home/Apt listings, which make up 83.3% of the 24 active rentals. This indicates strong guest preference for privacy and space.
- Looking at the property type distribution in Anse Kerlan, Apartment/Condo properties are the most common (41.7%), reflecting the local real estate landscape.
- Houses represent a significant 37.5% portion, catering likely to families or larger groups.
- The presence of 20.8% Hotel/Boutique listings indicates integration with traditional hospitality.
Anse Kerlan Airbnb Room Capacity Analysis (2026): Bedroom Distribution
Distribution of Listings by Number of Bedrooms
Room Capacity Insights for Anse Kerlan
- The dominant room capacity in Anse Kerlan is 1 bedroom listings, making up 41.7% of the market. This suggests a strong demand for properties suitable for couples or solo travelers.
- Together, 1 bedroom and 2 bedrooms properties represent 79.2% of the active Airbnb listings in Anse Kerlan, indicating a high concentration in these sizes.
- Listings with 3+ bedrooms (4.2%) represent a smaller niche, potentially indicating an underserved market for larger group accommodations in Anse Kerlan.
Anse Kerlan Vacation Rental Guest Capacity Trends (2026)
Distribution of Listings by Guest Capacity
Guest Capacity Insights for Anse Kerlan
- The most common guest capacity trend in Anse Kerlan vacation rentals is listings accommodating 4 guests (33.3%). This suggests the primary traveler segment is likely small families or groups.
- Properties designed for 4 guests and 3 guests dominate the Anse Kerlan STR market, accounting for 62.5% of listings.
- On average, properties in Anse Kerlan are equipped to host 3.0 guests.
Anse Kerlan Airbnb Booking Patterns (2026): Available vs. Booked Days
Available Days Distribution
Booked Days Distribution
Booking Pattern Insights for Anse Kerlan
- The most common availability pattern in Anse Kerlan falls within the 271-366 days range, representing 54.2% of listings. This suggests many properties have significant open periods on their calendars.
- Approximately 83.4% of listings show high availability (181+ days open annually), indicating potential for increased bookings or specific owner usage patterns.
- For booked days, the 31-90 days range is most frequent in Anse Kerlan (33.3%), reflecting common guest stay durations or potential owner blocking patterns.
- A notable 16.7% of properties secure long booking periods (181+ days booked per year), highlighting successful long-term rental strategies or significant owner usage.
Anse Kerlan Airbnb Minimum Stay Requirements Analysis
Distribution of Listings by Minimum Night Requirement
1 Night
6 listings
25% of total
2 Nights
10 listings
41.7% of total
3 Nights
7 listings
29.2% of total
30+ Nights
1 listings
4.2% of total
Key Insights
- The most prevalent minimum stay requirement in Anse Kerlan is 2 Nights, adopted by 41.7% of listings. This highlights the market's preference for shorter, flexible bookings.
- A strong majority (66.7%) of the Anse Kerlan Airbnb data shows acceptance of very short stays (1-2 nights), indicating a dynamic, high-turnover market.
Recommendations
- Align with the market by considering a 2 Nights minimum stay, as 41.7% of Anse Kerlan hosts use this setting.
- If feasible, allowing 1-night stays, especially midweek or during low season, could capture last-minute bookings, as only 25% currently do.
- Adjust minimum nights based on seasonality – potentially shorter during low season and longer during peak demand periods in Anse Kerlan.
Anse Kerlan Airbnb Cancellation Policy Trends Analysis (2026)
Flexible
12 listings
50% of total
Moderate
5 listings
20.8% of total
Firm
6 listings
25% of total
Strict
1 listings
4.2% of total
Cancellation Policy Insights for Anse Kerlan
- The prevailing Airbnb cancellation policy trend in Anse Kerlan is Flexible, used by 50% of listings.
- The market strongly favors guest-friendly terms, with 70.8% of listings offering Flexible or Moderate policies. This suggests guests in Anse Kerlan may expect booking flexibility.
- Strict cancellation policies are quite rare (4.2%), potentially making listings with this policy less competitive unless justified by high demand or property type.
Recommendations for Hosts
- Consider adopting a Flexible policy to align with the 50% market standard in Anse Kerlan.
- Using a Strict policy might deter some guests, as only 4.2% of listings use it. Evaluate if potential revenue protection outweighs possible lower booking rates.
- Regularly review your cancellation policy against competitors and market demand shifts in Anse Kerlan.
Anse Kerlan STR Booking Lead Time Analysis (2026)
Average Booking Lead Time by Month
Booking Lead Time Insights for Anse Kerlan
- The overall average booking lead time for vacation rentals in Anse Kerlan is 99 days.
- Guests book furthest in advance for stays during April (average 126 days), likely coinciding with peak travel demand or local events.
- The shortest booking windows occur for stays in June (average 49 days), indicating more last-minute travel plans during this time.
- Seasonally, Spring (109 days avg.) sees the longest lead times, while Summer (70 days avg.) has the shortest, reflecting typical travel planning cycles.
Recommendations for Hosts
- Use the overall average lead time (99 days) as a baseline for your pricing and availability strategy in Anse Kerlan.
- For April stays, consider implementing length-of-stay discounts or slightly higher rates for bookings made less than 126 days out to capitalize on advance planning.
- Target marketing efforts for the Spring season well in advance (at least 109 days) to capture early planners.
- Monitor your own booking lead times against these Anse Kerlan averages to identify opportunities for dynamic pricing adjustments.
Popular & Essential Airbnb Amenities in Anse Kerlan (2026)
Amenity Prevalence
Amenity Insights for Anse Kerlan
- Essential amenities in Anse Kerlan that guests expect include: Wifi, Air conditioning, Free parking on premises, TV. Lacking these (any) could significantly impact bookings.
- Popular amenities like Fire extinguisher, Hangers, Kitchen are common but not universal. Offering these can provide a competitive edge.
Recommendations for Hosts
- Ensure your listing includes all essential amenities for Anse Kerlan: Wifi, Air conditioning, Free parking on premises, TV.
- Prioritize adding missing essentials: TV.
- Consider adding popular differentiators like Fire extinguisher or Hangers to increase appeal.
- Highlight unique or less common amenities you offer (e.g., hot tub, dedicated workspace, EV charger) in your listing description and photos.
- Regularly check competitor amenities in Anse Kerlan to stay competitive.
Anse Kerlan Airbnb Guest Demographics & Profile Analysis (2026)
Guest Profile Summary for Anse Kerlan
- The typical guest profile for Airbnb in Anse Kerlan consists of predominantly international visitors (100%), with top international origins including France, typically belonging to the Post-2000s (Gen Z/Alpha) group (50%), primarily speaking English or German.
- Domestic travelers account for 0.0% of guests.
- Key international markets include Germany (28.1%) and France (22.8%).
- Top languages spoken are English (44.3%) followed by German (18.6%).
- A significant demographic segment is the Post-2000s (Gen Z/Alpha) group, representing 50% of guests.
Recommendations for Hosts
- Focus marketing internationally, particularly towards travelers from France.
- Tailor amenities and listing descriptions to appeal to the dominant Post-2000s (Gen Z/Alpha) demographic (e.g., highlight fast WiFi, smart home features, local guides).
- Highlight unique local experiences or amenities relevant to the primary guest profile.
- Consider seasonal promotions aligned with peak travel times for key origin markets.
Nearby Short-Term Rental Market Comparison
How does the Anse Kerlan Airbnb market stack up against its neighbors? Compare key performance metrics like average monthly revenue, ADR, and occupancy rates in surrounding areas to understand the broader regional STR landscape.
| Market | Active Properties | Monthly Revenue | Daily Rate | Avg. Occupancy |
|---|---|---|---|---|
| Eden Island | 10 | $7,099 | $522.03 | 47% |
| Pointe Au Sel | 14 | $4,087 | $252.21 | 56% |
| Victoria | 88 | $3,754 | $436.86 | 42% |
| Beau Vallon | 32 | $2,687 | $292.10 | 37% |
| Baie Saint Anne District | 40 | $2,617 | $234.13 | 42% |
| Grand'Anse Praslin District | 22 | $2,275 | $194.93 | 43% |
| Anse Boudin | 24 | $2,269 | $189.44 | 48% |
| Glacis | 35 | $2,161 | $350.07 | 38% |
| L' Union | 11 | $2,041 | $185.85 | 38% |
| La Passe | 25 | $1,876 | $140.01 | 51% |