Sinaia Airbnb Market Analysis 2026: Short Term Rental Data & Vacation Rental Statistics in Prahova, Romania
Is Airbnb profitable in Sinaia in 2026? Explore comprehensive Airbnb analytics for Sinaia, Prahova, Romania to uncover income potential. This 2026 STR market report for Sinaia, based on AirROI data from February 2025 to January 2026, reveals key trends in the market of 232 active listings.
Whether you're considering an Airbnb investment in Sinaia, optimizing your existing vacation rental, or exploring rental arbitrage opportunities, understanding the Sinaia Airbnb data is crucial. Leveraging the low regulation environment is key to maximizing your short term rental income potential. Let's dive into the specifics.
Key Sinaia Airbnb Performance Metrics Overview
Monthly Airbnb Revenue Variations & Income Potential in Sinaia (2026)
Understanding the monthly revenue variations for Airbnb listings in Sinaia is key to maximizing your short term rental income potential. Seasonality significantly impacts earnings. Our analysis, based on data from the past 12 months, shows that the peak revenue month for STRs in Sinaia is typically February, while June often presents the lowest earnings, highlighting opportunities for strategic pricing adjustments during shoulder and low seasons. Explore the typical Airbnb income in Sinaia across different performance tiers:
- Best-in-class properties (Top 10%) achieve $2,072+ monthly, often utilizing dynamic pricing and superior guest experiences.
- Strong performing properties (Top 25%) earn $1,206 or more, indicating effective management and desirable locations/amenities.
- Typical properties (Median) generate around $682 per month, representing the average market performance.
- Entry-level properties (Bottom 25%) see earnings around $350, often with potential for optimization.
Average Monthly Airbnb Earnings Trend in Sinaia
Sinaia Airbnb Occupancy Rate Trends (2026)
Maximize your bookings by understanding the Sinaia STR occupancy trends. Seasonal demand shifts significantly influence how often properties are booked. Typically, Februarysees the highest demand (peak season occupancy), while November experiences the lowest (low season). Effective strategies, like adjusting minimum stays or offering promotions, can boost occupancy during slower periods. Here's how different property tiers perform in Sinaia:
- Best-in-class properties (Top 10%) achieve 58%+ occupancy, indicating high desirability and potentially optimized availability.
- Strong performing properties (Top 25%) maintain 40% or higher occupancy, suggesting good market fit and guest satisfaction.
- Typical properties (Median) have an occupancy rate around 23%.
- Entry-level properties (Bottom 25%) average 12% occupancy, potentially facing higher vacancy.
Average Monthly Occupancy Rate Trend in Sinaia
Average Daily Rate (ADR) Airbnb Trends in Sinaia (2026)
Effective short term rental pricing strategy in Sinaia involves understanding monthly ADR fluctuations. The Average Daily Rate (ADR) for Airbnb in Sinaia typically peaks in December and dips lowest during March. Leveraging Airbnb dynamic pricing tools or strategies based on this seasonality can significantly boost revenue. Here's a look at the typical nightly rates achieved:
- Best-in-class properties (Top 10%) command rates of $216+ per night, often due to premium features or locations.
- Strong performing properties (Top 25%) achieve nightly rates of $127 or more.
- Typical properties (Median) charge around $92 per night.
- Entry-level properties (Bottom 25%) earn around $69 per night.
Average Daily Rate (ADR) Trend by Month in Sinaia
Get Live Sinaia Market Intelligence 👇

Explore Real-time Analytics
Airbnb Seasonality Analysis & Trends in Sinaia (2026)
Peak Season (February, August, July)
- Revenue averages $1,326 per month
- Occupancy rates average 38.4%
- Daily rates average $120
Shoulder Season
- Revenue averages $899 per month
- Occupancy maintains around 25.3%
- Daily rates hold near $124
Low Season (March, June, November)
- Revenue drops to average $794 per month
- Occupancy decreases to average 23.1%
- Daily rates adjust to average $118
Seasonality Insights for Sinaia
- The Airbnb seasonality in Sinaia shows moderate seasonality with distinct peak and low periods. While the sections above show seasonal averages, it's also insightful to look at the extremes:
- During the high season, the absolute peak month showcases Sinaia's highest earning potential, with monthly revenues capable of climbing to $1,347, occupancy reaching a high of 43.3%, and ADRs peaking at $138.
- Conversely, the slowest single month of the year, typically falling within the low season, marks the market's lowest point. In this month, revenue might dip to $780, occupancy could drop to 22.3%, and ADRs may adjust down to $111.
- Understanding both the seasonal averages and these monthly peaks and troughs in revenue, occupancy, and ADR is crucial for maximizing your Airbnb profit potential in Sinaia.
Seasonal Strategies for Maximizing Profit
- Peak Season: Maximize revenue through premium pricing and potentially longer minimum stays. Ensure high availability.
- Low Season: Offer competitive pricing, special promotions (e.g., extended stay discounts), and flexible cancellation policies. Target off-season travelers like remote workers or budget-conscious guests.
- Shoulder Seasons: Implement dynamic pricing that balances peak and low rates. Target weekend travelers or specific events. Offer slightly more flexible terms than peak season.
- Regularly analyze your own performance against these Sinaia seasonality benchmarks and adjust your pricing and availability strategy accordingly.
Best Areas for Airbnb Investment in Sinaia (2026)
Exploring the top neighborhoods for short-term rentals in Sinaia? This section highlights key areas, outlining why they are attractive for hosts and guests, along with notable local attractions. Consider these locations based on your target guest profile and investment strategy.
| Neighborhood / Area | Why Host Here? (Target Guests & Appeal) | Key Attractions & Landmarks |
|---|---|---|
| Centrul Sinaia | The vibrant heart of Sinaia, known for its rich history and proximity to major attractions. Ideal for tourists wanting to enjoy local dining, shopping, and cultural sites. | Peleș Castle, Sinaia Monastery, George Enescu Memorial Museum, Sinaia Casino, Shopping streets |
| Bușteni-Landmarks Area | Great for nature lovers, this area provides access to hiking trails and is near the Bucegi Natural Park. Attracts visitors looking for outdoor activities and stunning mountain views. | Bucegi National Park, Babele and Piatra Arsa, Cable Car to Bucegi Mountains, Hiking Trails |
| Cota 1400 | A key spot for winter sports and summer hiking, Cota 1400 offers breathtaking views and a peaceful atmosphere, making it popular with both adventure seekers and those looking for relaxation. | Ski slopes, Cable Car, Alpine Views, Hiking Routes |
| Valea Dorului | Known for its picturesque landscapes, Valea Dorului is a quieter area that draws visitors looking for a serene getaway while still being close to ski resorts and hiking paths. | Scenic Views, Nature Trails, Quiet Retreats |
| Sinaia Ski Resort Area | Direct access to skiing and snowboarding, this area is a prime location for winter sports enthusiasts, making it a hotspot during the winter season. | Sinaia Ski Slopes, Winter Sports, Ski Schools |
| DN1 Area | Located along the major road, this area is ideal for travelers passing through or visiting nearby attractions, offering easy access and various accommodation options. | Shopping, Restaurants, Proximity to Main Attractions |
| Prahova Valley | A broader area encompassing Sinaia, famous for its beautiful landscapes and cultural sites, attracts tourists year-round for both winter and summer activities. | Scenic Drives, Cultural Landmarks, Outdoor Activities |
| Local Parks and Outdoor Areas | Ideal for families and nature lovers, local parks provide a great retreat for those wanting to enjoy outdoor grilling, picnics, or relaxing walks in nature. | Parcul Dimitrie Ghika, Local Gardens, Walking Trails |
Understanding Airbnb License Requirements & STR Laws in Sinaia (2026)
While Sinaia, Prahova, Romania currently shows low STR regulations, specific Airbnb license requirements might still exist or change. Always verify the latest short term rental regulations and Airbnb license requirements directly with local government authorities for Sinaia to ensure full compliance before hosting.
(Source: AirROI data, 2026, based on 0% licensed listings)
Top Performing Airbnb Properties in Sinaia (2026)
Benchmark your potential! Explore examples of top-performing Airbnb properties in Sinaiabased on Trailing Twelve Month (TTM) revenue. Analyze their characteristics, revenue, occupancy rate, and ADR to understand what drives success in this market.
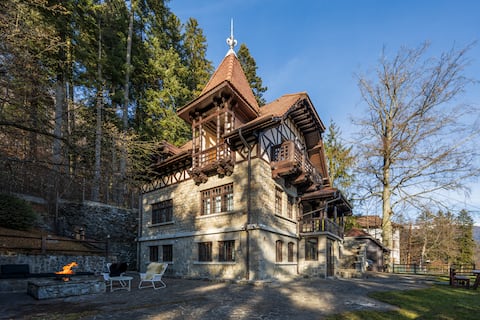
Vila Negoiu
Entire Place • 6 bedrooms

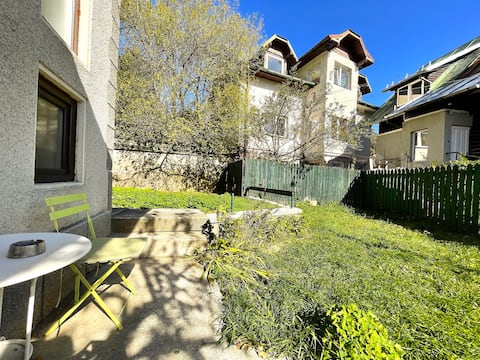
The Rock
Entire Place • 5 bedrooms
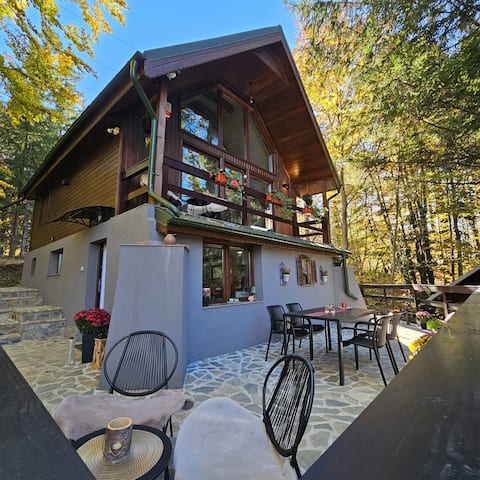
Guest house in Peles area - 5 min to cable car
Entire Place • 4 bedrooms

House with Friends in Sinaia
Entire Place • 7 bedrooms

Holiday Home in Sinaia
Entire Place • 5 bedrooms
Wild House
Entire Place • 3 bedrooms
Note: Performance varies based on location, size, amenities, seasonality, and management quality. Data reflects the past 12 months.
Top Performing Airbnb Hosts in Sinaia (2026)
Learn from the best! This table showcases top-performing Airbnb hosts in Sinaia based on the number of properties managed and estimated total revenue over the past year. Analyze their scale and performance metrics.
| Host Name | Properties | Grossing Revenue | Stay Reviews | Avg Rating |
|---|---|---|---|---|
| Magda | 12 | $202,697 | 574 | 4.86/5.0 |
| Cristina | 17 | $80,311 | 91 | 4.95/5.0 |
| George | 2 | $64,902 | 36 | 5.00/5.0 |
| Florin | 3 | $58,846 | 371 | 4.88/5.0 |
| Andrei | 2 | $51,285 | 185 | 4.99/5.0 |
| Arina | 1 | $48,460 | 28 | 4.75/5.0 |
| Ioana | 2 | $47,203 | 109 | 4.98/5.0 |
| Ioana | 6 | $44,949 | 46 | 4.64/5.0 |
| Georgeta Valentina | 4 | $44,688 | 232 | 4.96/5.0 |
| Sandra Mihaela | 1 | $38,492 | 2 | Not Rated |
Analyzing the strategies of top hosts, such as their property selection, pricing, and guest communication, can offer valuable lessons for optimizing your own Airbnb operations in Sinaia.
Dive Deeper: Advanced Sinaia STR Market Data (2026)
Ready to unlock more insights? AirROI provides access to advanced metrics and comprehensive Airbnb data for Sinaia. Explore detailed analytics beyond this report to refine your investment strategy, optimize pricing, and maximize your vacation rental profits.
Explore Advanced MetricsSinaia Short-Term Rental Market Composition (2026): Property & Room Types
Room Type Distribution
Property Type Distribution
Market Composition Insights for Sinaia
- The Sinaia Airbnb market composition is heavily skewed towards Entire Home/Apt listings, which make up 89.2% of the 232 active rentals. This indicates strong guest preference for privacy and space.
- Looking at the property type distribution in Sinaia, Apartment/Condo properties are the most common (77.2%), reflecting the local real estate landscape.
- Houses represent a significant 18.1% portion, catering likely to families or larger groups.
- Smaller segments like hotel/boutique, outdoor/unique, others (combined 4.7%) offer potential for unique stay experiences.
Sinaia Airbnb Room Capacity Analysis (2026): Bedroom Distribution
Distribution of Listings by Number of Bedrooms
Room Capacity Insights for Sinaia
- The dominant room capacity in Sinaia is 1 bedroom listings, making up 55.6% of the market. This suggests a strong demand for properties suitable for couples or solo travelers.
- Together, 1 bedroom and 2 bedrooms properties represent 76.7% of the active Airbnb listings in Sinaia, indicating a high concentration in these sizes.
- With over half the market (55.6%) consisting of studios or 1-bedroom units, Sinaia is particularly well-suited for individuals or couples.
Sinaia Vacation Rental Guest Capacity Trends (2026)
Distribution of Listings by Guest Capacity
Guest Capacity Insights for Sinaia
- The most common guest capacity trend in Sinaia vacation rentals is listings accommodating 4 guests (43.5%). This suggests the primary traveler segment is likely small families or groups.
- Properties designed for 4 guests and 6 guests dominate the Sinaia STR market, accounting for 56.0% of listings.
- 24.1% of properties accommodate 6+ guests, serving the market segment for larger families or group travel in Sinaia.
- On average, properties in Sinaia are equipped to host 4.2 guests.
Sinaia Airbnb Booking Patterns (2026): Available vs. Booked Days
Available Days Distribution
Booked Days Distribution
Booking Pattern Insights for Sinaia
- The most common availability pattern in Sinaia falls within the 271-366 days range, representing 73.3% of listings. This suggests many properties have significant open periods on their calendars.
- Approximately 95.3% of listings show high availability (181+ days open annually), indicating potential for increased bookings or specific owner usage patterns.
- For booked days, the 31-90 days range is most frequent in Sinaia (40.1%), reflecting common guest stay durations or potential owner blocking patterns.
- A notable 6.1% of properties secure long booking periods (181+ days booked per year), highlighting successful long-term rental strategies or significant owner usage.
Sinaia Airbnb Minimum Stay Requirements Analysis
Distribution of Listings by Minimum Night Requirement
1 Night
74 listings
31.9% of total
2 Nights
81 listings
34.9% of total
3 Nights
4 listings
1.7% of total
4-6 Nights
4 listings
1.7% of total
30+ Nights
69 listings
29.7% of total
Key Insights
- The most prevalent minimum stay requirement in Sinaia is 2 Nights, adopted by 34.9% of listings. This highlights the market's preference for shorter, flexible bookings.
- A strong majority (66.8%) of the Sinaia Airbnb data shows acceptance of very short stays (1-2 nights), indicating a dynamic, high-turnover market.
- A significant segment (29.7%) caters to monthly stays (30+ nights) in Sinaia, pointing to opportunities in the extended-stay market.
Recommendations
- Align with the market by considering a 2 Nights minimum stay, as 34.9% of Sinaia hosts use this setting.
- Explore offering discounts for stays of 30+ nights to attract the 29.7% of the market seeking extended stays.
- Adjust minimum nights based on seasonality – potentially shorter during low season and longer during peak demand periods in Sinaia.
Sinaia Airbnb Cancellation Policy Trends Analysis (2026)
Limited
2 listings
0.9% of total
Flexible
73 listings
31.5% of total
Moderate
104 listings
44.8% of total
Firm
42 listings
18.1% of total
Strict
11 listings
4.7% of total
Cancellation Policy Insights for Sinaia
- The prevailing Airbnb cancellation policy trend in Sinaia is Moderate, used by 44.8% of listings.
- The market strongly favors guest-friendly terms, with 76.3% of listings offering Flexible or Moderate policies. This suggests guests in Sinaia may expect booking flexibility.
- Strict cancellation policies are quite rare (4.7%), potentially making listings with this policy less competitive unless justified by high demand or property type.
Recommendations for Hosts
- Consider adopting a Moderate policy to align with the 44.8% market standard in Sinaia.
- Using a Strict policy might deter some guests, as only 4.7% of listings use it. Evaluate if potential revenue protection outweighs possible lower booking rates.
- Regularly review your cancellation policy against competitors and market demand shifts in Sinaia.
Sinaia STR Booking Lead Time Analysis (2026)
Average Booking Lead Time by Month
Booking Lead Time Insights for Sinaia
- The overall average booking lead time for vacation rentals in Sinaia is 32 days.
- Guests book furthest in advance for stays during December (average 54 days), likely coinciding with peak travel demand or local events.
- The shortest booking windows occur for stays in March (average 17 days), indicating more last-minute travel plans during this time.
- Seasonally, Winter (36 days avg.) sees the longest lead times, while Fall (26 days avg.) has the shortest, reflecting typical travel planning cycles.
Recommendations for Hosts
- Use the overall average lead time (32 days) as a baseline for your pricing and availability strategy in Sinaia.
- For December stays, consider implementing length-of-stay discounts or slightly higher rates for bookings made less than 54 days out to capitalize on advance planning.
- Target marketing efforts for the Winter season well in advance (at least 36 days) to capture early planners.
- Monitor your own booking lead times against these Sinaia averages to identify opportunities for dynamic pricing adjustments.
Popular & Essential Airbnb Amenities in Sinaia (2026)
Amenity Prevalence
Amenity Insights for Sinaia
- Essential amenities in Sinaia that guests expect include: Wifi, TV. Lacking these (any) could significantly impact bookings.
- Popular amenities like Heating, Kitchen, Hot water are common but not universal. Offering these can provide a competitive edge.
Recommendations for Hosts
- Ensure your listing includes all essential amenities for Sinaia: Wifi, TV.
- Prioritize adding missing essentials: Wifi, TV.
- Consider adding popular differentiators like Heating or Kitchen to increase appeal.
- Highlight unique or less common amenities you offer (e.g., hot tub, dedicated workspace, EV charger) in your listing description and photos.
- Regularly check competitor amenities in Sinaia to stay competitive.
Sinaia Airbnb Guest Demographics & Profile Analysis (2026)
Guest Profile Summary for Sinaia
- The typical guest profile for Airbnb in Sinaia consists of predominantly international visitors (66%), with top international origins including United Kingdom, typically belonging to the Post-2000s (Gen Z/Alpha) group (50%), primarily speaking English or Romanian.
- Domestic travelers account for 34.2% of guests.
- Key international markets include Romania (34.2%) and United Kingdom (10.7%).
- Top languages spoken are English (42.9%) followed by Romanian (13.1%).
- A significant demographic segment is the Post-2000s (Gen Z/Alpha) group, representing 50% of guests.
Recommendations for Hosts
- Focus marketing internationally, particularly towards travelers from United Kingdom.
- Tailor amenities and listing descriptions to appeal to the dominant Post-2000s (Gen Z/Alpha) demographic (e.g., highlight fast WiFi, smart home features, local guides).
- Highlight unique local experiences or amenities relevant to the primary guest profile.
- Consider seasonal promotions aligned with peak travel times for key origin markets.
Nearby Short-Term Rental Market Comparison
How does the Sinaia Airbnb market stack up against its neighbors? Compare key performance metrics like average monthly revenue, ADR, and occupancy rates in surrounding areas to understand the broader regional STR landscape.
| Market | Active Properties | Monthly Revenue | Daily Rate | Avg. Occupancy |
|---|---|---|---|---|
| Sadu | 12 | $2,064 | $170.28 | 44% |
| Avrig | 19 | $1,536 | $267.69 | 24% |
| Bughea de Sus | 10 | $1,534 | $125.70 | 38% |
| Bran | 129 | $1,418 | $248.37 | 26% |
| Săcele | 27 | $1,413 | $193.53 | 28% |
| Breaza | 26 | $1,386 | $251.41 | 23% |
| Moeciu de Jos | 96 | $1,268 | $208.88 | 26% |
| Dâmbovicioara | 10 | $1,251 | $218.93 | 25% |
| Balotești | 12 | $1,234 | $161.32 | 44% |
| Porumbacu de Jos | 33 | $1,096 | $201.06 | 23% |