Mabalacat Airbnb Market Analysis 2026: Short Term Rental Data & Vacation Rental Statistics in Pampanga, Philippines
Is Airbnb profitable in Mabalacat in 2026? Explore comprehensive Airbnb analytics for Mabalacat, Pampanga, Philippines to uncover income potential. This 2026 STR market report for Mabalacat, based on AirROI data from February 2025 to January 2026, reveals key trends in the niche market of 177 active listings.
Whether you're considering an Airbnb investment in Mabalacat, optimizing your existing vacation rental, or exploring rental arbitrage opportunities, understanding the Mabalacat Airbnb data is crucial. Leveraging the low regulation environment is key to maximizing your short term rental income potential. Let's dive into the specifics.
Key Mabalacat Airbnb Performance Metrics Overview
Monthly Airbnb Revenue Variations & Income Potential in Mabalacat (2026)
Understanding the monthly revenue variations for Airbnb listings in Mabalacat is key to maximizing your short term rental income potential. Seasonality significantly impacts earnings. Our analysis, based on data from the past 12 months, shows that the peak revenue month for STRs in Mabalacat is typically December, while January often presents the lowest earnings, highlighting opportunities for strategic pricing adjustments during shoulder and low seasons. Explore the typical Airbnb income in Mabalacat across different performance tiers:
- Best-in-class properties (Top 10%) achieve $1,643+ monthly, often utilizing dynamic pricing and superior guest experiences.
- Strong performing properties (Top 25%) earn $852 or more, indicating effective management and desirable locations/amenities.
- Typical properties (Median) generate around $448 per month, representing the average market performance.
- Entry-level properties (Bottom 25%) see earnings around $202, often with potential for optimization.
Average Monthly Airbnb Earnings Trend in Mabalacat
Mabalacat Airbnb Occupancy Rate Trends (2026)
Maximize your bookings by understanding the Mabalacat STR occupancy trends. Seasonal demand shifts significantly influence how often properties are booked. Typically, Decembersees the highest demand (peak season occupancy), while January experiences the lowest (low season). Effective strategies, like adjusting minimum stays or offering promotions, can boost occupancy during slower periods. Here's how different property tiers perform in Mabalacat:
- Best-in-class properties (Top 10%) achieve 68%+ occupancy, indicating high desirability and potentially optimized availability.
- Strong performing properties (Top 25%) maintain 50% or higher occupancy, suggesting good market fit and guest satisfaction.
- Typical properties (Median) have an occupancy rate around 28%.
- Entry-level properties (Bottom 25%) average 13% occupancy, potentially facing higher vacancy.
Average Monthly Occupancy Rate Trend in Mabalacat
Average Daily Rate (ADR) Airbnb Trends in Mabalacat (2026)
Effective short term rental pricing strategy in Mabalacat involves understanding monthly ADR fluctuations. The Average Daily Rate (ADR) for Airbnb in Mabalacat typically peaks in July and dips lowest during November. Leveraging Airbnb dynamic pricing tools or strategies based on this seasonality can significantly boost revenue. Here's a look at the typical nightly rates achieved:
- Best-in-class properties (Top 10%) command rates of $200+ per night, often due to premium features or locations.
- Strong performing properties (Top 25%) achieve nightly rates of $86 or more.
- Typical properties (Median) charge around $46 per night.
- Entry-level properties (Bottom 25%) earn around $34 per night.
Average Daily Rate (ADR) Trend by Month in Mabalacat
Get Live Mabalacat Market Intelligence 👇

Explore Real-time Analytics
Airbnb Seasonality Analysis & Trends in Mabalacat (2026)
Peak Season (December, April, November)
- Revenue averages $826 per month
- Occupancy rates average 37.5%
- Daily rates average $78
Shoulder Season
- Revenue averages $732 per month
- Occupancy maintains around 33.7%
- Daily rates hold near $85
Low Season (January, September, October)
- Revenue drops to average $579 per month
- Occupancy decreases to average 27.8%
- Daily rates adjust to average $77
Seasonality Insights for Mabalacat
- The Airbnb seasonality in Mabalacat shows moderate seasonality with distinct peak and low periods. While the sections above show seasonal averages, it's also insightful to look at the extremes:
- During the high season, the absolute peak month showcases Mabalacat's highest earning potential, with monthly revenues capable of climbing to $906, occupancy reaching a high of 41.4%, and ADRs peaking at $86.
- Conversely, the slowest single month of the year, typically falling within the low season, marks the market's lowest point. In this month, revenue might dip to $504, occupancy could drop to 24.5%, and ADRs may adjust down to $75.
- Understanding both the seasonal averages and these monthly peaks and troughs in revenue, occupancy, and ADR is crucial for maximizing your Airbnb profit potential in Mabalacat.
Seasonal Strategies for Maximizing Profit
- Peak Season: Maximize revenue through premium pricing and potentially longer minimum stays. Ensure high availability.
- Low Season: Offer competitive pricing, special promotions (e.g., extended stay discounts), and flexible cancellation policies. Target off-season travelers like remote workers or budget-conscious guests.
- Shoulder Seasons: Implement dynamic pricing that balances peak and low rates. Target weekend travelers or specific events. Offer slightly more flexible terms than peak season.
- Regularly analyze your own performance against these Mabalacat seasonality benchmarks and adjust your pricing and availability strategy accordingly.
Best Areas for Airbnb Investment in Mabalacat (2026)
Exploring the top neighborhoods for short-term rentals in Mabalacat? This section highlights key areas, outlining why they are attractive for hosts and guests, along with notable local attractions. Consider these locations based on your target guest profile and investment strategy.
| Neighborhood / Area | Why Host Here? (Target Guests & Appeal) | Key Attractions & Landmarks |
|---|---|---|
| Clark Freeport Zone | A vibrant economic zone with numerous attractions, making it ideal for both business and leisure travelers. Proximity to Clark International Airport is a significant advantage. | SM City Clark, Clark Museum, Aqua Planet, Fontana Water Park, Nayong Pilipino Clark |
| Mabalacat City Proper | Centrally located in Mabalacat, this area is convenient for guests looking to explore local foods and markets. It has a growing number of restaurants and shops. | St. Joseph the Worker Parish, Mabalacat City Hall, local night markets, Mabalacat Public Market |
| Marquee Mall | This area offers a mix of shopping, dining, and entertainment, attracting families and young adults. Ideal for guests seeking a complete shopping and leisure experience. | Marquee Mall, Timezone, Cinemas, Restaurants |
| Sacobia River | Known for its natural attractions and adventure activities, this area is great for guests interested in outdoor sports and adventures. | Water rafting, Zipline, Nature trails, Camping sites |
| Angeles City | Adjacent to Mabalacat, Angeles City is a popular destination known for its nightlife and entertainment options, attracting tourists looking for vibrant experiences. | Walking Street, Clark International Airport, Casino Filipino, balibago district, Cultural Center of the Philippines |
| NLEX Exit 85 | Easy access to major transport routes makes this area appealing for road travelers and business guests needing convenient connectivity. | Gas stations, Restaurants, Convenient stores |
| Friendship Highway | Offering a mix of local dining and businesses, this highway sees a lot of traffic and has potential for short-term rentals. | Local eateries, Shops, Landmark destinations |
| Mount Pinatubo | A unique attraction for adventure seekers, this area offers trekking and exploring the iconic volcano, drawing nature-loving tourists. | Trekking, 4x4 rides, Scenic views, Cultural experiences with local Aetas |
Understanding Airbnb License Requirements & STR Laws in Mabalacat (2026)
While Mabalacat, Pampanga, Philippines currently shows low STR regulations, specific Airbnb license requirements might still exist or change. Always verify the latest short term rental regulations and Airbnb license requirements directly with local government authorities for Mabalacat to ensure full compliance before hosting.
(Source: AirROI data, 2026, based on 1% licensed listings)
Top Performing Airbnb Properties in Mabalacat (2026)
Benchmark your potential! Explore examples of top-performing Airbnb properties in Mabalacatbased on Trailing Twelve Month (TTM) revenue. Analyze their characteristics, revenue, occupancy rate, and ADR to understand what drives success in this market.

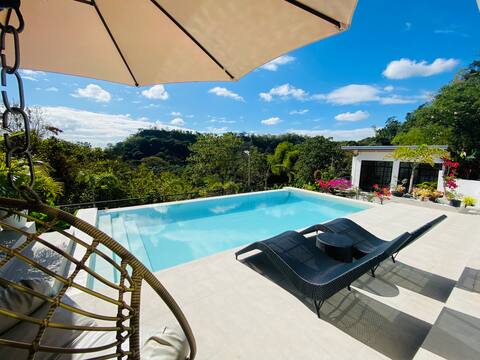
Aces Private Resort(10 mins from Clark)
Entire Place • 3 bedrooms
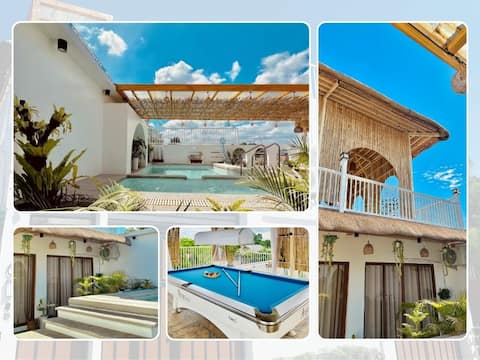
The Peak Villa w/ Infinity Pool! (20mins to Clark)
Entire Place • 4 bedrooms

Querencia Villa
Entire Place • 2 bedrooms
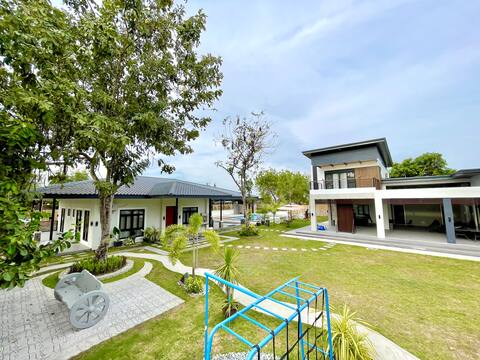
private and spacious farm resort
Entire Place • 2 bedrooms
Arko C - Staycation with pool near NLEX Dau Exit
Entire Place • 2 bedrooms

Imperial Private Resort in Pampanga
Entire Place • 1 bedroom
Note: Performance varies based on location, size, amenities, seasonality, and management quality. Data reflects the past 12 months.
Top Performing Airbnb Hosts in Mabalacat (2026)
Learn from the best! This table showcases top-performing Airbnb hosts in Mabalacat based on the number of properties managed and estimated total revenue over the past year. Analyze their scale and performance metrics.
| Host Name | Properties | Grossing Revenue | Stay Reviews | Avg Rating |
|---|---|---|---|---|
| Jessica | 13 | $82,966 | 678 | 4.83/5.0 |
| Grace | 3 | $49,104 | 310 | 4.96/5.0 |
| Adrian | 1 | $46,427 | 1 | Not Rated |
| Elaine Marie | 1 | $45,212 | 138 | 4.96/5.0 |
| Acell | 1 | $43,694 | 9 | 4.78/5.0 |
| Herwin | 3 | $39,526 | 403 | 4.93/5.0 |
| Mark Anthony | 1 | $35,062 | 30 | 4.97/5.0 |
| Luz | 3 | $33,661 | 444 | 4.93/5.0 |
| Jhing | 2 | $29,723 | 183 | 4.85/5.0 |
| Ann | 1 | $26,948 | 3 | 4.67/5.0 |
Analyzing the strategies of top hosts, such as their property selection, pricing, and guest communication, can offer valuable lessons for optimizing your own Airbnb operations in Mabalacat.
Dive Deeper: Advanced Mabalacat STR Market Data (2026)
Ready to unlock more insights? AirROI provides access to advanced metrics and comprehensive Airbnb data for Mabalacat. Explore detailed analytics beyond this report to refine your investment strategy, optimize pricing, and maximize your vacation rental profits.
Explore Advanced MetricsMabalacat Short-Term Rental Market Composition (2026): Property & Room Types
Room Type Distribution
Property Type Distribution
Market Composition Insights for Mabalacat
- The Mabalacat Airbnb market composition is heavily skewed towards Entire Home/Apt listings, which make up 85.9% of the 177 active rentals. This indicates strong guest preference for privacy and space.
- Looking at the property type distribution in Mabalacat, Apartment/Condo properties are the most common (45.2%), reflecting the local real estate landscape.
- Houses represent a significant 42.4% portion, catering likely to families or larger groups.
- The presence of 8.5% Hotel/Boutique listings indicates integration with traditional hospitality.
- Smaller segments like outdoor/unique, others (combined 3.9%) offer potential for unique stay experiences.
Mabalacat Airbnb Room Capacity Analysis (2026): Bedroom Distribution
Distribution of Listings by Number of Bedrooms
Room Capacity Insights for Mabalacat
- The dominant room capacity in Mabalacat is 1 bedroom listings, making up 34.5% of the market. This suggests a strong demand for properties suitable for couples or solo travelers.
- Together, 1 bedroom and 2 bedrooms properties represent 57.1% of the active Airbnb listings in Mabalacat, indicating a high concentration in these sizes.
Mabalacat Vacation Rental Guest Capacity Trends (2026)
Distribution of Listings by Guest Capacity
Guest Capacity Insights for Mabalacat
- The most common guest capacity trend in Mabalacat vacation rentals is listings accommodating 8+ guests (28.2%). This suggests the primary traveler segment is likely larger groups.
- Properties designed for 8+ guests and 4 guests dominate the Mabalacat STR market, accounting for 48.0% of listings.
- 40.0% of properties accommodate 6+ guests, serving the market segment for larger families or group travel in Mabalacat.
- On average, properties in Mabalacat are equipped to host 4.6 guests.
Mabalacat Airbnb Booking Patterns (2026): Available vs. Booked Days
Available Days Distribution
Booked Days Distribution
Booking Pattern Insights for Mabalacat
- The most common availability pattern in Mabalacat falls within the 271-366 days range, representing 61.6% of listings. This suggests many properties have significant open periods on their calendars.
- Approximately 89.8% of listings show high availability (181+ days open annually), indicating potential for increased bookings or specific owner usage patterns.
- For booked days, the 1-30 days range is most frequent in Mabalacat (32.2%), reflecting common guest stay durations or potential owner blocking patterns.
- A notable 10.8% of properties secure long booking periods (181+ days booked per year), highlighting successful long-term rental strategies or significant owner usage.
Mabalacat Airbnb Minimum Stay Requirements Analysis
Distribution of Listings by Minimum Night Requirement
1 Night
132 listings
74.6% of total
2 Nights
12 listings
6.8% of total
3 Nights
1 listings
0.6% of total
4-6 Nights
6 listings
3.4% of total
7-29 Nights
3 listings
1.7% of total
30+ Nights
23 listings
13% of total
Key Insights
- The most prevalent minimum stay requirement in Mabalacat is 1 Night, adopted by 74.6% of listings. This highlights the market's preference for shorter, flexible bookings.
- A strong majority (81.4%) of the Mabalacat Airbnb data shows acceptance of very short stays (1-2 nights), indicating a dynamic, high-turnover market.
- A significant segment (13%) caters to monthly stays (30+ nights) in Mabalacat, pointing to opportunities in the extended-stay market.
Recommendations
- Align with the market by considering a 1 Night minimum stay, as 74.6% of Mabalacat hosts use this setting.
- Explore offering discounts for stays of 30+ nights to attract the 13% of the market seeking extended stays.
- Adjust minimum nights based on seasonality – potentially shorter during low season and longer during peak demand periods in Mabalacat.
Mabalacat Airbnb Cancellation Policy Trends Analysis (2026)
Super Strict 60 Days
2 listings
1.1% of total
Limited
6 listings
3.4% of total
Flexible
41 listings
23.2% of total
Moderate
51 listings
28.8% of total
Firm
54 listings
30.5% of total
Strict
23 listings
13% of total
Cancellation Policy Insights for Mabalacat
- The prevailing Airbnb cancellation policy trend in Mabalacat is Firm, used by 30.5% of listings.
- There's a relatively balanced mix between guest-friendly (52.0%) and stricter (43.5%) policies, offering choices for different guest needs.
Recommendations for Hosts
- Consider adopting a Firm policy to align with the 30.5% market standard in Mabalacat.
- Using a Strict policy might deter some guests, as only 13% of listings use it. Evaluate if potential revenue protection outweighs possible lower booking rates.
- Regularly review your cancellation policy against competitors and market demand shifts in Mabalacat.
Mabalacat STR Booking Lead Time Analysis (2026)
Average Booking Lead Time by Month
Booking Lead Time Insights for Mabalacat
- The overall average booking lead time for vacation rentals in Mabalacat is 22 days.
- Guests book furthest in advance for stays during January (average 28 days), likely coinciding with peak travel demand or local events.
- The shortest booking windows occur for stays in June (average 14 days), indicating more last-minute travel plans during this time.
- Seasonally, Winter (25 days avg.) sees the longest lead times, while Summer (18 days avg.) has the shortest, reflecting typical travel planning cycles.
Recommendations for Hosts
- Use the overall average lead time (22 days) as a baseline for your pricing and availability strategy in Mabalacat.
- During June, focus on last-minute booking availability and promotions, as guests book with very short notice (14 days avg.).
- Target marketing efforts for the Winter season well in advance (at least 25 days) to capture early planners.
- Monitor your own booking lead times against these Mabalacat averages to identify opportunities for dynamic pricing adjustments.
Popular & Essential Airbnb Amenities in Mabalacat (2026)
Amenity Prevalence
Amenity Insights for Mabalacat
- Essential amenities in Mabalacat that guests expect include: Air conditioning, Wifi. Lacking these (any) could significantly impact bookings.
- Popular amenities like Free parking on premises, TV, Kitchen are common but not universal. Offering these can provide a competitive edge.
Recommendations for Hosts
- Ensure your listing includes all essential amenities for Mabalacat: Air conditioning, Wifi.
- Prioritize adding missing essentials: Air conditioning, Wifi.
- Consider adding popular differentiators like Free parking on premises or TV to increase appeal.
- Highlight unique or less common amenities you offer (e.g., hot tub, dedicated workspace, EV charger) in your listing description and photos.
- Regularly check competitor amenities in Mabalacat to stay competitive.
Mabalacat Airbnb Guest Demographics & Profile Analysis (2026)
Guest Profile Summary for Mabalacat
- The typical guest profile for Airbnb in Mabalacat consists of primarily domestic travelers (80%), often arriving from nearby Quezon City, typically belonging to the Post-2000s (Gen Z/Alpha) group (50%), primarily speaking English or Tagalog.
- Domestic travelers account for 79.6% of guests.
- Key international markets include Philippines (79.6%) and United States (11.6%).
- Top languages spoken are English (52.8%) followed by Tagalog (19.1%).
- A significant demographic segment is the Post-2000s (Gen Z/Alpha) group, representing 50% of guests.
Recommendations for Hosts
- Target domestic marketing efforts towards travelers from Quezon City and Manila.
- Tailor amenities and listing descriptions to appeal to the dominant Post-2000s (Gen Z/Alpha) demographic (e.g., highlight fast WiFi, smart home features, local guides).
- Highlight unique local experiences or amenities relevant to the primary guest profile.
- Consider seasonal promotions aligned with peak travel times for key origin markets.
Nearby Short-Term Rental Market Comparison
How does the Mabalacat Airbnb market stack up against its neighbors? Compare key performance metrics like average monthly revenue, ADR, and occupancy rates in surrounding areas to understand the broader regional STR landscape.
| Market | Active Properties | Monthly Revenue | Daily Rate | Avg. Occupancy |
|---|---|---|---|---|
| Bustos | 10 | $1,728 | $216.86 | 28% |
| Cabangan | 44 | $1,529 | $200.94 | 26% |
| Jalajala | 19 | $1,489 | $234.86 | 21% |
| Laoag | 17 | $1,412 | $158.39 | 33% |
| Beneg | 13 | $1,304 | $267.34 | 22% |
| Arew | 11 | $1,288 | $193.81 | 22% |
| Cabuyao | 25 | $1,202 | $114.93 | 36% |
| Binangonan | 49 | $1,191 | $135.12 | 29% |
| Porac | 51 | $1,157 | $203.91 | 21% |
| Los Baños | 158 | $1,129 | $242.23 | 21% |