Quezon City Airbnb Market Analysis 2026: Short Term Rental Data & Vacation Rental Statistics in Metro Manila, Philippines
Is Airbnb profitable in Quezon City in 2026? Explore comprehensive Airbnb analytics for Quezon City, Metro Manila, Philippines to uncover income potential. This 2026 STR market report for Quezon City, based on AirROI data from February 2025 to January 2026, reveals key trends in the bustling market of 3,928 active listings.
Whether you're considering an Airbnb investment in Quezon City, optimizing your existing vacation rental, or exploring rental arbitrage opportunities, understanding the Quezon City Airbnb data is crucial. Leveraging the low regulation environment is key to maximizing your short term rental income potential. Let's dive into the specifics.
Key Quezon City Airbnb Performance Metrics Overview
Monthly Airbnb Revenue Variations & Income Potential in Quezon City (2026)
Understanding the monthly revenue variations for Airbnb listings in Quezon City is key to maximizing your short term rental income potential. Seasonality significantly impacts earnings. Our analysis, based on data from the past 12 months, shows that the peak revenue month for STRs in Quezon City is typically December, while April often presents the lowest earnings, highlighting opportunities for strategic pricing adjustments during shoulder and low seasons. Explore the typical Airbnb income in Quezon City across different performance tiers:
- Best-in-class properties (Top 10%) achieve $888+ monthly, often utilizing dynamic pricing and superior guest experiences.
- Strong performing properties (Top 25%) earn $591 or more, indicating effective management and desirable locations/amenities.
- Typical properties (Median) generate around $322 per month, representing the average market performance.
- Entry-level properties (Bottom 25%) see earnings around $138, often with potential for optimization.
Average Monthly Airbnb Earnings Trend in Quezon City
Quezon City Airbnb Occupancy Rate Trends (2026)
Maximize your bookings by understanding the Quezon City STR occupancy trends. Seasonal demand shifts significantly influence how often properties are booked. Typically, Februarysees the highest demand (peak season occupancy), while January experiences the lowest (low season). Effective strategies, like adjusting minimum stays or offering promotions, can boost occupancy during slower periods. Here's how different property tiers perform in Quezon City:
- Best-in-class properties (Top 10%) achieve 76%+ occupancy, indicating high desirability and potentially optimized availability.
- Strong performing properties (Top 25%) maintain 55% or higher occupancy, suggesting good market fit and guest satisfaction.
- Typical properties (Median) have an occupancy rate around 31%.
- Entry-level properties (Bottom 25%) average 13% occupancy, potentially facing higher vacancy.
Average Monthly Occupancy Rate Trend in Quezon City
Average Daily Rate (ADR) Airbnb Trends in Quezon City (2026)
Effective short term rental pricing strategy in Quezon City involves understanding monthly ADR fluctuations. The Average Daily Rate (ADR) for Airbnb in Quezon City typically peaks in December and dips lowest during March. Leveraging Airbnb dynamic pricing tools or strategies based on this seasonality can significantly boost revenue. Here's a look at the typical nightly rates achieved:
- Best-in-class properties (Top 10%) command rates of $56+ per night, often due to premium features or locations.
- Strong performing properties (Top 25%) achieve nightly rates of $41 or more.
- Typical properties (Median) charge around $32 per night.
- Entry-level properties (Bottom 25%) earn around $26 per night.
Average Daily Rate (ADR) Trend by Month in Quezon City
Get Live Quezon City Market Intelligence 👇

Explore Real-time Analytics
Airbnb Seasonality Analysis & Trends in Quezon City (2026)
Peak Season (December, February, July)
- Revenue averages $487 per month
- Occupancy rates average 39.9%
- Daily rates average $38
Shoulder Season
- Revenue averages $433 per month
- Occupancy maintains around 35.6%
- Daily rates hold near $38
Low Season (January, April, September)
- Revenue drops to average $403 per month
- Occupancy decreases to average 33.3%
- Daily rates adjust to average $38
Seasonality Insights for Quezon City
- The Airbnb seasonality in Quezon City shows moderate seasonality with distinct peak and low periods. While the sections above show seasonal averages, it's also insightful to look at the extremes:
- During the high season, the absolute peak month showcases Quezon City's highest earning potential, with monthly revenues capable of climbing to $541, occupancy reaching a high of 43.5%, and ADRs peaking at $39.
- Conversely, the slowest single month of the year, typically falling within the low season, marks the market's lowest point. In this month, revenue might dip to $393, occupancy could drop to 31.1%, and ADRs may adjust down to $37.
- Understanding both the seasonal averages and these monthly peaks and troughs in revenue, occupancy, and ADR is crucial for maximizing your Airbnb profit potential in Quezon City.
Seasonal Strategies for Maximizing Profit
- Peak Season: Maximize revenue through premium pricing and potentially longer minimum stays. Ensure high availability.
- Low Season: Offer competitive pricing, special promotions (e.g., extended stay discounts), and flexible cancellation policies. Target off-season travelers like remote workers or budget-conscious guests.
- Shoulder Seasons: Implement dynamic pricing that balances peak and low rates. Target weekend travelers or specific events. Offer slightly more flexible terms than peak season.
- Regularly analyze your own performance against these Quezon City seasonality benchmarks and adjust your pricing and availability strategy accordingly.
Best Areas for Airbnb Investment in Quezon City (2026)
Exploring the top neighborhoods for short-term rentals in Quezon City? This section highlights key areas, outlining why they are attractive for hosts and guests, along with notable local attractions. Consider these locations based on your target guest profile and investment strategy.
| Neighborhood / Area | Why Host Here? (Target Guests & Appeal) | Key Attractions & Landmarks |
|---|---|---|
| Eastwood City | A vibrant mixed-use development known for its modern apartments, shopping malls, and nightlife. It's a hotspot for both business travelers and tourists looking for convenience and entertainment. | Eastwood Mall, Mercato Centrale, The Linden Suites, Eastwood City Walk, Cyber and Fashion malls |
| Cubao | A bustling commercial area known for its accessibility and variety of shopping options. It attracts visitors due to its transportation hubs and proximity to several entertainment venues. | Araneta Center, Ali Mall, Smart Araneta Coliseum, Cubao X, Gateway Mall |
| Katipunan | A lively area close to universities, popular with students and young professionals. Known for its cafes, restaurants, and a vibrant social scene, making it ideal for short-term rentals. | Ateneo de Manila University, University of the East, The Ateneo Art Gallery, Santuario de San Jose, Blue Ridge Park |
| Batasan Hills | A growing residential area with a mix of local markets and public transport accessibility. It’s an affordable option for families and those looking for a local experience. | Batasan People's Park, St. Peter's Shrine, Batasan Shopping Mall, Jollibee Batasan, Local markets |
| Miriam College | A peaceful neighborhood with a strong academic presence. It attracts visitors attending seminars, events or visiting students, and offers a serene environment. | Miriam College, Quezon Memorial Circle, University of the East - Quezon City, Lourdes Shrine, Shopwise |
| Quezon Memorial Circle | A historic and recreational area in the city, known for its large park and monument. It attracts families, tourists, and locals seeking leisure activities. | Quezon Memorial Park, Ninoy Aquino Parks and Wildlife Center, The Circle's restaurants, Cafes and picnic areas, The Quezon Heritage House |
| Timog Avenue | A lively nightlife and entertainment hub, popular for its bars, restaurants, and live music venues. Perfect for young travelers and groups looking for a fun stay. | Timog Avenue restaurants and bars, ABS-CBN Studio Tour, Tomas Morato area, Entertainment City, Local food haunts |
| San Juan | A suburban area with a mix of residential and commercial developments. Known for its accessible transport options and family-friendly environment, it's ideal for longer stays. | Greenhills Shopping Center, The Greenhills Theater, San Juan City Hall, Local eateries, Parks and recreation areas |
Understanding Airbnb License Requirements & STR Laws in Quezon City (2026)
While Quezon City, Metro Manila, Philippines currently shows low STR regulations, specific Airbnb license requirements might still exist or change. Always verify the latest short term rental regulations and Airbnb license requirements directly with local government authorities for Quezon City to ensure full compliance before hosting.
(Source: AirROI data, 2026, based on 0% licensed listings)
Top Performing Airbnb Properties in Quezon City (2026)
Benchmark your potential! Explore examples of top-performing Airbnb properties in Quezon Citybased on Trailing Twelve Month (TTM) revenue. Analyze their characteristics, revenue, occupancy rate, and ADR to understand what drives success in this market.

Chill Spot Manila
Entire Place • 4 bedrooms

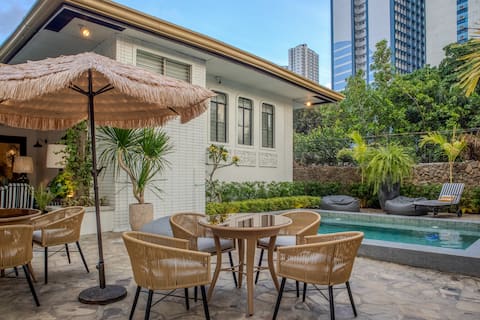
Spacious 3BR-Tropical Poolhouse|Prime QC Location!
Entire Place • 3 bedrooms
Casa Katipunan Villa
Entire Place • 5 bedrooms

Junior Suite @T5 Grass Res.+Wifi & Netflix
Entire Place • 1 bedroom
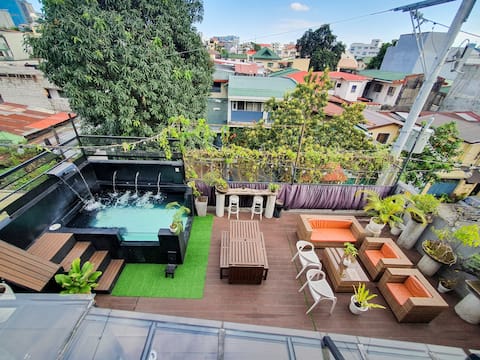
The Garden Deck w/ Heated Pool & KTV near SM North
Entire Place • 4 bedrooms

Elegant Suite @T5 Grass Res w/ Wifi & Netflix
Entire Place • 1 bedroom
Note: Performance varies based on location, size, amenities, seasonality, and management quality. Data reflects the past 12 months.
Top Performing Airbnb Hosts in Quezon City (2026)
Learn from the best! This table showcases top-performing Airbnb hosts in Quezon City based on the number of properties managed and estimated total revenue over the past year. Analyze their scale and performance metrics.
| Host Name | Properties | Grossing Revenue | Stay Reviews | Avg Rating |
|---|---|---|---|---|
| Jemima | 21 | $320,495 | 2999 | 4.92/5.0 |
| Bernadette | 27 | $242,070 | 2364 | 4.93/5.0 |
| LetStay | 12 | $160,514 | 3640 | 4.83/5.0 |
| Veronica | 13 | $143,914 | 431 | 4.96/5.0 |
| Welgo | 12 | $127,003 | 1372 | 4.81/5.0 |
| Andrew | 6 | $123,677 | 1040 | 4.91/5.0 |
| Joy | 19 | $119,495 | 764 | 4.78/5.0 |
| Homey Hosting Services | 19 | $96,181 | 2847 | 4.91/5.0 |
| Mark | 1 | $95,834 | 221 | 4.80/5.0 |
| Jeffrey | 14 | $87,593 | 806 | 4.83/5.0 |
Analyzing the strategies of top hosts, such as their property selection, pricing, and guest communication, can offer valuable lessons for optimizing your own Airbnb operations in Quezon City.
Dive Deeper: Advanced Quezon City STR Market Data (2026)
Ready to unlock more insights? AirROI provides access to advanced metrics and comprehensive Airbnb data for Quezon City. Explore detailed analytics beyond this report to refine your investment strategy, optimize pricing, and maximize your vacation rental profits.
Explore Advanced MetricsQuezon City Short-Term Rental Market Composition (2026): Property & Room Types
Room Type Distribution
Property Type Distribution
Market Composition Insights for Quezon City
- The Quezon City Airbnb market composition is heavily skewed towards Entire Home/Apt listings, which make up 88.1% of the 3,928 active rentals. This indicates strong guest preference for privacy and space.
- Looking at the property type distribution in Quezon City, Apartment/Condo properties are the most common (87.9%), reflecting the local real estate landscape.
- The presence of 5.5% Hotel/Boutique listings indicates integration with traditional hospitality.
- Smaller segments like house, unique stays, others (combined 6.6%) offer potential for unique stay experiences.
Quezon City Airbnb Room Capacity Analysis (2026): Bedroom Distribution
Distribution of Listings by Number of Bedrooms
Room Capacity Insights for Quezon City
- The dominant room capacity in Quezon City is 1 bedroom listings, making up 56.9% of the market. This suggests a strong demand for properties suitable for couples or solo travelers.
- Together, 1 bedroom and 2 bedrooms properties represent 74.4% of the active Airbnb listings in Quezon City, indicating a high concentration in these sizes.
- With over half the market (56.9%) consisting of studios or 1-bedroom units, Quezon City is particularly well-suited for individuals or couples.
- Listings with 3+ bedrooms (2.9%) represent a smaller niche, potentially indicating an underserved market for larger group accommodations in Quezon City.
Quezon City Vacation Rental Guest Capacity Trends (2026)
Distribution of Listings by Guest Capacity
Guest Capacity Insights for Quezon City
- The most common guest capacity trend in Quezon City vacation rentals is listings accommodating 4 guests (33.9%). This suggests the primary traveler segment is likely small families or groups.
- Properties designed for 4 guests and 2 guests dominate the Quezon City STR market, accounting for 56.0% of listings.
- 14.6% of properties accommodate 6+ guests, serving the market segment for larger families or group travel in Quezon City.
- On average, properties in Quezon City are equipped to host 3.6 guests.
Quezon City Airbnb Booking Patterns (2026): Available vs. Booked Days
Available Days Distribution
Booked Days Distribution
Booking Pattern Insights for Quezon City
- The most common availability pattern in Quezon City falls within the 271-366 days range, representing 61.9% of listings. This suggests many properties have significant open periods on their calendars.
- Approximately 86.6% of listings show high availability (181+ days open annually), indicating potential for increased bookings or specific owner usage patterns.
- For booked days, the 31-90 days range is most frequent in Quezon City (31.6%), reflecting common guest stay durations or potential owner blocking patterns.
- A notable 13.8% of properties secure long booking periods (181+ days booked per year), highlighting successful long-term rental strategies or significant owner usage.
Quezon City Airbnb Minimum Stay Requirements Analysis
Distribution of Listings by Minimum Night Requirement
1 Night
2450 listings
62.4% of total
2 Nights
495 listings
12.6% of total
3 Nights
162 listings
4.1% of total
4-6 Nights
124 listings
3.2% of total
7-29 Nights
137 listings
3.5% of total
30+ Nights
560 listings
14.3% of total
Key Insights
- The most prevalent minimum stay requirement in Quezon City is 1 Night, adopted by 62.4% of listings. This highlights the market's preference for shorter, flexible bookings.
- A strong majority (75.0%) of the Quezon City Airbnb data shows acceptance of very short stays (1-2 nights), indicating a dynamic, high-turnover market.
- A significant segment (14.3%) caters to monthly stays (30+ nights) in Quezon City, pointing to opportunities in the extended-stay market.
Recommendations
- Align with the market by considering a 1 Night minimum stay, as 62.4% of Quezon City hosts use this setting.
- Explore offering discounts for stays of 30+ nights to attract the 14.3% of the market seeking extended stays.
- Adjust minimum nights based on seasonality – potentially shorter during low season and longer during peak demand periods in Quezon City.
Quezon City Airbnb Cancellation Policy Trends Analysis (2026)
Limited
98 listings
2.5% of total
Super Strict 60 Days
2 listings
0.1% of total
Flexible
1200 listings
30.6% of total
Moderate
1063 listings
27.1% of total
Firm
1201 listings
30.6% of total
Strict
358 listings
9.1% of total
Cancellation Policy Insights for Quezon City
- The prevailing Airbnb cancellation policy trend in Quezon City is Flexible, used by 30.6% of listings.
- There's a relatively balanced mix between guest-friendly (57.7%) and stricter (39.7%) policies, offering choices for different guest needs.
- Strict cancellation policies are quite rare (9.1%), potentially making listings with this policy less competitive unless justified by high demand or property type.
Recommendations for Hosts
- Consider adopting a Flexible policy to align with the 30.6% market standard in Quezon City.
- Using a Strict policy might deter some guests, as only 9.1% of listings use it. Evaluate if potential revenue protection outweighs possible lower booking rates.
- Regularly review your cancellation policy against competitors and market demand shifts in Quezon City.
Quezon City STR Booking Lead Time Analysis (2026)
Average Booking Lead Time by Month
Booking Lead Time Insights for Quezon City
- The overall average booking lead time for vacation rentals in Quezon City is 17 days.
- Guests book furthest in advance for stays during December (average 22 days), likely coinciding with peak travel demand or local events.
- The shortest booking windows occur for stays in March (average 14 days), indicating more last-minute travel plans during this time.
- Seasonally, Winter (20 days avg.) sees the longest lead times, while Spring (15 days avg.) has the shortest, reflecting typical travel planning cycles.
Recommendations for Hosts
- Use the overall average lead time (17 days) as a baseline for your pricing and availability strategy in Quezon City.
- Target marketing efforts for the Winter season well in advance (at least 20 days) to capture early planners.
- Monitor your own booking lead times against these Quezon City averages to identify opportunities for dynamic pricing adjustments.
Popular & Essential Airbnb Amenities in Quezon City (2026)
Amenity Prevalence
Amenity Insights for Quezon City
- Essential amenities in Quezon City that guests expect include: Air conditioning, TV, Wifi. Lacking these (any) could significantly impact bookings.
- Popular amenities like Kitchen, Smoke alarm, Pool are common but not universal. Offering these can provide a competitive edge.
- A pool is a highly desired but not standard amenity, making it a key feature for attracting guests seeking leisure in Quezon City.
Recommendations for Hosts
- Ensure your listing includes all essential amenities for Quezon City: Air conditioning, TV, Wifi.
- Prioritize adding missing essentials: Air conditioning, TV, Wifi.
- Consider adding popular differentiators like Kitchen or Smoke alarm to increase appeal.
- Highlight unique or less common amenities you offer (e.g., hot tub, dedicated workspace, EV charger) in your listing description and photos.
- Regularly check competitor amenities in Quezon City to stay competitive.
Quezon City Airbnb Guest Demographics & Profile Analysis (2026)
Guest Profile Summary for Quezon City
- The typical guest profile for Airbnb in Quezon City consists of primarily domestic travelers (76%), often arriving from nearby Quezon City, typically belonging to the Post-2000s (Gen Z/Alpha) group (50%), primarily speaking English or Filipino.
- Domestic travelers account for 76.1% of guests.
- Key international markets include Philippines (76.1%) and United States (9.8%).
- Top languages spoken are English (51.8%) followed by Filipino (20.3%).
- A significant demographic segment is the Post-2000s (Gen Z/Alpha) group, representing 50% of guests.
Recommendations for Hosts
- Target domestic marketing efforts towards travelers from Quezon City and Manila.
- Tailor amenities and listing descriptions to appeal to the dominant Post-2000s (Gen Z/Alpha) demographic (e.g., highlight fast WiFi, smart home features, local guides).
- Highlight unique local experiences or amenities relevant to the primary guest profile.
- Consider seasonal promotions aligned with peak travel times for key origin markets.
Nearby Short-Term Rental Market Comparison
How does the Quezon City Airbnb market stack up against its neighbors? Compare key performance metrics like average monthly revenue, ADR, and occupancy rates in surrounding areas to understand the broader regional STR landscape.
| Market | Active Properties | Monthly Revenue | Daily Rate | Avg. Occupancy |
|---|---|---|---|---|
| Bustos | 10 | $1,728 | $216.86 | 28% |
| Cabangan | 44 | $1,529 | $200.94 | 26% |
| Lian | 121 | $1,491 | $216.20 | 24% |
| Jalajala | 19 | $1,489 | $234.86 | 21% |
| Laoag | 17 | $1,412 | $158.39 | 33% |
| Beneg | 13 | $1,304 | $267.34 | 22% |
| Arew | 11 | $1,288 | $193.81 | 22% |
| Cabuyao | 25 | $1,202 | $114.93 | 36% |
| Binangonan | 49 | $1,191 | $135.12 | 29% |
| Porac | 51 | $1,157 | $203.91 | 21% |