Las Piñas Airbnb Market Analysis 2026: Short Term Rental Data & Vacation Rental Statistics in Metro Manila, Philippines
Is Airbnb profitable in Las Piñas in 2026? Explore comprehensive Airbnb analytics for Las Piñas, Metro Manila, Philippines to uncover income potential. This 2026 STR market report for Las Piñas, based on AirROI data from February 2025 to January 2026, reveals key trends in the niche market of 151 active listings.
Whether you're considering an Airbnb investment in Las Piñas, optimizing your existing vacation rental, or exploring rental arbitrage opportunities, understanding the Las Piñas Airbnb data is crucial. Leveraging the low regulation environment is key to maximizing your short term rental income potential. Let's dive into the specifics.
Key Las Piñas Airbnb Performance Metrics Overview
Monthly Airbnb Revenue Variations & Income Potential in Las Piñas (2026)
Understanding the monthly revenue variations for Airbnb listings in Las Piñas is key to maximizing your short term rental income potential. Seasonality significantly impacts earnings. Our analysis, based on data from the past 12 months, shows that the peak revenue month for STRs in Las Piñas is typically March, while January often presents the lowest earnings, highlighting opportunities for strategic pricing adjustments during shoulder and low seasons. Explore the typical Airbnb income in Las Piñas across different performance tiers:
- Best-in-class properties (Top 10%) achieve $768+ monthly, often utilizing dynamic pricing and superior guest experiences.
- Strong performing properties (Top 25%) earn $492 or more, indicating effective management and desirable locations/amenities.
- Typical properties (Median) generate around $259 per month, representing the average market performance.
- Entry-level properties (Bottom 25%) see earnings around $108, often with potential for optimization.
Average Monthly Airbnb Earnings Trend in Las Piñas
Las Piñas Airbnb Occupancy Rate Trends (2026)
Maximize your bookings by understanding the Las Piñas STR occupancy trends. Seasonal demand shifts significantly influence how often properties are booked. Typically, Marchsees the highest demand (peak season occupancy), while August experiences the lowest (low season). Effective strategies, like adjusting minimum stays or offering promotions, can boost occupancy during slower periods. Here's how different property tiers perform in Las Piñas:
- Best-in-class properties (Top 10%) achieve 69%+ occupancy, indicating high desirability and potentially optimized availability.
- Strong performing properties (Top 25%) maintain 45% or higher occupancy, suggesting good market fit and guest satisfaction.
- Typical properties (Median) have an occupancy rate around 25%.
- Entry-level properties (Bottom 25%) average 12% occupancy, potentially facing higher vacancy.
Average Monthly Occupancy Rate Trend in Las Piñas
Average Daily Rate (ADR) Airbnb Trends in Las Piñas (2026)
Effective short term rental pricing strategy in Las Piñas involves understanding monthly ADR fluctuations. The Average Daily Rate (ADR) for Airbnb in Las Piñas typically peaks in October and dips lowest during March. Leveraging Airbnb dynamic pricing tools or strategies based on this seasonality can significantly boost revenue. Here's a look at the typical nightly rates achieved:
- Best-in-class properties (Top 10%) command rates of $58+ per night, often due to premium features or locations.
- Strong performing properties (Top 25%) achieve nightly rates of $42 or more.
- Typical properties (Median) charge around $32 per night.
- Entry-level properties (Bottom 25%) earn around $26 per night.
Average Daily Rate (ADR) Trend by Month in Las Piñas
Get Live Las Piñas Market Intelligence 👇

Explore Real-time Analytics
Airbnb Seasonality Analysis & Trends in Las Piñas (2026)
Peak Season (March, December, February)
- Revenue averages $433 per month
- Occupancy rates average 36.2%
- Daily rates average $39
Shoulder Season
- Revenue averages $362 per month
- Occupancy maintains around 30.4%
- Daily rates hold near $40
Low Season (January, August, September)
- Revenue drops to average $327 per month
- Occupancy decreases to average 28.3%
- Daily rates adjust to average $40
Seasonality Insights for Las Piñas
- The Airbnb seasonality in Las Piñas shows moderate seasonality with distinct peak and low periods. While the sections above show seasonal averages, it's also insightful to look at the extremes:
- During the high season, the absolute peak month showcases Las Piñas's highest earning potential, with monthly revenues capable of climbing to $454, occupancy reaching a high of 37.1%, and ADRs peaking at $41.
- Conversely, the slowest single month of the year, typically falling within the low season, marks the market's lowest point. In this month, revenue might dip to $314, occupancy could drop to 27.2%, and ADRs may adjust down to $38.
- Understanding both the seasonal averages and these monthly peaks and troughs in revenue, occupancy, and ADR is crucial for maximizing your Airbnb profit potential in Las Piñas.
Seasonal Strategies for Maximizing Profit
- Peak Season: Maximize revenue through premium pricing and potentially longer minimum stays. Ensure high availability.
- Low Season: Offer competitive pricing, special promotions (e.g., extended stay discounts), and flexible cancellation policies. Target off-season travelers like remote workers or budget-conscious guests.
- Shoulder Seasons: Implement dynamic pricing that balances peak and low rates. Target weekend travelers or specific events. Offer slightly more flexible terms than peak season.
- Regularly analyze your own performance against these Las Piñas seasonality benchmarks and adjust your pricing and availability strategy accordingly.
Best Areas for Airbnb Investment in Las Piñas (2026)
Exploring the top neighborhoods for short-term rentals in Las Piñas? This section highlights key areas, outlining why they are attractive for hosts and guests, along with notable local attractions. Consider these locations based on your target guest profile and investment strategy.
| Neighborhood / Area | Why Host Here? (Target Guests & Appeal) | Key Attractions & Landmarks |
|---|---|---|
| BF Homes | A popular residential area known for its vibrant community and accessibility to restaurants, bars, and shops. Ideal for families and business travelers looking for comfort and convenience. | BF Home's restaurants, The Good Guys, Carmona Sports Complex, Office of the Civil Registrar, Pine Hills Gardens |
| Las Piñas City Proper | The central business district of Las Piñas, offering easy access to public transport and essential services. A great option for those looking to explore the heart of the city. | Las Piñas Cathedral, Bamboo Organ of Las Piñas, SM City Las Piñas, Paseo de Sta. Rosa, Las Piñas City Museum |
| Almanza | A growing neighborhood with many schools, parks, and growing commercial establishments. Attracts families, students, and young professionals. | Almanza Town Center, South Luzon Medical Center, shopping places, parks, local markets |
| Eva Marie | A residential area that is becoming popular for short-term rentals, known for its tranquility while still being close to the city’s hustle and bustle. | Eva Marie Park, Shopping complexes, local eateries, community markets, nearby malls |
| Molino | Known as a haven for food enthusiasts, this area has a variety of food establishments and is close to tourist-friendly spots. | Molino Boulevard restaurants, Nature parks, Malls, Local markets, Nearby attractions |
| CAVITEX Access | Proximity to the expressway makes it a great stop for travelers wanting quick access to Manila and nearby provinces, popular with transient guests. | Accessible stops to Manila, Nearby tourist spots, Quick access to Cavite, Variety of accommodation options, Cozy local eateries |
| Pule | A community-oriented area with a local market feel, attracting travelers interested in experiencing the local culture and lifestyle. | Local street food, Cultural experiences, Community markets, Pule Park, local shops |
| BF Parañaque | Close to major shopping malls and entertainment complexes, making it a desirable area for leisure travelers and business trips. | SM City BF Parañaque, Metro Manila Film Festival, Baclaran Church, Food trucks and dining spots, Entertainment city |
Understanding Airbnb License Requirements & STR Laws in Las Piñas (2026)
While Las Piñas, Metro Manila, Philippines currently shows low STR regulations, specific Airbnb license requirements might still exist or change. Always verify the latest short term rental regulations and Airbnb license requirements directly with local government authorities for Las Piñas to ensure full compliance before hosting.
(Source: AirROI data, 2026, finding no licensed listings among those analyzed)
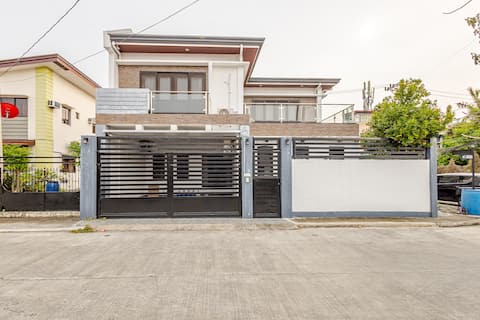
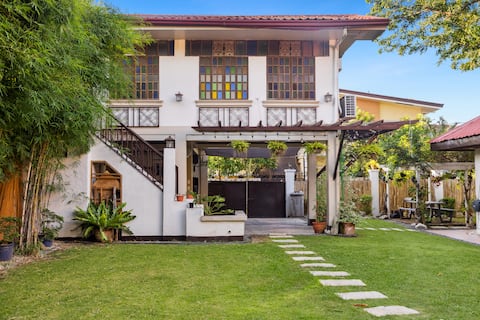
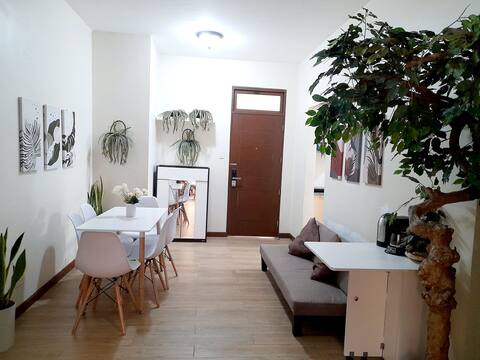
Top Performing Airbnb Properties in Las Piñas (2026)
Benchmark your potential! Explore examples of top-performing Airbnb properties in Las Piñasbased on Trailing Twelve Month (TTM) revenue. Analyze their characteristics, revenue, occupancy rate, and ADR to understand what drives success in this market.

Tropical House Spacious w/ King Bed & Free Parking
Entire Place • 4 bedrooms
3 bedroom House - Staycation with Private Pool
Entire Place • 3 bedrooms
Your Events Place in Las Pinas City
Entire Place • N/A

Cozy 2-bedroom Condo in Las Pinas
Entire Place • 2 bedrooms
3-bedroom beside pool and clubhouse
Entire Place • 3 bedrooms
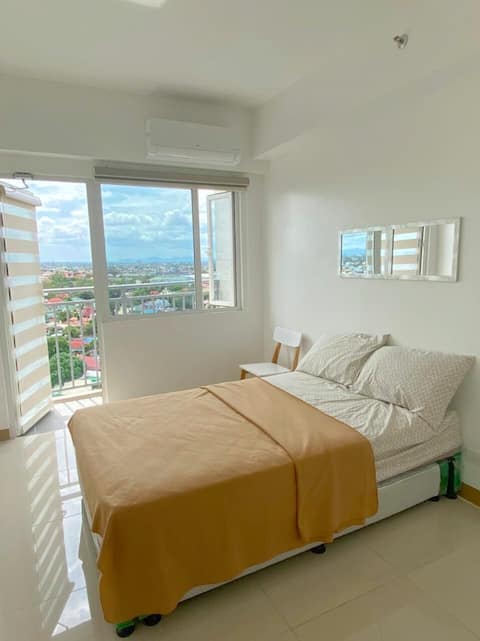
Homey 2BR Condo inside SM Southmall
Entire Place • 2 bedrooms
Note: Performance varies based on location, size, amenities, seasonality, and management quality. Data reflects the past 12 months.
Top Performing Airbnb Hosts in Las Piñas (2026)
Learn from the best! This table showcases top-performing Airbnb hosts in Las Piñas based on the number of properties managed and estimated total revenue over the past year. Analyze their scale and performance metrics.
| Host Name | Properties | Grossing Revenue | Stay Reviews | Avg Rating |
|---|---|---|---|---|
| Marisa | 1 | $27,297 | 17 | 4.88/5.0 |
| Estefranny | 1 | $24,614 | 77 | 4.99/5.0 |
| Ane | 2 | $14,602 | 54 | 4.98/5.0 |
| Edwin | 2 | $13,446 | 111 | 4.89/5.0 |
| Culai | 3 | $11,083 | 96 | 4.97/5.0 |
| Denise | 1 | $9,862 | 60 | 5.00/5.0 |
| Kimberly | 12 | $9,789 | 169 | 4.91/5.0 |
| Queenclaire | 2 | $9,242 | 42 | 4.88/5.0 |
| Mary Joy | 1 | $7,907 | 129 | 4.65/5.0 |
| Michelle | 1 | $7,251 | 16 | 5.00/5.0 |
Analyzing the strategies of top hosts, such as their property selection, pricing, and guest communication, can offer valuable lessons for optimizing your own Airbnb operations in Las Piñas.
Dive Deeper: Advanced Las Piñas STR Market Data (2026)
Ready to unlock more insights? AirROI provides access to advanced metrics and comprehensive Airbnb data for Las Piñas. Explore detailed analytics beyond this report to refine your investment strategy, optimize pricing, and maximize your vacation rental profits.
Explore Advanced MetricsLas Piñas Short-Term Rental Market Composition (2026): Property & Room Types
Room Type Distribution
Property Type Distribution
Market Composition Insights for Las Piñas
- The Las Piñas Airbnb market composition is heavily skewed towards Entire Home/Apt listings, which make up 86.1% of the 151 active rentals. This indicates strong guest preference for privacy and space.
- Looking at the property type distribution in Las Piñas, Apartment/Condo properties are the most common (80.1%), reflecting the local real estate landscape.
- Smaller segments like hotel/boutique, others, unique stays (combined 6.6%) offer potential for unique stay experiences.
Las Piñas Airbnb Room Capacity Analysis (2026): Bedroom Distribution
Distribution of Listings by Number of Bedrooms
Room Capacity Insights for Las Piñas
- The dominant room capacity in Las Piñas is 1 bedroom listings, making up 49.7% of the market. This suggests a strong demand for properties suitable for couples or solo travelers.
- Together, 1 bedroom and 2 bedrooms properties represent 72.2% of the active Airbnb listings in Las Piñas, indicating a high concentration in these sizes.
- Listings with 3+ bedrooms (8.0%) represent a smaller niche, potentially indicating an underserved market for larger group accommodations in Las Piñas.
Las Piñas Vacation Rental Guest Capacity Trends (2026)
Distribution of Listings by Guest Capacity
Guest Capacity Insights for Las Piñas
- The most common guest capacity trend in Las Piñas vacation rentals is listings accommodating 4 guests (35.8%). This suggests the primary traveler segment is likely small families or groups.
- Properties designed for 4 guests and 2 guests dominate the Las Piñas STR market, accounting for 59.0% of listings.
- 13.3% of properties accommodate 6+ guests, serving the market segment for larger families or group travel in Las Piñas.
- On average, properties in Las Piñas are equipped to host 3.4 guests.
Las Piñas Airbnb Booking Patterns (2026): Available vs. Booked Days
Available Days Distribution
Booked Days Distribution
Booking Pattern Insights for Las Piñas
- The most common availability pattern in Las Piñas falls within the 271-366 days range, representing 74.2% of listings. This suggests many properties have significant open periods on their calendars.
- Approximately 94.7% of listings show high availability (181+ days open annually), indicating potential for increased bookings or specific owner usage patterns.
- For booked days, the 1-30 days range is most frequent in Las Piñas (40.4%), reflecting common guest stay durations or potential owner blocking patterns.
- A notable 6.0% of properties secure long booking periods (181+ days booked per year), highlighting successful long-term rental strategies or significant owner usage.
Las Piñas Airbnb Minimum Stay Requirements Analysis
Distribution of Listings by Minimum Night Requirement
1 Night
109 listings
72.2% of total
2 Nights
10 listings
6.6% of total
3 Nights
2 listings
1.3% of total
4-6 Nights
2 listings
1.3% of total
7-29 Nights
2 listings
1.3% of total
30+ Nights
26 listings
17.2% of total
Key Insights
- The most prevalent minimum stay requirement in Las Piñas is 1 Night, adopted by 72.2% of listings. This highlights the market's preference for shorter, flexible bookings.
- A strong majority (78.8%) of the Las Piñas Airbnb data shows acceptance of very short stays (1-2 nights), indicating a dynamic, high-turnover market.
- A significant segment (17.2%) caters to monthly stays (30+ nights) in Las Piñas, pointing to opportunities in the extended-stay market.
Recommendations
- Align with the market by considering a 1 Night minimum stay, as 72.2% of Las Piñas hosts use this setting.
- Explore offering discounts for stays of 30+ nights to attract the 17.2% of the market seeking extended stays.
- Adjust minimum nights based on seasonality – potentially shorter during low season and longer during peak demand periods in Las Piñas.
Las Piñas Airbnb Cancellation Policy Trends Analysis (2026)
Limited
7 listings
4.6% of total
Flexible
56 listings
37.1% of total
Moderate
44 listings
29.1% of total
Firm
37 listings
24.5% of total
Strict
7 listings
4.6% of total
Cancellation Policy Insights for Las Piñas
- The prevailing Airbnb cancellation policy trend in Las Piñas is Flexible, used by 37.1% of listings.
- There's a relatively balanced mix between guest-friendly (66.2%) and stricter (29.1%) policies, offering choices for different guest needs.
- Strict cancellation policies are quite rare (4.6%), potentially making listings with this policy less competitive unless justified by high demand or property type.
Recommendations for Hosts
- Consider adopting a Flexible policy to align with the 37.1% market standard in Las Piñas.
- Using a Strict policy might deter some guests, as only 4.6% of listings use it. Evaluate if potential revenue protection outweighs possible lower booking rates.
- Regularly review your cancellation policy against competitors and market demand shifts in Las Piñas.
Las Piñas STR Booking Lead Time Analysis (2026)
Average Booking Lead Time by Month
Booking Lead Time Insights for Las Piñas
- The overall average booking lead time for vacation rentals in Las Piñas is 15 days.
- Guests book furthest in advance for stays during November (average 25 days), likely coinciding with peak travel demand or local events.
- The shortest booking windows occur for stays in March (average 11 days), indicating more last-minute travel plans during this time.
- Seasonally, Fall (21 days avg.) sees the longest lead times, while Spring (14 days avg.) has the shortest, reflecting typical travel planning cycles.
Recommendations for Hosts
- Use the overall average lead time (15 days) as a baseline for your pricing and availability strategy in Las Piñas.
- Target marketing efforts for the Fall season well in advance (at least 21 days) to capture early planners.
- Monitor your own booking lead times against these Las Piñas averages to identify opportunities for dynamic pricing adjustments.
Popular & Essential Airbnb Amenities in Las Piñas (2026)
Amenity Prevalence
Amenity Insights for Las Piñas
- Essential amenities in Las Piñas that guests expect include: Air conditioning, TV. Lacking these (any) could significantly impact bookings.
- Popular amenities like Wifi, Kitchen, Dishes and silverware are common but not universal. Offering these can provide a competitive edge.
- Warning: Wifi is not universally provided but is considered essential globally. Ensure reliable Wifi is offered.
Recommendations for Hosts
- Ensure your listing includes all essential amenities for Las Piñas: Air conditioning, TV.
- Prioritize adding missing essentials: Air conditioning, TV.
- Consider adding popular differentiators like Wifi or Kitchen to increase appeal.
- Highlight unique or less common amenities you offer (e.g., hot tub, dedicated workspace, EV charger) in your listing description and photos.
- Regularly check competitor amenities in Las Piñas to stay competitive.
Las Piñas Airbnb Guest Demographics & Profile Analysis (2026)
Guest Profile Summary for Las Piñas
- The typical guest profile for Airbnb in Las Piñas consists of primarily domestic travelers (74%), often arriving from nearby Las Pinas, typically belonging to the Post-2000s (Gen Z/Alpha) group (50%), primarily speaking English or Filipino.
- Domestic travelers account for 74.1% of guests.
- Key international markets include Philippines (74.1%) and United States (11%).
- Top languages spoken are English (48.5%) followed by Filipino (21.6%).
- A significant demographic segment is the Post-2000s (Gen Z/Alpha) group, representing 50% of guests.
Recommendations for Hosts
- Target domestic marketing efforts towards travelers from Las Pinas and Manila.
- Tailor amenities and listing descriptions to appeal to the dominant Post-2000s (Gen Z/Alpha) demographic (e.g., highlight fast WiFi, smart home features, local guides).
- Highlight unique local experiences or amenities relevant to the primary guest profile.
- Consider seasonal promotions aligned with peak travel times for key origin markets.
Nearby Short-Term Rental Market Comparison
How does the Las Piñas Airbnb market stack up against its neighbors? Compare key performance metrics like average monthly revenue, ADR, and occupancy rates in surrounding areas to understand the broader regional STR landscape.
| Market | Active Properties | Monthly Revenue | Daily Rate | Avg. Occupancy |
|---|---|---|---|---|
| Bustos | 10 | $1,728 | $216.86 | 28% |
| Cabangan | 44 | $1,529 | $200.94 | 26% |
| Lian | 121 | $1,491 | $216.20 | 24% |
| Jalajala | 19 | $1,489 | $234.86 | 21% |
| Laoag | 17 | $1,412 | $158.39 | 33% |
| Beneg | 13 | $1,304 | $267.34 | 22% |
| Arew | 11 | $1,288 | $193.81 | 22% |
| Cabuyao | 25 | $1,202 | $114.93 | 36% |
| Binangonan | 49 | $1,191 | $135.12 | 29% |
| Porac | 51 | $1,157 | $203.91 | 21% |