Angeles Airbnb Market Analysis 2026: Short Term Rental Data & Vacation Rental Statistics in Central Luzon, Philippines
Is Airbnb profitable in Angeles in 2026? Explore comprehensive Airbnb analytics for Angeles, Central Luzon, Philippines to uncover income potential. This 2026 STR market report for Angeles, based on AirROI data from February 2025 to January 2026, reveals key trends in the market of 949 active listings.
Whether you're considering an Airbnb investment in Angeles, optimizing your existing vacation rental, or exploring rental arbitrage opportunities, understanding the Angeles Airbnb data is crucial. Leveraging the low regulation environment is key to maximizing your short term rental income potential. Let's dive into the specifics.
Key Angeles Airbnb Performance Metrics Overview
Monthly Airbnb Revenue Variations & Income Potential in Angeles (2026)
Understanding the monthly revenue variations for Airbnb listings in Angeles is key to maximizing your short term rental income potential. Seasonality significantly impacts earnings. Our analysis, based on data from the past 12 months, shows that the peak revenue month for STRs in Angeles is typically December, while January often presents the lowest earnings, highlighting opportunities for strategic pricing adjustments during shoulder and low seasons. Explore the typical Airbnb income in Angeles across different performance tiers:
- Best-in-class properties (Top 10%) achieve $1,585+ monthly, often utilizing dynamic pricing and superior guest experiences.
- Strong performing properties (Top 25%) earn $1,041 or more, indicating effective management and desirable locations/amenities.
- Typical properties (Median) generate around $555 per month, representing the average market performance.
- Entry-level properties (Bottom 25%) see earnings around $232, often with potential for optimization.
Average Monthly Airbnb Earnings Trend in Angeles
Angeles Airbnb Occupancy Rate Trends (2026)
Maximize your bookings by understanding the Angeles STR occupancy trends. Seasonal demand shifts significantly influence how often properties are booked. Typically, Februarysees the highest demand (peak season occupancy), while May experiences the lowest (low season). Effective strategies, like adjusting minimum stays or offering promotions, can boost occupancy during slower periods. Here's how different property tiers perform in Angeles:
- Best-in-class properties (Top 10%) achieve 80%+ occupancy, indicating high desirability and potentially optimized availability.
- Strong performing properties (Top 25%) maintain 60% or higher occupancy, suggesting good market fit and guest satisfaction.
- Typical properties (Median) have an occupancy rate around 33%.
- Entry-level properties (Bottom 25%) average 15% occupancy, potentially facing higher vacancy.
Average Monthly Occupancy Rate Trend in Angeles
Average Daily Rate (ADR) Airbnb Trends in Angeles (2026)
Effective short term rental pricing strategy in Angeles involves understanding monthly ADR fluctuations. The Average Daily Rate (ADR) for Airbnb in Angeles typically peaks in October and dips lowest during March. Leveraging Airbnb dynamic pricing tools or strategies based on this seasonality can significantly boost revenue. Here's a look at the typical nightly rates achieved:
- Best-in-class properties (Top 10%) command rates of $158+ per night, often due to premium features or locations.
- Strong performing properties (Top 25%) achieve nightly rates of $77 or more.
- Typical properties (Median) charge around $46 per night.
- Entry-level properties (Bottom 25%) earn around $34 per night.
Average Daily Rate (ADR) Trend by Month in Angeles
Get Live Angeles Market Intelligence 👇

Explore Real-time Analytics
Airbnb Seasonality Analysis & Trends in Angeles (2026)
Peak Season (December, March, July)
- Revenue averages $836 per month
- Occupancy rates average 40.5%
- Daily rates average $72
Shoulder Season
- Revenue averages $765 per month
- Occupancy maintains around 40.0%
- Daily rates hold near $72
Low Season (January, May, September)
- Revenue drops to average $673 per month
- Occupancy decreases to average 34.3%
- Daily rates adjust to average $72
Seasonality Insights for Angeles
- The Airbnb seasonality in Angeles shows moderate seasonality with distinct peak and low periods. While the sections above show seasonal averages, it's also insightful to look at the extremes:
- During the high season, the absolute peak month showcases Angeles's highest earning potential, with monthly revenues capable of climbing to $893, occupancy reaching a high of 44.5%, and ADRs peaking at $73.
- Conversely, the slowest single month of the year, typically falling within the low season, marks the market's lowest point. In this month, revenue might dip to $653, occupancy could drop to 33.4%, and ADRs may adjust down to $70.
- Understanding both the seasonal averages and these monthly peaks and troughs in revenue, occupancy, and ADR is crucial for maximizing your Airbnb profit potential in Angeles.
Seasonal Strategies for Maximizing Profit
- Peak Season: Maximize revenue through premium pricing and potentially longer minimum stays. Ensure high availability.
- Low Season: Offer competitive pricing, special promotions (e.g., extended stay discounts), and flexible cancellation policies. Target off-season travelers like remote workers or budget-conscious guests.
- Shoulder Seasons: Implement dynamic pricing that balances peak and low rates. Target weekend travelers or specific events. Offer slightly more flexible terms than peak season.
- Regularly analyze your own performance against these Angeles seasonality benchmarks and adjust your pricing and availability strategy accordingly.
Best Areas for Airbnb Investment in Angeles (2026)
Exploring the top neighborhoods for short-term rentals in Angeles? This section highlights key areas, outlining why they are attractive for hosts and guests, along with notable local attractions. Consider these locations based on your target guest profile and investment strategy.
| Neighborhood / Area | Why Host Here? (Target Guests & Appeal) | Key Attractions & Landmarks |
|---|---|---|
| Balibago | One of the main tourist areas in Angeles, known for nightlife, entertainment, and proximity to restaurants and bars. A great place for tourists looking for an exciting experience. | Walking Street, Club XS, Casino Filipino, Kamikaze East, TNT Sports Bar |
| Clark Freeport Zone | A significant area for both business and leisure travel, with a large array of hotels, resorts, and attractions. Ideal for those looking for convenience and modern amenities. | Nayong Pilipino Clark, Aqua Planet Waterpark, Clark Museum, SM City Pampanga, Pampanga's Best Food |
| Anonas | A quieter residential area that is becoming popular with expats and locals. Good for those who prefer a more relaxed stay yet still be close to the city's attractions. | Cultural Center of the Philippines, Insectarium, Damosa Village, local dining options |
| Malabanias | Known for its diverse dining options and proximity to entertainment venues. Popular with both locals and foreigners for short-term stays. | Puning Hot Springs, 3D Museum, Paradise Ranch, Jungle Park |
| Santa Maria | A developing area gaining recognition for its accessibility to tourist spots and local attractions. Great for those looking for a balance of urban and local culture. | Mt. Arayat National Park, local food markets, eco-tourism sites |
| San Francisco | An emerging neighborhood known for its local markets and community vibe. Attracts guests looking for a more authentic experience of Angeles City. | Bayanihan Park, San Fernando Heritage District, local cultural experiences |
| Marisol Subdivision | A family-friendly residential area with easy access to urban amenities. Great for longer stays, especially for families with children. | local parks, community pools, shopping centers |
| Balibago Circumferential Road | A main thoroughfare that connects different parts of Angeles City. Easily accessible and surrounded by various attractions, making it ideal for short stays. | local dining restaurants, department stores, transport links to other areas |
Understanding Airbnb License Requirements & STR Laws in Angeles (2026)
While Angeles, Central Luzon, Philippines currently shows low STR regulations, specific Airbnb license requirements might still exist or change. Always verify the latest short term rental regulations and Airbnb license requirements directly with local government authorities for Angeles to ensure full compliance before hosting.
(Source: AirROI data, 2026, finding no licensed listings among those analyzed)
Top Performing Airbnb Properties in Angeles (2026)
Benchmark your potential! Explore examples of top-performing Airbnb properties in Angelesbased on Trailing Twelve Month (TTM) revenue. Analyze their characteristics, revenue, occupancy rate, and ADR to understand what drives success in this market.
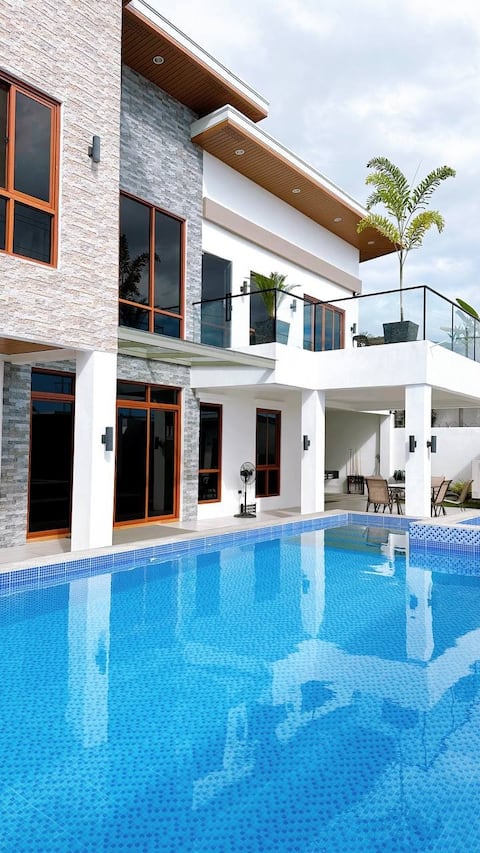
Villa God's Gift
Entire Place • 5 bedrooms

Entire Serene Villa+Private Pool
Entire Place • 4 bedrooms
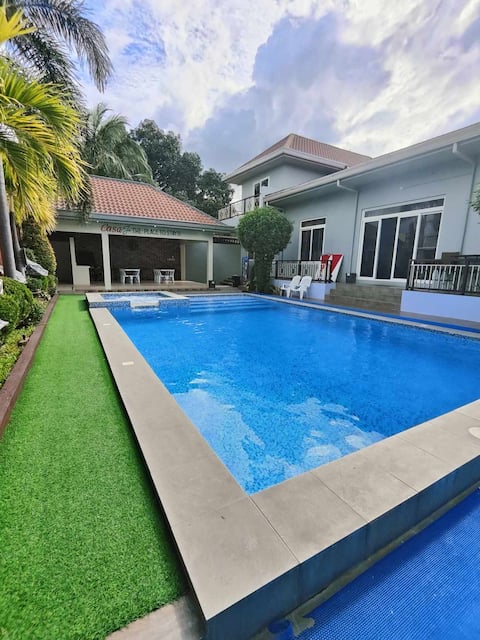
Casa J Private Villa, The Place to Stay!
Entire Place • 5 bedrooms

Newly Renovated - As New! Grand Studio Unit
Entire Place • 1 bedroom

Villa Gottes Segen
Entire Place • 3 bedrooms
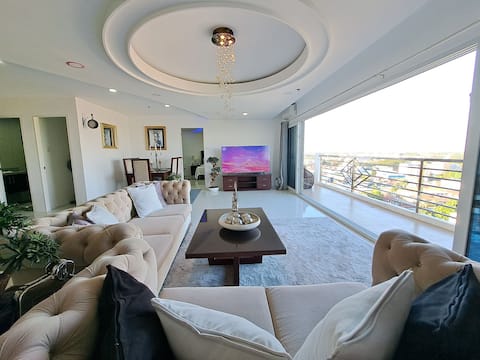
VIP 2BR Penthouse-Kandi Palace 155 sqm w/ Jacuzzi
Entire Place • 2 bedrooms
Note: Performance varies based on location, size, amenities, seasonality, and management quality. Data reflects the past 12 months.
Top Performing Airbnb Hosts in Angeles (2026)
Learn from the best! This table showcases top-performing Airbnb hosts in Angeles based on the number of properties managed and estimated total revenue over the past year. Analyze their scale and performance metrics.
| Host Name | Properties | Grossing Revenue | Stay Reviews | Avg Rating |
|---|---|---|---|---|
| Shame & Donna | 53 | $568,638 | 1669 | 4.87/5.0 |
| Sheryll | 36 | $201,342 | 676 | 4.93/5.0 |
| James | 20 | $162,976 | 1282 | 4.95/5.0 |
| Oh Se Uk (Oh My God) | 15 | $157,078 | 451 | 4.92/5.0 |
| Janus And Katrina | 5 | $133,510 | 162 | 4.86/5.0 |
| Thomas | 7 | $124,910 | 665 | 4.83/5.0 |
| Mich | 12 | $112,416 | 733 | 4.94/5.0 |
| Maricel | 8 | $87,558 | 862 | 4.95/5.0 |
| John Patrick | 11 | $87,176 | 492 | 4.85/5.0 |
| Jacques | 7 | $77,992 | 994 | 4.87/5.0 |
Analyzing the strategies of top hosts, such as their property selection, pricing, and guest communication, can offer valuable lessons for optimizing your own Airbnb operations in Angeles.
Dive Deeper: Advanced Angeles STR Market Data (2026)
Ready to unlock more insights? AirROI provides access to advanced metrics and comprehensive Airbnb data for Angeles. Explore detailed analytics beyond this report to refine your investment strategy, optimize pricing, and maximize your vacation rental profits.
Explore Advanced MetricsAngeles Short-Term Rental Market Composition (2026): Property & Room Types
Room Type Distribution
Property Type Distribution
Market Composition Insights for Angeles
- The Angeles Airbnb market composition is heavily skewed towards Entire Home/Apt listings, which make up 88.3% of the 949 active rentals. This indicates strong guest preference for privacy and space.
- Looking at the property type distribution in Angeles, Apartment/Condo properties are the most common (58.9%), reflecting the local real estate landscape.
- Houses represent a significant 31.4% portion, catering likely to families or larger groups.
- The presence of 8.1% Hotel/Boutique listings indicates integration with traditional hospitality.
- Smaller segments like outdoor/unique, unique stays, others (combined 1.6%) offer potential for unique stay experiences.
Angeles Airbnb Room Capacity Analysis (2026): Bedroom Distribution
Distribution of Listings by Number of Bedrooms
Room Capacity Insights for Angeles
- The dominant room capacity in Angeles is 1 bedroom listings, making up 39.7% of the market. This suggests a strong demand for properties suitable for couples or solo travelers.
- Together, 1 bedroom and 2 bedrooms properties represent 62.3% of the active Airbnb listings in Angeles, indicating a high concentration in these sizes.
Angeles Vacation Rental Guest Capacity Trends (2026)
Distribution of Listings by Guest Capacity
Guest Capacity Insights for Angeles
- The most common guest capacity trend in Angeles vacation rentals is listings accommodating 2 guests (43.2%). This suggests the primary traveler segment is likely couples or solo travelers.
- Properties designed for 2 guests and 8+ guests dominate the Angeles STR market, accounting for 64.1% of listings.
- A significant 43.3% of listings cater specifically to 1-2 guests, highlighting strong demand from couples and solo travelers in Angeles.
- 30.3% of properties accommodate 6+ guests, serving the market segment for larger families or group travel in Angeles.
- On average, properties in Angeles are equipped to host 4.0 guests.
Angeles Airbnb Booking Patterns (2026): Available vs. Booked Days
Available Days Distribution
Booked Days Distribution
Booking Pattern Insights for Angeles
- The most common availability pattern in Angeles falls within the 271-366 days range, representing 57.6% of listings. This suggests many properties have significant open periods on their calendars.
- Approximately 83.4% of listings show high availability (181+ days open annually), indicating potential for increased bookings or specific owner usage patterns.
- For booked days, the 31-90 days range is most frequent in Angeles (28.7%), reflecting common guest stay durations or potential owner blocking patterns.
- A notable 17.7% of properties secure long booking periods (181+ days booked per year), highlighting successful long-term rental strategies or significant owner usage.
Angeles Airbnb Minimum Stay Requirements Analysis
Distribution of Listings by Minimum Night Requirement
1 Night
572 listings
60.3% of total
2 Nights
134 listings
14.1% of total
3 Nights
59 listings
6.2% of total
4-6 Nights
24 listings
2.5% of total
7-29 Nights
22 listings
2.3% of total
30+ Nights
138 listings
14.5% of total
Key Insights
- The most prevalent minimum stay requirement in Angeles is 1 Night, adopted by 60.3% of listings. This highlights the market's preference for shorter, flexible bookings.
- A strong majority (74.4%) of the Angeles Airbnb data shows acceptance of very short stays (1-2 nights), indicating a dynamic, high-turnover market.
- A significant segment (14.5%) caters to monthly stays (30+ nights) in Angeles, pointing to opportunities in the extended-stay market.
Recommendations
- Align with the market by considering a 1 Night minimum stay, as 60.3% of Angeles hosts use this setting.
- Explore offering discounts for stays of 30+ nights to attract the 14.5% of the market seeking extended stays.
- Adjust minimum nights based on seasonality – potentially shorter during low season and longer during peak demand periods in Angeles.
Angeles Airbnb Cancellation Policy Trends Analysis (2026)
Super Strict 60 Days
4 listings
0.4% of total
Limited
43 listings
4.5% of total
Flexible
199 listings
21% of total
Moderate
176 listings
18.6% of total
Firm
380 listings
40.1% of total
Strict
146 listings
15.4% of total
Cancellation Policy Insights for Angeles
- The prevailing Airbnb cancellation policy trend in Angeles is Firm, used by 40.1% of listings.
- A majority (55.5%) of hosts in Angeles utilize Firm or Strict policies, indicating a market where hosts prioritize booking security.
Recommendations for Hosts
- Consider adopting a Firm policy to align with the 40.1% market standard in Angeles.
- Regularly review your cancellation policy against competitors and market demand shifts in Angeles.
Angeles STR Booking Lead Time Analysis (2026)
Average Booking Lead Time by Month
Booking Lead Time Insights for Angeles
- The overall average booking lead time for vacation rentals in Angeles is 23 days.
- Guests book furthest in advance for stays during January (average 30 days), likely coinciding with peak travel demand or local events.
- The shortest booking windows occur for stays in June (average 19 days), indicating more last-minute travel plans during this time.
- Seasonally, Winter (27 days avg.) sees the longest lead times, while Summer (20 days avg.) has the shortest, reflecting typical travel planning cycles.
Recommendations for Hosts
- Use the overall average lead time (23 days) as a baseline for your pricing and availability strategy in Angeles.
- Target marketing efforts for the Winter season well in advance (at least 27 days) to capture early planners.
- Monitor your own booking lead times against these Angeles averages to identify opportunities for dynamic pricing adjustments.
Popular & Essential Airbnb Amenities in Angeles (2026)
Amenity Prevalence
Amenity Insights for Angeles
- Essential amenities in Angeles that guests expect include: Wifi, Air conditioning, TV. Lacking these (any) could significantly impact bookings.
- Popular amenities like Kitchen, Free parking on premises, Dishes and silverware are common but not universal. Offering these can provide a competitive edge.
Recommendations for Hosts
- Ensure your listing includes all essential amenities for Angeles: Wifi, Air conditioning, TV.
- Prioritize adding missing essentials: Wifi, Air conditioning, TV.
- Consider adding popular differentiators like Kitchen or Free parking on premises to increase appeal.
- Highlight unique or less common amenities you offer (e.g., hot tub, dedicated workspace, EV charger) in your listing description and photos.
- Regularly check competitor amenities in Angeles to stay competitive.
Angeles Airbnb Guest Demographics & Profile Analysis (2026)
Guest Profile Summary for Angeles
- The typical guest profile for Airbnb in Angeles consists of a mix of domestic (43%) and international guests, with top international origins including United States, typically belonging to the Post-2000s (Gen Z/Alpha) group (50%), primarily speaking English or Tagalog.
- Domestic travelers account for 43.0% of guests.
- Key international markets include Philippines (43%) and United States (24.6%).
- Top languages spoken are English (53.8%) followed by Tagalog (11.6%).
- A significant demographic segment is the Post-2000s (Gen Z/Alpha) group, representing 50% of guests.
Recommendations for Hosts
- Balance marketing efforts between domestic and international channels based on the guest mix.
- Tailor amenities and listing descriptions to appeal to the dominant Post-2000s (Gen Z/Alpha) demographic (e.g., highlight fast WiFi, smart home features, local guides).
- Highlight unique local experiences or amenities relevant to the primary guest profile.
- Consider seasonal promotions aligned with peak travel times for key origin markets.
Nearby Short-Term Rental Market Comparison
How does the Angeles Airbnb market stack up against its neighbors? Compare key performance metrics like average monthly revenue, ADR, and occupancy rates in surrounding areas to understand the broader regional STR landscape.
| Market | Active Properties | Monthly Revenue | Daily Rate | Avg. Occupancy |
|---|---|---|---|---|
| Bustos | 10 | $1,728 | $216.86 | 28% |
| Cabangan | 44 | $1,529 | $200.94 | 26% |
| Jalajala | 19 | $1,489 | $234.86 | 21% |
| Laoag | 17 | $1,412 | $158.39 | 33% |
| Beneg | 13 | $1,304 | $267.34 | 22% |
| Arew | 11 | $1,288 | $193.81 | 22% |
| Cabuyao | 25 | $1,202 | $114.93 | 36% |
| Binangonan | 49 | $1,191 | $135.12 | 29% |
| Porac | 51 | $1,157 | $203.91 | 21% |
| Los Baños | 158 | $1,129 | $242.23 | 21% |