Lobo Airbnb Market Analysis 2026: Short Term Rental Data & Vacation Rental Statistics in Batangas, Philippines
Is Airbnb profitable in Lobo in 2026? Explore comprehensive Airbnb analytics for Lobo, Batangas, Philippines to uncover income potential. This 2026 STR market report for Lobo, based on AirROI data from February 2025 to January 2026, reveals key trends in the niche market of 38 active listings.
Whether you're considering an Airbnb investment in Lobo, optimizing your existing vacation rental, or exploring rental arbitrage opportunities, understanding the Lobo Airbnb data is crucial. Leveraging the low regulation environment is key to maximizing your short term rental income potential. Let's dive into the specifics.
Key Lobo Airbnb Performance Metrics Overview
Monthly Airbnb Revenue Variations & Income Potential in Lobo (2026)
Understanding the monthly revenue variations for Airbnb listings in Lobo is key to maximizing your short term rental income potential. Seasonality significantly impacts earnings. Our analysis, based on data from the past 12 months, shows that the peak revenue month for STRs in Lobo is typically April, while November often presents the lowest earnings, highlighting opportunities for strategic pricing adjustments during shoulder and low seasons. Explore the typical Airbnb income in Lobo across different performance tiers:
- Best-in-class properties (Top 10%) achieve $3,737+ monthly, often utilizing dynamic pricing and superior guest experiences.
- Strong performing properties (Top 25%) earn $2,132 or more, indicating effective management and desirable locations/amenities.
- Typical properties (Median) generate around $1,085 per month, representing the average market performance.
- Entry-level properties (Bottom 25%) see earnings around $462, often with potential for optimization.
Average Monthly Airbnb Earnings Trend in Lobo
Lobo Airbnb Occupancy Rate Trends (2026)
Maximize your bookings by understanding the Lobo STR occupancy trends. Seasonal demand shifts significantly influence how often properties are booked. Typically, Aprilsees the highest demand (peak season occupancy), while October experiences the lowest (low season). Effective strategies, like adjusting minimum stays or offering promotions, can boost occupancy during slower periods. Here's how different property tiers perform in Lobo:
- Best-in-class properties (Top 10%) achieve 51%+ occupancy, indicating high desirability and potentially optimized availability.
- Strong performing properties (Top 25%) maintain 38% or higher occupancy, suggesting good market fit and guest satisfaction.
- Typical properties (Median) have an occupancy rate around 20%.
- Entry-level properties (Bottom 25%) average 9% occupancy, potentially facing higher vacancy.
Average Monthly Occupancy Rate Trend in Lobo
Average Daily Rate (ADR) Airbnb Trends in Lobo (2026)
Effective short term rental pricing strategy in Lobo involves understanding monthly ADR fluctuations. The Average Daily Rate (ADR) for Airbnb in Lobo typically peaks in June and dips lowest during February. Leveraging Airbnb dynamic pricing tools or strategies based on this seasonality can significantly boost revenue. Here's a look at the typical nightly rates achieved:
- Best-in-class properties (Top 10%) command rates of $392+ per night, often due to premium features or locations.
- Strong performing properties (Top 25%) achieve nightly rates of $251 or more.
- Typical properties (Median) charge around $171 per night.
- Entry-level properties (Bottom 25%) earn around $88 per night.
Average Daily Rate (ADR) Trend by Month in Lobo
Get Live Lobo Market Intelligence 👇

Explore Real-time Analytics
Airbnb Seasonality Analysis & Trends in Lobo (2026)
Peak Season (April, May, June)
- Revenue averages $2,159 per month
- Occupancy rates average 31.7%
- Daily rates average $201
Shoulder Season
- Revenue averages $1,575 per month
- Occupancy maintains around 26.0%
- Daily rates hold near $199
Low Season (September, October, November)
- Revenue drops to average $1,043 per month
- Occupancy decreases to average 15.9%
- Daily rates adjust to average $198
Seasonality Insights for Lobo
- The Airbnb seasonality in Lobo shows highly seasonal trends requiring careful strategy. While the sections above show seasonal averages, it's also insightful to look at the extremes:
- During the high season, the absolute peak month showcases Lobo's highest earning potential, with monthly revenues capable of climbing to $2,419, occupancy reaching a high of 37.5%, and ADRs peaking at $206.
- Conversely, the slowest single month of the year, typically falling within the low season, marks the market's lowest point. In this month, revenue might dip to $1,023, occupancy could drop to 15.1%, and ADRs may adjust down to $194.
- Understanding both the seasonal averages and these monthly peaks and troughs in revenue, occupancy, and ADR is crucial for maximizing your Airbnb profit potential in Lobo.
Seasonal Strategies for Maximizing Profit
- Peak Season: Maximize revenue through premium pricing and potentially longer minimum stays. Ensure high availability.
- Low Season: Offer competitive pricing, special promotions (e.g., extended stay discounts), and flexible cancellation policies. Target off-season travelers like remote workers or budget-conscious guests.
- Shoulder Seasons: Implement dynamic pricing that balances peak and low rates. Target weekend travelers or specific events. Offer slightly more flexible terms than peak season.
- Regularly analyze your own performance against these Lobo seasonality benchmarks and adjust your pricing and availability strategy accordingly.
Best Areas for Airbnb Investment in Lobo (2026)
Exploring the top neighborhoods for short-term rentals in Lobo? This section highlights key areas, outlining why they are attractive for hosts and guests, along with notable local attractions. Consider these locations based on your target guest profile and investment strategy.
| Neighborhood / Area | Why Host Here? (Target Guests & Appeal) | Key Attractions & Landmarks |
|---|---|---|
| Canyon Cove | A popular beachfront resort destination known for its beautiful scenery and family-friendly atmosphere. Ideal for guests seeking relaxation and outdoor activities. | Canyon Cove Beach, Taal Volcano, Bunagun Waterfalls, Mount Batulao, Nasugbu Mangrove Park, Sombrero Island |
| Puerto Galera | Famous for its stunning beaches and vibrant nightlife, Puerto Galera is a top destination for both local and international tourists, making it ideal for short-term rental opportunities. | White Beach, Sabang Beach, Aninuan Beach, Tamaraw Waterfalls, Puerto Galera Yacht Club, Coral Garden |
| Batangas City | As the capital of Batangas, it serves as a gateway for travelers with diverse attractions, historical sites, and accessibility to other tourist spots, making it appealing for Airbnb hosts. | Batangas Cathedral, Michael D. P. O. San Juan Beach, Mount Malarayat, Batangas Port, Kumintang Park, Heritage Town of Taal |
| Nasugbu | Known for its beach resorts and proximity to scenic locations, Nasugbu attracts tourists looking for scenic getaways with an active lifestyle. | Nasugbu Beach, Kaybiang Tunnel, Mount Batulao, Marimar Beach, Terra Verde Beach Resort |
| San Juan | San Juan is famous for its surf spots and coastal beauty, appealing to adventure seekers and vacationers alike, making it a prime area for short-term rentals. | Surfing spots, San Juan Beach, Urbiztondo Beach, Kak mahdollista, Pagkilatan Falls |
| Taal | Rich in cultural heritage and known for its historical sites, Taal offers a unique experience for visitors interested in Filipino history and architecture, making it a cultural hotspot for Airbnb hosting. | Taal Basilica, Taal Heritage Town, Basilica of St. Martin de Tours, The Old Gahum House, Taal Volcano |
| Laurel | Situated near Taal Lake, Laurel offers natural beauty and tranquility, attracting tourists eager for a peaceful escape where they can connect with nature. | Taal Lake, Matabungkay Beach, Oriang resort, Centennial Garden, Taal Volcano viewpoint |
| Calatagan | Famous for its beautiful beaches and clear waters, Calatagan is perfect for water sports enthusiasts and families looking for fun weekend getaways or longer holidays. | Calatagan Beach, Cape Santiago Lighthouse, Burot Beach, Tal robroad, Rainbow Beach |
Understanding Airbnb License Requirements & STR Laws in Lobo (2026)
While Lobo, Batangas, Philippines currently shows low STR regulations, specific Airbnb license requirements might still exist or change. Always verify the latest short term rental regulations and Airbnb license requirements directly with local government authorities for Lobo to ensure full compliance before hosting.
(Source: AirROI data, 2026, finding no licensed listings among those analyzed)
Top Performing Airbnb Properties in Lobo (2026)
Benchmark your potential! Explore examples of top-performing Airbnb properties in Lobobased on Trailing Twelve Month (TTM) revenue. Analyze their characteristics, revenue, occupancy rate, and ADR to understand what drives success in this market.
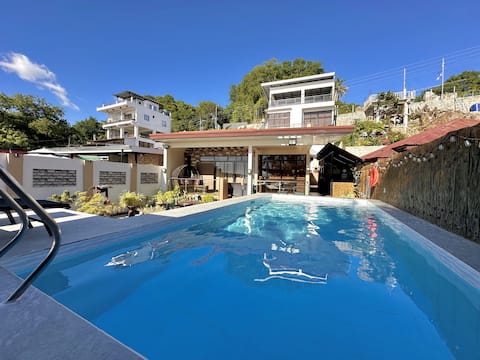
Beach getaway Villa in Lobo
Entire Place • 2 bedrooms
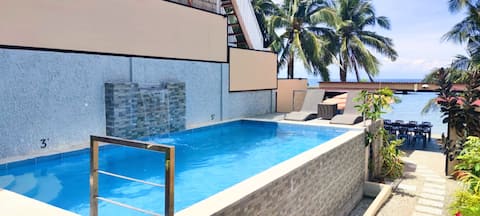
Exclusive Beachfront House w/ Pool Batangas 16pax
Entire Place • 2 bedrooms

Cozy Beach House Lobo (Villa + Room)
Entire Place • 2 bedrooms

Anna's Ocean View Place / Beachfront Home
Entire Place • 5 bedrooms
Cozy Beach House in Lobo (Main Villa)
Entire Place • N/A

Private Twin Villas Cove Lobo Beach House
Entire Place • 6 bedrooms
Note: Performance varies based on location, size, amenities, seasonality, and management quality. Data reflects the past 12 months.
Top Performing Airbnb Hosts in Lobo (2026)
Learn from the best! This table showcases top-performing Airbnb hosts in Lobo based on the number of properties managed and estimated total revenue over the past year. Analyze their scale and performance metrics.
| Host Name | Properties | Grossing Revenue | Stay Reviews | Avg Rating |
|---|---|---|---|---|
| Carrol Joyce | 2 | $71,857 | 165 | 4.81/5.0 |
| Carl | 1 | $68,898 | 56 | 4.95/5.0 |
| Nina Asleigh | 3 | $48,668 | 86 | 4.68/5.0 |
| April Marie | 2 | $45,688 | 53 | 4.92/5.0 |
| Anna | 1 | $37,273 | 64 | 4.50/5.0 |
| Joanna | 1 | $30,263 | 1 | Not Rated |
| Jasmine | 1 | $26,400 | 27 | 4.78/5.0 |
| Karla | 1 | $22,044 | 71 | 4.92/5.0 |
| Bigang Munti | 2 | $16,269 | 3 | Not Rated |
| Annabelle | 1 | $15,784 | 15 | 4.60/5.0 |
Analyzing the strategies of top hosts, such as their property selection, pricing, and guest communication, can offer valuable lessons for optimizing your own Airbnb operations in Lobo.
Dive Deeper: Advanced Lobo STR Market Data (2026)
Ready to unlock more insights? AirROI provides access to advanced metrics and comprehensive Airbnb data for Lobo. Explore detailed analytics beyond this report to refine your investment strategy, optimize pricing, and maximize your vacation rental profits.
Explore Advanced MetricsLobo Short-Term Rental Market Composition (2026): Property & Room Types
Room Type Distribution
Property Type Distribution
Market Composition Insights for Lobo
- The Lobo Airbnb market composition is heavily skewed towards Entire Home/Apt listings, which make up 73.7% of the 38 active rentals. This indicates strong guest preference for privacy and space.
- Looking at the property type distribution in Lobo, House properties are the most common (47.4%), reflecting the local real estate landscape.
- Houses represent a significant 47.4% portion, catering likely to families or larger groups.
- The presence of 10.5% Hotel/Boutique listings indicates integration with traditional hospitality.
- Smaller segments like unique stays, apartment/condo (combined 5.2%) offer potential for unique stay experiences.
Lobo Airbnb Room Capacity Analysis (2026): Bedroom Distribution
Distribution of Listings by Number of Bedrooms
Room Capacity Insights for Lobo
- The dominant room capacity in Lobo is 1 bedroom listings, making up 28.9% of the market. This suggests a strong demand for properties suitable for couples or solo travelers.
- Together, 1 bedroom and 2 bedrooms properties represent 50.0% of the active Airbnb listings in Lobo, indicating a high concentration in these sizes.
- A significant 34.3% of listings offer 3+ bedrooms, catering to larger groups and families seeking more space in Lobo.
Lobo Vacation Rental Guest Capacity Trends (2026)
Distribution of Listings by Guest Capacity
Guest Capacity Insights for Lobo
- The most common guest capacity trend in Lobo vacation rentals is listings accommodating 8+ guests (76.3%). This suggests the primary traveler segment is likely larger groups.
- Properties designed for 8+ guests and 7 guests dominate the Lobo STR market, accounting for 81.6% of listings.
- 86.9% of properties accommodate 6+ guests, serving the market segment for larger families or group travel in Lobo.
- On average, properties in Lobo are equipped to host 6.8 guests.
Lobo Airbnb Booking Patterns (2026): Available vs. Booked Days
Available Days Distribution
Booked Days Distribution
Booking Pattern Insights for Lobo
- The most common availability pattern in Lobo falls within the 271-366 days range, representing 73.7% of listings. This suggests many properties have significant open periods on their calendars.
- Approximately 97.4% of listings show high availability (181+ days open annually), indicating potential for increased bookings or specific owner usage patterns.
- For booked days, the 1-30 days range is most frequent in Lobo (42.1%), reflecting common guest stay durations or potential owner blocking patterns.
- A notable 2.6% of properties secure long booking periods (181+ days booked per year), highlighting successful long-term rental strategies or significant owner usage.
Lobo Airbnb Minimum Stay Requirements Analysis
Distribution of Listings by Minimum Night Requirement
1 Night
37 listings
97.4% of total
7-29 Nights
1 listings
2.6% of total
Key Insights
- The most prevalent minimum stay requirement in Lobo is 1 Night, adopted by 97.4% of listings. This highlights the market's preference for shorter, flexible bookings.
- A strong majority (97.4%) of the Lobo Airbnb data shows acceptance of very short stays (1-2 nights), indicating a dynamic, high-turnover market.
Recommendations
- Align with the market by considering a 1 Night minimum stay, as 97.4% of Lobo hosts use this setting.
- Adjust minimum nights based on seasonality – potentially shorter during low season and longer during peak demand periods in Lobo.
Lobo Airbnb Cancellation Policy Trends Analysis (2026)
Limited
4 listings
10.5% of total
Flexible
5 listings
13.2% of total
Moderate
12 listings
31.6% of total
Firm
14 listings
36.8% of total
Strict
3 listings
7.9% of total
Cancellation Policy Insights for Lobo
- The prevailing Airbnb cancellation policy trend in Lobo is Firm, used by 36.8% of listings.
- There's a relatively balanced mix between guest-friendly (44.8%) and stricter (44.7%) policies, offering choices for different guest needs.
- Strict cancellation policies are quite rare (7.9%), potentially making listings with this policy less competitive unless justified by high demand or property type.
Recommendations for Hosts
- Consider adopting a Firm policy to align with the 36.8% market standard in Lobo.
- Using a Strict policy might deter some guests, as only 7.9% of listings use it. Evaluate if potential revenue protection outweighs possible lower booking rates.
- Regularly review your cancellation policy against competitors and market demand shifts in Lobo.
Lobo STR Booking Lead Time Analysis (2026)
Average Booking Lead Time by Month
Booking Lead Time Insights for Lobo
- The overall average booking lead time for vacation rentals in Lobo is 25 days.
- Guests book furthest in advance for stays during January (average 55 days), likely coinciding with peak travel demand or local events.
- The shortest booking windows occur for stays in August (average 16 days), indicating more last-minute travel plans during this time.
- Seasonally, Winter (33 days avg.) sees the longest lead times, while Summer (22 days avg.) has the shortest, reflecting typical travel planning cycles.
Recommendations for Hosts
- Use the overall average lead time (25 days) as a baseline for your pricing and availability strategy in Lobo.
- For January stays, consider implementing length-of-stay discounts or slightly higher rates for bookings made less than 55 days out to capitalize on advance planning.
- Target marketing efforts for the Winter season well in advance (at least 33 days) to capture early planners.
- Monitor your own booking lead times against these Lobo averages to identify opportunities for dynamic pricing adjustments.
Popular & Essential Airbnb Amenities in Lobo (2026)
Amenity Prevalence
Amenity Insights for Lobo
- Essential amenities in Lobo that guests expect include: Air conditioning, Beach access. Lacking these (any) could significantly impact bookings.
- Popular amenities like Kitchen, Dishes and silverware, Bidet are common but not universal. Offering these can provide a competitive edge.
Recommendations for Hosts
- Ensure your listing includes all essential amenities for Lobo: Air conditioning, Beach access.
- Prioritize adding missing essentials: Air conditioning, Beach access.
- Consider adding popular differentiators like Kitchen or Dishes and silverware to increase appeal.
- Highlight unique or less common amenities you offer (e.g., hot tub, dedicated workspace, EV charger) in your listing description and photos.
- Regularly check competitor amenities in Lobo to stay competitive.
Lobo Airbnb Guest Demographics & Profile Analysis (2026)
Guest Profile Summary for Lobo
- The typical guest profile for Airbnb in Lobo consists of primarily domestic travelers (83%), often arriving from nearby Manila, typically belonging to the Post-2000s (Gen Z/Alpha) group (50%), primarily speaking English or Tagalog.
- Domestic travelers account for 83.1% of guests.
- Key international markets include Philippines (83.1%) and United States (5.6%).
- Top languages spoken are English (51.5%) followed by Tagalog (25%).
- A significant demographic segment is the Post-2000s (Gen Z/Alpha) group, representing 50% of guests.
Recommendations for Hosts
- Target domestic marketing efforts towards travelers from Manila and Quezon City.
- Tailor amenities and listing descriptions to appeal to the dominant Post-2000s (Gen Z/Alpha) demographic (e.g., highlight fast WiFi, smart home features, local guides).
- Highlight unique local experiences or amenities relevant to the primary guest profile.
- Consider seasonal promotions aligned with peak travel times for key origin markets.
Nearby Short-Term Rental Market Comparison
How does the Lobo Airbnb market stack up against its neighbors? Compare key performance metrics like average monthly revenue, ADR, and occupancy rates in surrounding areas to understand the broader regional STR landscape.
| Market | Active Properties | Monthly Revenue | Daily Rate | Avg. Occupancy |
|---|---|---|---|---|
| Bustos | 10 | $1,728 | $216.86 | 28% |
| Lian | 121 | $1,491 | $216.20 | 24% |
| Jalajala | 19 | $1,489 | $234.86 | 21% |
| Cabuyao | 25 | $1,202 | $114.93 | 36% |
| Binangonan | 49 | $1,191 | $135.12 | 29% |
| Los Baños | 158 | $1,129 | $242.23 | 21% |
| Meycauayan | 10 | $1,054 | $142.86 | 24% |
| Alfonso | 189 | $1,049 | $191.29 | 19% |
| Tanauan | 24 | $1,047 | $169.98 | 31% |
| Lubao | 29 | $978 | $157.80 | 24% |