Chontabamba Airbnb Market Analysis 2026: Short Term Rental Data & Vacation Rental Statistics in Pasco, Peru
Is Airbnb profitable in Chontabamba in 2026? Explore comprehensive Airbnb analytics for Chontabamba, Pasco, Peru to uncover income potential. This 2026 STR market report for Chontabamba, based on AirROI data from February 2025 to January 2026, reveals key trends in the niche market of 76 active listings.
Whether you're considering an Airbnb investment in Chontabamba, optimizing your existing vacation rental, or exploring rental arbitrage opportunities, understanding the Chontabamba Airbnb data is crucial. Leveraging the low regulation environment is key to maximizing your short term rental income potential. Let's dive into the specifics.
Key Chontabamba Airbnb Performance Metrics Overview
Monthly Airbnb Revenue Variations & Income Potential in Chontabamba (2026)
Understanding the monthly revenue variations for Airbnb listings in Chontabamba is key to maximizing your short term rental income potential. Seasonality significantly impacts earnings. Our analysis, based on data from the past 12 months, shows that the peak revenue month for STRs in Chontabamba is typically July, while November often presents the lowest earnings, highlighting opportunities for strategic pricing adjustments during shoulder and low seasons. Explore the typical Airbnb income in Chontabamba across different performance tiers:
- Best-in-class properties (Top 10%) achieve $1,362+ monthly, often utilizing dynamic pricing and superior guest experiences.
- Strong performing properties (Top 25%) earn $626 or more, indicating effective management and desirable locations/amenities.
- Typical properties (Median) generate around $333 per month, representing the average market performance.
- Entry-level properties (Bottom 25%) see earnings around $163, often with potential for optimization.
Average Monthly Airbnb Earnings Trend in Chontabamba
Chontabamba Airbnb Occupancy Rate Trends (2026)
Maximize your bookings by understanding the Chontabamba STR occupancy trends. Seasonal demand shifts significantly influence how often properties are booked. Typically, Julysees the highest demand (peak season occupancy), while November experiences the lowest (low season). Effective strategies, like adjusting minimum stays or offering promotions, can boost occupancy during slower periods. Here's how different property tiers perform in Chontabamba:
- Best-in-class properties (Top 10%) achieve 51%+ occupancy, indicating high desirability and potentially optimized availability.
- Strong performing properties (Top 25%) maintain 30% or higher occupancy, suggesting good market fit and guest satisfaction.
- Typical properties (Median) have an occupancy rate around 17%.
- Entry-level properties (Bottom 25%) average 10% occupancy, potentially facing higher vacancy.
Average Monthly Occupancy Rate Trend in Chontabamba
Average Daily Rate (ADR) Airbnb Trends in Chontabamba (2026)
Effective short term rental pricing strategy in Chontabamba involves understanding monthly ADR fluctuations. The Average Daily Rate (ADR) for Airbnb in Chontabamba typically peaks in July and dips lowest during February. Leveraging Airbnb dynamic pricing tools or strategies based on this seasonality can significantly boost revenue. Here's a look at the typical nightly rates achieved:
- Best-in-class properties (Top 10%) command rates of $147+ per night, often due to premium features or locations.
- Strong performing properties (Top 25%) achieve nightly rates of $95 or more.
- Typical properties (Median) charge around $58 per night.
- Entry-level properties (Bottom 25%) earn around $39 per night.
Average Daily Rate (ADR) Trend by Month in Chontabamba
Get Live Chontabamba Market Intelligence 👇

Explore Real-time Analytics
Airbnb Seasonality Analysis & Trends in Chontabamba (2026)
Peak Season (July, October, December)
- Revenue averages $686 per month
- Occupancy rates average 25.9%
- Daily rates average $84
Shoulder Season
- Revenue averages $505 per month
- Occupancy maintains around 22.1%
- Daily rates hold near $81
Low Season (February, September, November)
- Revenue drops to average $411 per month
- Occupancy decreases to average 21.4%
- Daily rates adjust to average $77
Seasonality Insights for Chontabamba
- The Airbnb seasonality in Chontabamba shows highly seasonal trends requiring careful strategy. While the sections above show seasonal averages, it's also insightful to look at the extremes:
- During the high season, the absolute peak month showcases Chontabamba's highest earning potential, with monthly revenues capable of climbing to $783, occupancy reaching a high of 28.9%, and ADRs peaking at $86.
- Conversely, the slowest single month of the year, typically falling within the low season, marks the market's lowest point. In this month, revenue might dip to $400, occupancy could drop to 17.7%, and ADRs may adjust down to $76.
- Understanding both the seasonal averages and these monthly peaks and troughs in revenue, occupancy, and ADR is crucial for maximizing your Airbnb profit potential in Chontabamba.
Seasonal Strategies for Maximizing Profit
- Peak Season: Maximize revenue through premium pricing and potentially longer minimum stays. Ensure high availability.
- Low Season: Offer competitive pricing, special promotions (e.g., extended stay discounts), and flexible cancellation policies. Target off-season travelers like remote workers or budget-conscious guests.
- Shoulder Seasons: Implement dynamic pricing that balances peak and low rates. Target weekend travelers or specific events. Offer slightly more flexible terms than peak season.
- Regularly analyze your own performance against these Chontabamba seasonality benchmarks and adjust your pricing and availability strategy accordingly.
Best Areas for Airbnb Investment in Chontabamba (2026)
Exploring the top neighborhoods for short-term rentals in Chontabamba? This section highlights key areas, outlining why they are attractive for hosts and guests, along with notable local attractions. Consider these locations based on your target guest profile and investment strategy.
| Neighborhood / Area | Why Host Here? (Target Guests & Appeal) | Key Attractions & Landmarks |
|---|---|---|
| Chontabamba Centro | The heart of Chontabamba with easy access to local markets and restaurants. Ideal for travelers looking to experience local culture and cuisine. | Local Markets, Chontabamba River, Café and restaurants, Cultural events, Scenic views |
| Tingo Maria National Park | A stunning natural area near Chontabamba that attracts nature lovers and adventure seekers. Offers ecological tours and beautiful landscapes. | Waterfalls, Hiking trails, Wildlife tours, Natural hot springs |
| Huancaya | Known for its breathtaking landscapes and turquoise rivers, Huancaya is perfect for travelers looking for tranquility and nature activities. | Laguna de Huancaya, Cultural Heritage sites, Hiking, Nature photography |
| Oxapampa | A popular destination nearby known for its coffee and stunning mountainous landscapes. Attracts eco-tourists and those interested in agritourism. | Coffee plantations, Centro Internacional de la Papa, Natural Parks, Cultural festivals |
| Pampa Michi | A peaceful escape that offers opportunities for fishing and relaxation by the river. Great for families and groups seeking a quiet retreat. | Fishing spots, Scenic views, Picnic areas |
| Villa Rica | Famous for its coffee and cultural experiences, Villa Rica appeals to visitors looking for a taste of local life and beautiful landscapes. | Coffee tours, Warm climate, Traditional cuisine |
| Pichanaki | Located in a lush valley, Pichanaki offers rich cultural experiences and is a hub for observation of tropical flora and fauna. | Cultural tours, Mango plantations, Tropical gardens |
| Santa Teresa | A tranquil area known for its natural beauty and outdoor activities, ideal for travelers looking for peace and adventure. | Hiking, Bird watching, Natural hot springs |
Understanding Airbnb License Requirements & STR Laws in Chontabamba (2026)
While Chontabamba, Pasco, Peru currently shows low STR regulations, specific Airbnb license requirements might still exist or change. Always verify the latest short term rental regulations and Airbnb license requirements directly with local government authorities for Chontabamba to ensure full compliance before hosting.
(Source: AirROI data, 2026, finding no licensed listings among those analyzed)
Top Performing Airbnb Properties in Chontabamba (2026)
Benchmark your potential! Explore examples of top-performing Airbnb properties in Chontabambabased on Trailing Twelve Month (TTM) revenue. Analyze their characteristics, revenue, occupancy rate, and ADR to understand what drives success in this market.
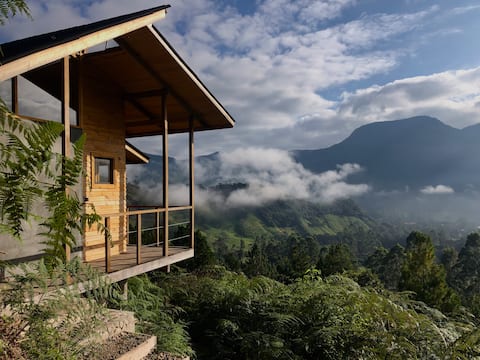
Mount Cherom: Motmot cabin in the cloud forest
Entire Place • 1 bedroom
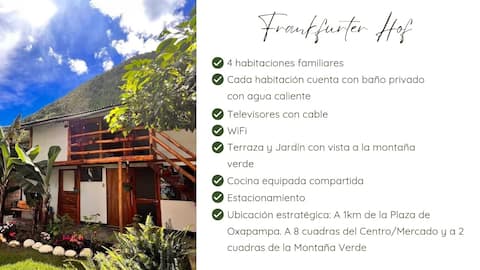
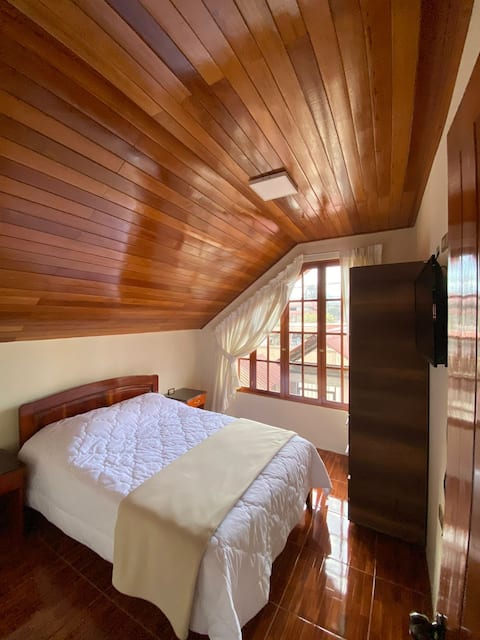
Full Lodging/Kitchen/Garage/ Frankfurter Hof
Entire Place • 4 bedrooms
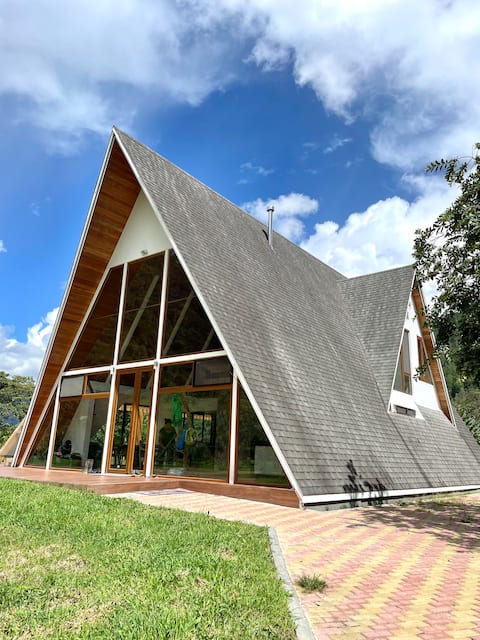
Maro Haus
Entire Place • 4 bedrooms
Oxapampa de Lujo, Private Neighborhood
Entire Place • 3 bedrooms
Beautiful House Near Downtown
Entire Place • 5 bedrooms

In the Heart of Nature at Camona Ecolodge
Entire Place • 2 bedrooms
Note: Performance varies based on location, size, amenities, seasonality, and management quality. Data reflects the past 12 months.
Top Performing Airbnb Hosts in Chontabamba (2026)
Learn from the best! This table showcases top-performing Airbnb hosts in Chontabamba based on the number of properties managed and estimated total revenue over the past year. Analyze their scale and performance metrics.
| Host Name | Properties | Grossing Revenue | Stay Reviews | Avg Rating |
|---|---|---|---|---|
| Dámaris | 5 | $32,777 | 154 | 4.87/5.0 |
| Diego Alonso | 2 | $30,676 | 62 | 4.98/5.0 |
| Annie | 3 | $19,372 | 229 | 4.94/5.0 |
| Frans | 1 | $12,265 | 23 | 5.00/5.0 |
| Rafael | 1 | $12,223 | 12 | 5.00/5.0 |
| Patricia | 3 | $11,899 | 28 | 5.00/5.0 |
| Rosa | 4 | $11,864 | 35 | 4.83/5.0 |
| Tannie | 3 | $11,817 | 31 | 4.96/5.0 |
| Jeanpierrs Alexander | 1 | $11,407 | 16 | 5.00/5.0 |
| Gustavo | 2 | $10,198 | 41 | 4.87/5.0 |
Analyzing the strategies of top hosts, such as their property selection, pricing, and guest communication, can offer valuable lessons for optimizing your own Airbnb operations in Chontabamba.
Dive Deeper: Advanced Chontabamba STR Market Data (2026)
Ready to unlock more insights? AirROI provides access to advanced metrics and comprehensive Airbnb data for Chontabamba. Explore detailed analytics beyond this report to refine your investment strategy, optimize pricing, and maximize your vacation rental profits.
Explore Advanced MetricsChontabamba Short-Term Rental Market Composition (2026): Property & Room Types
Room Type Distribution
Property Type Distribution
Market Composition Insights for Chontabamba
- The Chontabamba Airbnb market composition is heavily skewed towards Entire Home/Apt listings, which make up 75% of the 76 active rentals. This indicates strong guest preference for privacy and space.
- Looking at the property type distribution in Chontabamba, Outdoor/Unique properties are the most common (46.1%), reflecting the local real estate landscape.
- Houses represent a significant 26.3% portion, catering likely to families or larger groups.
- The presence of 13.2% Hotel/Boutique listings indicates integration with traditional hospitality.
- Smaller segments like others (combined 2.6%) offer potential for unique stay experiences.
Chontabamba Airbnb Room Capacity Analysis (2026): Bedroom Distribution
Distribution of Listings by Number of Bedrooms
Room Capacity Insights for Chontabamba
- The dominant room capacity in Chontabamba is 2 bedrooms listings, making up 42.1% of the market. This suggests a strong demand for properties suitable for couples or solo travelers.
- Together, 2 bedrooms and 1 bedroom properties represent 67.1% of the active Airbnb listings in Chontabamba, indicating a high concentration in these sizes.
Chontabamba Vacation Rental Guest Capacity Trends (2026)
Distribution of Listings by Guest Capacity
Guest Capacity Insights for Chontabamba
- The most common guest capacity trend in Chontabamba vacation rentals is listings accommodating 4 guests (19.7%). This suggests the primary traveler segment is likely small families or groups.
- Properties designed for 4 guests and 8+ guests dominate the Chontabamba STR market, accounting for 38.1% of listings.
- 29.0% of properties accommodate 6+ guests, serving the market segment for larger families or group travel in Chontabamba.
- On average, properties in Chontabamba are equipped to host 4.3 guests.
Chontabamba Airbnb Booking Patterns (2026): Available vs. Booked Days
Available Days Distribution
Booked Days Distribution
Booking Pattern Insights for Chontabamba
- The most common availability pattern in Chontabamba falls within the 271-366 days range, representing 88.2% of listings. This suggests many properties have significant open periods on their calendars.
- Approximately 94.8% of listings show high availability (181+ days open annually), indicating potential for increased bookings or specific owner usage patterns.
- For booked days, the 1-30 days range is most frequent in Chontabamba (46.1%), reflecting common guest stay durations or potential owner blocking patterns.
- A notable 5.3% of properties secure long booking periods (181+ days booked per year), highlighting successful long-term rental strategies or significant owner usage.
Chontabamba Airbnb Minimum Stay Requirements Analysis
Distribution of Listings by Minimum Night Requirement
1 Night
19 listings
25% of total
2 Nights
39 listings
51.3% of total
3 Nights
2 listings
2.6% of total
30+ Nights
16 listings
21.1% of total
Key Insights
- The most prevalent minimum stay requirement in Chontabamba is 2 Nights, adopted by 51.3% of listings. This highlights the market's preference for shorter, flexible bookings.
- A strong majority (76.3%) of the Chontabamba Airbnb data shows acceptance of very short stays (1-2 nights), indicating a dynamic, high-turnover market.
- A significant segment (21.1%) caters to monthly stays (30+ nights) in Chontabamba, pointing to opportunities in the extended-stay market.
Recommendations
- Align with the market by considering a 2 Nights minimum stay, as 51.3% of Chontabamba hosts use this setting.
- If feasible, allowing 1-night stays, especially midweek or during low season, could capture last-minute bookings, as only 25% currently do.
- Explore offering discounts for stays of 30+ nights to attract the 21.1% of the market seeking extended stays.
- Adjust minimum nights based on seasonality – potentially shorter during low season and longer during peak demand periods in Chontabamba.
Chontabamba Airbnb Cancellation Policy Trends Analysis (2026)
Super Strict 60 Days
1 listings
1.3% of total
Super Strict 30 Days
5 listings
6.6% of total
Flexible
25 listings
32.9% of total
Moderate
20 listings
26.3% of total
Firm
22 listings
28.9% of total
Strict
3 listings
3.9% of total
Cancellation Policy Insights for Chontabamba
- The prevailing Airbnb cancellation policy trend in Chontabamba is Flexible, used by 32.9% of listings.
- There's a relatively balanced mix between guest-friendly (59.2%) and stricter (32.8%) policies, offering choices for different guest needs.
- Strict cancellation policies are quite rare (3.9%), potentially making listings with this policy less competitive unless justified by high demand or property type.
Recommendations for Hosts
- Consider adopting a Flexible policy to align with the 32.9% market standard in Chontabamba.
- Using a Strict policy might deter some guests, as only 3.9% of listings use it. Evaluate if potential revenue protection outweighs possible lower booking rates.
- Regularly review your cancellation policy against competitors and market demand shifts in Chontabamba.
Chontabamba STR Booking Lead Time Analysis (2026)
Average Booking Lead Time by Month
Booking Lead Time Insights for Chontabamba
- The overall average booking lead time for vacation rentals in Chontabamba is 29 days.
- Guests book furthest in advance for stays during July (average 44 days), likely coinciding with peak travel demand or local events.
- The shortest booking windows occur for stays in June (average 9 days), indicating more last-minute travel plans during this time.
- Seasonally, Spring (25 days avg.) sees the longest lead times, while Fall (21 days avg.) has the shortest, reflecting typical travel planning cycles.
Recommendations for Hosts
- Use the overall average lead time (29 days) as a baseline for your pricing and availability strategy in Chontabamba.
- For July stays, consider implementing length-of-stay discounts or slightly higher rates for bookings made less than 44 days out to capitalize on advance planning.
- During June, focus on last-minute booking availability and promotions, as guests book with very short notice (9 days avg.).
- Target marketing efforts for the Spring season well in advance (at least 25 days) to capture early planners.
- Monitor your own booking lead times against these Chontabamba averages to identify opportunities for dynamic pricing adjustments.
Popular & Essential Airbnb Amenities in Chontabamba (2026)
Amenity Prevalence
Amenity Insights for Chontabamba
- Essential amenities in Chontabamba that guests expect include: Free parking on premises. Lacking these (this) could significantly impact bookings.
- Popular amenities like Wifi, Hot water, TV are common but not universal. Offering these can provide a competitive edge.
- Warning: Wifi is not universally provided but is considered essential globally. Ensure reliable Wifi is offered.
Recommendations for Hosts
- Ensure your listing includes all essential amenities for Chontabamba: Free parking on premises.
- Prioritize adding missing essentials: Free parking on premises.
- Consider adding popular differentiators like Wifi or Hot water to increase appeal.
- Highlight unique or less common amenities you offer (e.g., hot tub, dedicated workspace, EV charger) in your listing description and photos.
- Regularly check competitor amenities in Chontabamba to stay competitive.
Chontabamba Airbnb Guest Demographics & Profile Analysis (2026)
Guest Profile Summary for Chontabamba
- The typical guest profile for Airbnb in Chontabamba consists of primarily domestic travelers (86%), often arriving from nearby Lima, typically belonging to the Post-2000s (Gen Z/Alpha) group (50%), primarily speaking Spanish or English.
- Domestic travelers account for 85.7% of guests.
- Key international markets include Peru (85.7%) and United States (5.7%).
- Top languages spoken are Spanish (50.6%) followed by English (35.3%).
- A significant demographic segment is the Post-2000s (Gen Z/Alpha) group, representing 50% of guests.
Recommendations for Hosts
- Target domestic marketing efforts towards travelers from Lima and Lima Region.
- Tailor amenities and listing descriptions to appeal to the dominant Post-2000s (Gen Z/Alpha) demographic (e.g., highlight fast WiFi, smart home features, local guides).
- Highlight unique local experiences or amenities relevant to the primary guest profile.
- Consider seasonal promotions aligned with peak travel times for key origin markets.
Nearby Short-Term Rental Market Comparison
How does the Chontabamba Airbnb market stack up against its neighbors? Compare key performance metrics like average monthly revenue, ADR, and occupancy rates in surrounding areas to understand the broader regional STR landscape.
| Market | Active Properties | Monthly Revenue | Daily Rate | Avg. Occupancy |
|---|---|---|---|---|
| Ricardo Palma | 12 | $1,262 | $265.85 | 24% |
| Santa Eulalia | 42 | $821 | $192.27 | 20% |
| Santa Rosa de Quives | 30 | $488 | $178.72 | 15% |
| Huancabamba | 41 | $436 | $100.39 | 22% |
| Santa Cruz de Cocachacra | 12 | $426 | $166.30 | 16% |
| San Ramón | 34 | $246 | $96.35 | 14% |
| Oxapampa | 273 | $230 | $64.90 | 22% |
| Rupa-Rupa | 46 | $169 | $43.52 | 20% |
| Amarilis | 25 | $142 | $33.69 | 23% |
| Huánuco | 38 | $128 | $30.58 | 23% |