Tambopata Airbnb Market Analysis 2026: Short Term Rental Data & Vacation Rental Statistics in Madre de Dios, Peru
Is Airbnb profitable in Tambopata in 2026? Explore comprehensive Airbnb analytics for Tambopata, Madre de Dios, Peru to uncover income potential. This 2026 STR market report for Tambopata, based on AirROI data from February 2025 to January 2026, reveals key trends in the niche market of 58 active listings.
Whether you're considering an Airbnb investment in Tambopata, optimizing your existing vacation rental, or exploring rental arbitrage opportunities, understanding the Tambopata Airbnb data is crucial. Leveraging the low regulation environment is key to maximizing your short term rental income potential. Let's dive into the specifics.
Key Tambopata Airbnb Performance Metrics Overview
Monthly Airbnb Revenue Variations & Income Potential in Tambopata (2026)
Understanding the monthly revenue variations for Airbnb listings in Tambopata is key to maximizing your short term rental income potential. Seasonality significantly impacts earnings. Our analysis, based on data from the past 12 months, shows that the peak revenue month for STRs in Tambopata is typically July, while June often presents the lowest earnings, highlighting opportunities for strategic pricing adjustments during shoulder and low seasons. Explore the typical Airbnb income in Tambopata across different performance tiers:
- Best-in-class properties (Top 10%) achieve $1,010+ monthly, often utilizing dynamic pricing and superior guest experiences.
- Strong performing properties (Top 25%) earn $541 or more, indicating effective management and desirable locations/amenities.
- Typical properties (Median) generate around $235 per month, representing the average market performance.
- Entry-level properties (Bottom 25%) see earnings around $80, often with potential for optimization.
Average Monthly Airbnb Earnings Trend in Tambopata
Tambopata Airbnb Occupancy Rate Trends (2026)
Maximize your bookings by understanding the Tambopata STR occupancy trends. Seasonal demand shifts significantly influence how often properties are booked. Typically, Februarysees the highest demand (peak season occupancy), while June experiences the lowest (low season). Effective strategies, like adjusting minimum stays or offering promotions, can boost occupancy during slower periods. Here's how different property tiers perform in Tambopata:
- Best-in-class properties (Top 10%) achieve 56%+ occupancy, indicating high desirability and potentially optimized availability.
- Strong performing properties (Top 25%) maintain 36% or higher occupancy, suggesting good market fit and guest satisfaction.
- Typical properties (Median) have an occupancy rate around 19%.
- Entry-level properties (Bottom 25%) average 9% occupancy, potentially facing higher vacancy.
Average Monthly Occupancy Rate Trend in Tambopata
Average Daily Rate (ADR) Airbnb Trends in Tambopata (2026)
Effective short term rental pricing strategy in Tambopata involves understanding monthly ADR fluctuations. The Average Daily Rate (ADR) for Airbnb in Tambopata typically peaks in January and dips lowest during March. Leveraging Airbnb dynamic pricing tools or strategies based on this seasonality can significantly boost revenue. Here's a look at the typical nightly rates achieved:
- Best-in-class properties (Top 10%) command rates of $88+ per night, often due to premium features or locations.
- Strong performing properties (Top 25%) achieve nightly rates of $56 or more.
- Typical properties (Median) charge around $36 per night.
- Entry-level properties (Bottom 25%) earn around $23 per night.
Average Daily Rate (ADR) Trend by Month in Tambopata
Get Live Tambopata Market Intelligence 👇

Explore Real-time Analytics
Airbnb Seasonality Analysis & Trends in Tambopata (2026)
Peak Season (July, October, September)
- Revenue averages $489 per month
- Occupancy rates average 26.9%
- Daily rates average $45
Shoulder Season
- Revenue averages $406 per month
- Occupancy maintains around 27.3%
- Daily rates hold near $44
Low Season (January, April, June)
- Revenue drops to average $343 per month
- Occupancy decreases to average 19.5%
- Daily rates adjust to average $44
Seasonality Insights for Tambopata
- The Airbnb seasonality in Tambopata shows moderate seasonality with distinct peak and low periods. While the sections above show seasonal averages, it's also insightful to look at the extremes:
- During the high season, the absolute peak month showcases Tambopata's highest earning potential, with monthly revenues capable of climbing to $530, occupancy reaching a high of 32.8%, and ADRs peaking at $46.
- Conversely, the slowest single month of the year, typically falling within the low season, marks the market's lowest point. In this month, revenue might dip to $335, occupancy could drop to 16.1%, and ADRs may adjust down to $43.
- Understanding both the seasonal averages and these monthly peaks and troughs in revenue, occupancy, and ADR is crucial for maximizing your Airbnb profit potential in Tambopata.
Seasonal Strategies for Maximizing Profit
- Peak Season: Maximize revenue through premium pricing and potentially longer minimum stays. Ensure high availability.
- Low Season: Offer competitive pricing, special promotions (e.g., extended stay discounts), and flexible cancellation policies. Target off-season travelers like remote workers or budget-conscious guests.
- Shoulder Seasons: Implement dynamic pricing that balances peak and low rates. Target weekend travelers or specific events. Offer slightly more flexible terms than peak season.
- Regularly analyze your own performance against these Tambopata seasonality benchmarks and adjust your pricing and availability strategy accordingly.
Best Areas for Airbnb Investment in Tambopata (2026)
Exploring the top neighborhoods for short-term rentals in Tambopata? This section highlights key areas, outlining why they are attractive for hosts and guests, along with notable local attractions. Consider these locations based on your target guest profile and investment strategy.
| Neighborhood / Area | Why Host Here? (Target Guests & Appeal) | Key Attractions & Landmarks |
|---|---|---|
| Puerto Maldonado | As the capital of Madre de Dios, Puerto Maldonado is the main gateway to the Amazon rainforest, making it a strategic location for eco-tourism and adventure seekers. It offers access to various nature reserves and cultural experiences with local communities. | Tambopata National Reserve, Bahuaja-Sonene National Park, Sandoval Lake, Amazon Eco-Discoveries, Cultural experiences with local tribes |
| Tambopata National Reserve | This protected area is renowned for its rich biodiversity, attracting tourists interested in wildlife, birdwatching, and eco-tourism. Investing in properties here appeals to travelers seeking unique nature experiences. | Wildlife watching, Birdwatching tours, Amazon rainforest hiking, Canopy zip-line adventures, Research and conservation programs |
| Cuzco | Although not in Tambopata directly, Cuzco serves as an important hub for travelers visiting the Amazon. It's a UNESCO World Heritage site, famous for Incan history, and is a significant stopping point for Amazon tours. | Sacsayhuamán, Machu Picchu, Qorikancha, Plaza de Armas, Sacred Valley tours |
| Inambari | Located near Puerto Maldonado, Inambari offers a quieter, rural experience with direct access to the rainforest and local Peruvian culture. It's ideal for those seeking a more tranquil setting. | Local community experiences, Wildlife spotting, River tours, Hiking opportunities, Tranquil natural settings |
| Madre de Dios River | The river area is popular for its picturesque views and adventure activities, such as river rafting and fishing. It's a charming area for tourists looking for water-based activities in the Amazon. | Rafting tours, Fishing expeditions, Scenic boat rides, Wildlife encounters, Camping along the river |
| Amazon River | This area offers some of the most incredible views and experiences in the Amazon rainforest, attracting tourists eager to experience the natural beauty of the region. Perfect for airbnbs focused on immersion in nature. | Boat tours, Fishing, Canoeing, Wildlife watching, Relaxing in nature |
| Colpa de Guacamayos | This clay lick is a popular spot for birdwatchers, especially for observing macaws. It offers unique experiences that attract tourists and nature lovers interested in wildlife. | Bird watching, Photography, Guided tours, Wildlife observation, Cultural interactions |
| Oxbow Lake | A beautiful natural formation, Oxbow Lake attracts visitors interested in fishing, bird watching, and enjoying the serene environment of the rainforest. It's an excellent location for nature-based tourism. | Fishing, Kayaking, Wildlife photography, Bird watching, Nature trails |
Understanding Airbnb License Requirements & STR Laws in Tambopata (2026)
While Tambopata, Madre de Dios, Peru currently shows low STR regulations, specific Airbnb license requirements might still exist or change. Always verify the latest short term rental regulations and Airbnb license requirements directly with local government authorities for Tambopata to ensure full compliance before hosting.
(Source: AirROI data, 2026, finding no licensed listings among those analyzed)
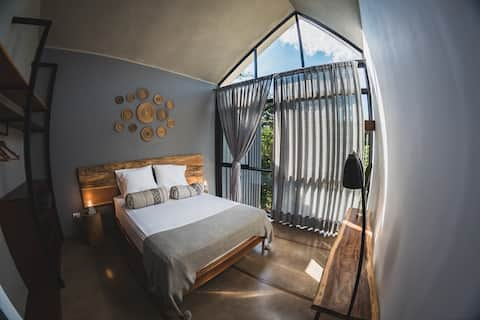
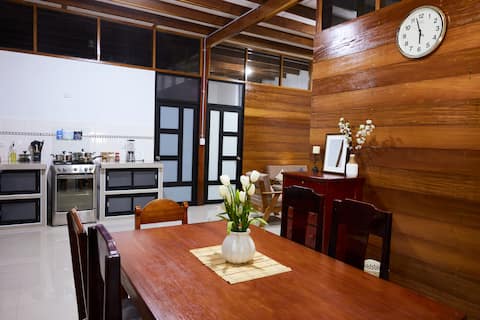
Top Performing Airbnb Properties in Tambopata (2026)
Benchmark your potential! Explore examples of top-performing Airbnb properties in Tambopatabased on Trailing Twelve Month (TTM) revenue. Analyze their characteristics, revenue, occupancy rate, and ADR to understand what drives success in this market.

Chomi House Tambopata
Entire Place • N/A

Full house, bright
Entire Place • 3 bedrooms

Don Jaime Hostel, Bungalows overlooking the river
Private Room • 1 bedroom
ENAI, Habitacion Penthouse Matrimonial (3E)
Private Room • 1 bedroom

Eco-lodge
Entire Place • 2 bedrooms
Spacious Relaxing Amazon House with Garage
Entire Place • 3 bedrooms
Note: Performance varies based on location, size, amenities, seasonality, and management quality. Data reflects the past 12 months.
Top Performing Airbnb Hosts in Tambopata (2026)
Learn from the best! This table showcases top-performing Airbnb hosts in Tambopata based on the number of properties managed and estimated total revenue over the past year. Analyze their scale and performance metrics.
| Host Name | Properties | Grossing Revenue | Stay Reviews | Avg Rating |
|---|---|---|---|---|
| Elmer | 1 | $24,451 | 42 | 4.98/5.0 |
| Jaime | 4 | $18,325 | 112 | 4.91/5.0 |
| Belen | 2 | $14,652 | 14 | 5.00/5.0 |
| Yessica | 1 | $11,836 | 32 | 4.78/5.0 |
| Robertho Miguel | 2 | $9,822 | 30 | 4.90/5.0 |
| Fiorela | 4 | $9,513 | 69 | 4.90/5.0 |
| Pedro | 1 | $9,027 | 3 | 4.67/5.0 |
| Abraham | 2 | $7,641 | 47 | 4.85/5.0 |
| Makasai | 5 | $6,916 | 95 | 4.39/5.0 |
| Anthony | 3 | $6,224 | 143 | 4.87/5.0 |
Analyzing the strategies of top hosts, such as their property selection, pricing, and guest communication, can offer valuable lessons for optimizing your own Airbnb operations in Tambopata.
Dive Deeper: Advanced Tambopata STR Market Data (2026)
Ready to unlock more insights? AirROI provides access to advanced metrics and comprehensive Airbnb data for Tambopata. Explore detailed analytics beyond this report to refine your investment strategy, optimize pricing, and maximize your vacation rental profits.
Explore Advanced MetricsTambopata Short-Term Rental Market Composition (2026): Property & Room Types
Room Type Distribution
Property Type Distribution
Market Composition Insights for Tambopata
- The Tambopata Airbnb market composition is heavily skewed towards Private Room listings, which make up 65.5% of the 58 active rentals. This indicates strong guest preference for privacy and space.
- Looking at the property type distribution in Tambopata, House properties are the most common (29.3%), reflecting the local real estate landscape.
- Houses represent a significant 29.3% portion, catering likely to families or larger groups.
- The presence of 24.1% Hotel/Boutique listings indicates integration with traditional hospitality.
- Smaller segments like others, unique stays (combined 5.1%) offer potential for unique stay experiences.
Tambopata Airbnb Room Capacity Analysis (2026): Bedroom Distribution
Distribution of Listings by Number of Bedrooms
Room Capacity Insights for Tambopata
- The dominant room capacity in Tambopata is 1 bedroom listings, making up 37.9% of the market. This suggests a strong demand for properties suitable for couples or solo travelers.
- Together, 1 bedroom and 3 bedrooms properties represent 56.9% of the active Airbnb listings in Tambopata, indicating a high concentration in these sizes.
- A significant 27.6% of listings offer 3+ bedrooms, catering to larger groups and families seeking more space in Tambopata.
Tambopata Vacation Rental Guest Capacity Trends (2026)
Distribution of Listings by Guest Capacity
Guest Capacity Insights for Tambopata
- The most common guest capacity trend in Tambopata vacation rentals is listings accommodating 2 guests (24.1%). This suggests the primary traveler segment is likely couples or solo travelers.
- Properties designed for 2 guests and 3 guests dominate the Tambopata STR market, accounting for 37.9% of listings.
- 20.6% of properties accommodate 6+ guests, serving the market segment for larger families or group travel in Tambopata.
- On average, properties in Tambopata are equipped to host 2.8 guests.
Tambopata Airbnb Booking Patterns (2026): Available vs. Booked Days
Available Days Distribution
Booked Days Distribution
Booking Pattern Insights for Tambopata
- The most common availability pattern in Tambopata falls within the 271-366 days range, representing 86.2% of listings. This suggests many properties have significant open periods on their calendars.
- Approximately 98.3% of listings show high availability (181+ days open annually), indicating potential for increased bookings or specific owner usage patterns.
- For booked days, the 31-90 days range is most frequent in Tambopata (46.6%), reflecting common guest stay durations or potential owner blocking patterns.
- A notable 1.7% of properties secure long booking periods (181+ days booked per year), highlighting successful long-term rental strategies or significant owner usage.
Tambopata Airbnb Minimum Stay Requirements Analysis
Distribution of Listings by Minimum Night Requirement
1 Night
46 listings
79.3% of total
2 Nights
5 listings
8.6% of total
3 Nights
3 listings
5.2% of total
4-6 Nights
2 listings
3.4% of total
30+ Nights
2 listings
3.4% of total
Key Insights
- The most prevalent minimum stay requirement in Tambopata is 1 Night, adopted by 79.3% of listings. This highlights the market's preference for shorter, flexible bookings.
- A strong majority (87.9%) of the Tambopata Airbnb data shows acceptance of very short stays (1-2 nights), indicating a dynamic, high-turnover market.
Recommendations
- Align with the market by considering a 1 Night minimum stay, as 79.3% of Tambopata hosts use this setting.
- Adjust minimum nights based on seasonality – potentially shorter during low season and longer during peak demand periods in Tambopata.
Tambopata Airbnb Cancellation Policy Trends Analysis (2026)
Flexible
34 listings
58.6% of total
Moderate
14 listings
24.1% of total
Firm
4 listings
6.9% of total
Strict
6 listings
10.3% of total
Cancellation Policy Insights for Tambopata
- The prevailing Airbnb cancellation policy trend in Tambopata is Flexible, used by 58.6% of listings.
- The market strongly favors guest-friendly terms, with 82.7% of listings offering Flexible or Moderate policies. This suggests guests in Tambopata may expect booking flexibility.
Recommendations for Hosts
- Consider adopting a Flexible policy to align with the 58.6% market standard in Tambopata.
- Given the high prevalence of Flexible policies (58.6%), offering this can enhance booking appeal, especially during shoulder seasons.
- Using a Strict policy might deter some guests, as only 10.3% of listings use it. Evaluate if potential revenue protection outweighs possible lower booking rates.
- Regularly review your cancellation policy against competitors and market demand shifts in Tambopata.
Tambopata STR Booking Lead Time Analysis (2026)
Average Booking Lead Time by Month
Booking Lead Time Insights for Tambopata
- The overall average booking lead time for vacation rentals in Tambopata is 31 days.
- Guests book furthest in advance for stays during November (average 60 days), likely coinciding with peak travel demand or local events.
- The shortest booking windows occur for stays in March (average 17 days), indicating more last-minute travel plans during this time.
- Seasonally, Fall (48 days avg.) sees the longest lead times, while Winter (23 days avg.) has the shortest, reflecting typical travel planning cycles.
Recommendations for Hosts
- Use the overall average lead time (31 days) as a baseline for your pricing and availability strategy in Tambopata.
- For November stays, consider implementing length-of-stay discounts or slightly higher rates for bookings made less than 60 days out to capitalize on advance planning.
- Target marketing efforts for the Fall season well in advance (at least 48 days) to capture early planners.
- Monitor your own booking lead times against these Tambopata averages to identify opportunities for dynamic pricing adjustments.
Popular & Essential Airbnb Amenities in Tambopata (2026)
Amenity Prevalence
Amenity Insights for Tambopata
- Popular amenities like Wifi, Free parking on premises, First aid kit are common but not universal. Offering these can provide a competitive edge.
- Warning: Wifi is not universally provided but is considered essential globally. Ensure reliable Wifi is offered.
Recommendations for Hosts
- Consider adding popular differentiators like Wifi or Free parking on premises to increase appeal.
- Highlight unique or less common amenities you offer (e.g., hot tub, dedicated workspace, EV charger) in your listing description and photos.
- Regularly check competitor amenities in Tambopata to stay competitive.
Tambopata Airbnb Guest Demographics & Profile Analysis (2026)
Guest Profile Summary for Tambopata
- The typical guest profile for Airbnb in Tambopata consists of predominantly international visitors (80%), with top international origins including Peru, typically belonging to the Post-2000s (Gen Z/Alpha) group (50%), primarily speaking English or Spanish.
- Domestic travelers account for 19.6% of guests.
- Key international markets include United States (24.5%) and Peru (19.6%).
- Top languages spoken are English (41.2%) followed by Spanish (23%).
- A significant demographic segment is the Post-2000s (Gen Z/Alpha) group, representing 50% of guests.
Recommendations for Hosts
- Focus marketing internationally, particularly towards travelers from Peru.
- Tailor amenities and listing descriptions to appeal to the dominant Post-2000s (Gen Z/Alpha) demographic (e.g., highlight fast WiFi, smart home features, local guides).
- Highlight unique local experiences or amenities relevant to the primary guest profile.
- Consider seasonal promotions aligned with peak travel times for key origin markets.