Santa Eulalia Airbnb Market Analysis 2026: Short Term Rental Data & Vacation Rental Statistics in Lima, Peru
Is Airbnb profitable in Santa Eulalia in 2026? Explore comprehensive Airbnb analytics for Santa Eulalia, Lima, Peru to uncover income potential. This 2026 STR market report for Santa Eulalia, based on AirROI data from February 2025 to January 2026, reveals key trends in the niche market of 42 active listings.
Whether you're considering an Airbnb investment in Santa Eulalia, optimizing your existing vacation rental, or exploring rental arbitrage opportunities, understanding the Santa Eulalia Airbnb data is crucial. Leveraging the low regulation environment is key to maximizing your short term rental income potential. Let's dive into the specifics.
Key Santa Eulalia Airbnb Performance Metrics Overview
Monthly Airbnb Revenue Variations & Income Potential in Santa Eulalia (2026)
Understanding the monthly revenue variations for Airbnb listings in Santa Eulalia is key to maximizing your short term rental income potential. Seasonality significantly impacts earnings. Our analysis, based on data from the past 12 months, shows that the peak revenue month for STRs in Santa Eulalia is typically July, while November often presents the lowest earnings, highlighting opportunities for strategic pricing adjustments during shoulder and low seasons. Explore the typical Airbnb income in Santa Eulalia across different performance tiers:
- Best-in-class properties (Top 10%) achieve $2,582+ monthly, often utilizing dynamic pricing and superior guest experiences.
- Strong performing properties (Top 25%) earn $1,525 or more, indicating effective management and desirable locations/amenities.
- Typical properties (Median) generate around $805 per month, representing the average market performance.
- Entry-level properties (Bottom 25%) see earnings around $396, often with potential for optimization.
Average Monthly Airbnb Earnings Trend in Santa Eulalia
Santa Eulalia Airbnb Occupancy Rate Trends (2026)
Maximize your bookings by understanding the Santa Eulalia STR occupancy trends. Seasonal demand shifts significantly influence how often properties are booked. Typically, Februarysees the highest demand (peak season occupancy), while November experiences the lowest (low season). Effective strategies, like adjusting minimum stays or offering promotions, can boost occupancy during slower periods. Here's how different property tiers perform in Santa Eulalia:
- Best-in-class properties (Top 10%) achieve 49%+ occupancy, indicating high desirability and potentially optimized availability.
- Strong performing properties (Top 25%) maintain 29% or higher occupancy, suggesting good market fit and guest satisfaction.
- Typical properties (Median) have an occupancy rate around 16%.
- Entry-level properties (Bottom 25%) average 10% occupancy, potentially facing higher vacancy.
Average Monthly Occupancy Rate Trend in Santa Eulalia
Average Daily Rate (ADR) Airbnb Trends in Santa Eulalia (2026)
Effective short term rental pricing strategy in Santa Eulalia involves understanding monthly ADR fluctuations. The Average Daily Rate (ADR) for Airbnb in Santa Eulalia typically peaks in December and dips lowest during March. Leveraging Airbnb dynamic pricing tools or strategies based on this seasonality can significantly boost revenue. Here's a look at the typical nightly rates achieved:
- Best-in-class properties (Top 10%) command rates of $322+ per night, often due to premium features or locations.
- Strong performing properties (Top 25%) achieve nightly rates of $262 or more.
- Typical properties (Median) charge around $190 per night.
- Entry-level properties (Bottom 25%) earn around $115 per night.
Average Daily Rate (ADR) Trend by Month in Santa Eulalia
Get Live Santa Eulalia Market Intelligence 👇

Explore Real-time Analytics
Airbnb Seasonality Analysis & Trends in Santa Eulalia (2026)
Peak Season (July, April, February)
- Revenue averages $1,415 per month
- Occupancy rates average 27.5%
- Daily rates average $185
Shoulder Season
- Revenue averages $1,118 per month
- Occupancy maintains around 22.2%
- Daily rates hold near $192
Low Season (June, August, November)
- Revenue drops to average $833 per month
- Occupancy decreases to average 17.0%
- Daily rates adjust to average $191
Seasonality Insights for Santa Eulalia
- The Airbnb seasonality in Santa Eulalia shows highly seasonal trends requiring careful strategy. While the sections above show seasonal averages, it's also insightful to look at the extremes:
- During the high season, the absolute peak month showcases Santa Eulalia's highest earning potential, with monthly revenues capable of climbing to $1,679, occupancy reaching a high of 29.4%, and ADRs peaking at $198.
- Conversely, the slowest single month of the year, typically falling within the low season, marks the market's lowest point. In this month, revenue might dip to $661, occupancy could drop to 13.2%, and ADRs may adjust down to $181.
- Understanding both the seasonal averages and these monthly peaks and troughs in revenue, occupancy, and ADR is crucial for maximizing your Airbnb profit potential in Santa Eulalia.
Seasonal Strategies for Maximizing Profit
- Peak Season: Maximize revenue through premium pricing and potentially longer minimum stays. Ensure high availability.
- Low Season: Offer competitive pricing, special promotions (e.g., extended stay discounts), and flexible cancellation policies. Target off-season travelers like remote workers or budget-conscious guests.
- Shoulder Seasons: Implement dynamic pricing that balances peak and low rates. Target weekend travelers or specific events. Offer slightly more flexible terms than peak season.
- Regularly analyze your own performance against these Santa Eulalia seasonality benchmarks and adjust your pricing and availability strategy accordingly.
Best Areas for Airbnb Investment in Santa Eulalia (2026)
Exploring the top neighborhoods for short-term rentals in Santa Eulalia? This section highlights key areas, outlining why they are attractive for hosts and guests, along with notable local attractions. Consider these locations based on your target guest profile and investment strategy.
| Neighborhood / Area | Why Host Here? (Target Guests & Appeal) | Key Attractions & Landmarks |
|---|---|---|
| Las Flores | A vibrant district known for its beaches and bustling nightlife, attracting both domestic and international tourists looking for a lively atmosphere. | Las Flores Beach, Clube Social, Shopping Plaza Lima, Del Mar Park, El Malecón |
| La Marina | This area features picturesque coastlines and modern amenities, ideal for travelers seeking a relaxed beach experience with access to various activities. | La Marina Beach, El Salto del Fraile, Club Regatas Lima, Marina Park, Local seafood restaurants |
| Santa María del Mar | A favored spot for families and beach lovers, offering a more tranquil environment while still providing essential services and beautiful seaside views. | Santa María Beach, Marina Club, Coastal Walkways, Shopping Centers, Local Markets |
| Club Golf Los Incas | A secluded area known for its golf courses and upscale residences, popular among affluent travelers looking for leisure and luxury experiences. | Golf Course, Country Club, Spa and Wellness Centers, Exclusive Restaurants, Scenic Views |
| Chorrillos | A historic district with stunning cliffs and ocean views, drawing visitors interested in culture and scenic environments. | Morro Solar, El Salto del Fraile, Historical Temples, Local Art Galleries, Chorrillos Beach |
| Pueblo Libre | Rich in history, this area attracts tourists seeking cultural experiences with museums and local markets nearby. | Larco Museum, National Museum of Archaeology, Local Cuisine, Artisan Markets, Historical Landmarks |
| Barranco | Considered Lima's artsy district, filled with colorful streets, artistic vibes, and vibrant nightlife, making it popular with younger travelers and artists. | Bridge of Sighs, Museo de Arte de Lima, Local Art Scene, Cafés and Bars, Barranco Beach |
| Miraflores | A prime area for tourists, known for its upscale amenities, parks, and beautiful coastlines, making it one of the most sought-after locations for Airbnb investment. | Parque Kennedy, Larcomar Shopping Center, Malecón de Miraflores, Beaches, Restaurants and Nightlife |
Understanding Airbnb License Requirements & STR Laws in Santa Eulalia (2026)
While Santa Eulalia, Lima, Peru currently shows low STR regulations, specific Airbnb license requirements might still exist or change. Always verify the latest short term rental regulations and Airbnb license requirements directly with local government authorities for Santa Eulalia to ensure full compliance before hosting.
(Source: AirROI data, 2026, finding no licensed listings among those analyzed)
Top Performing Airbnb Properties in Santa Eulalia (2026)
Benchmark your potential! Explore examples of top-performing Airbnb properties in Santa Eulaliabased on Trailing Twelve Month (TTM) revenue. Analyze their characteristics, revenue, occupancy rate, and ADR to understand what drives success in this market.
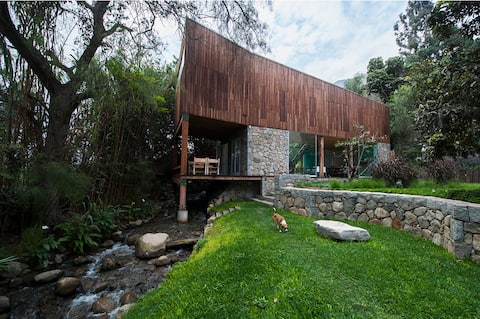
architect's cottage in Santa Eulalia
Entire Place • 6 bedrooms
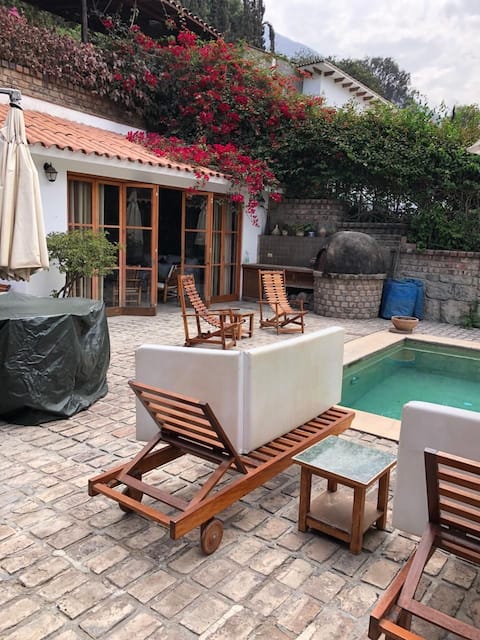
Charming Country Break in Santa Eulalia
Entire Place • 4 bedrooms
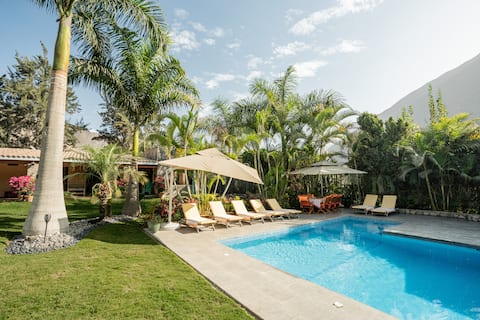
Chaparral country house with pool, Santa Eulalia
Entire Place • 6 bedrooms

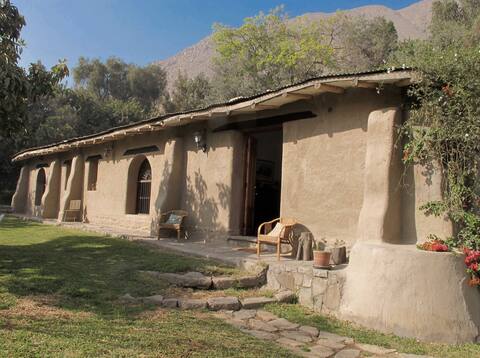
A cozy country house in Santa Eulalia
Entire Place • 4 bedrooms
Country house with pool and garden Santa Eulalia
Entire Place • 2 bedrooms
Adventure and countryside in the Sierra de Lima in Huachinga
Entire Place • 5 bedrooms
Note: Performance varies based on location, size, amenities, seasonality, and management quality. Data reflects the past 12 months.
Top Performing Airbnb Hosts in Santa Eulalia (2026)
Learn from the best! This table showcases top-performing Airbnb hosts in Santa Eulalia based on the number of properties managed and estimated total revenue over the past year. Analyze their scale and performance metrics.
| Host Name | Properties | Grossing Revenue | Stay Reviews | Avg Rating |
|---|---|---|---|---|
| Lie | 7 | $45,119 | 266 | 4.83/5.0 |
| Jessica | 2 | $34,441 | 35 | 5.00/5.0 |
| Susel | 1 | $28,396 | 100 | 4.95/5.0 |
| Cata | 1 | $28,351 | 11 | 5.00/5.0 |
| Mariana | 1 | $23,641 | 119 | 4.82/5.0 |
| Jeannine | 1 | $22,573 | 101 | 4.93/5.0 |
| Mariana | 1 | $22,442 | 23 | 5.00/5.0 |
| Gian Franco | 1 | $21,476 | 8 | 5.00/5.0 |
| Ruth | 2 | $18,822 | 23 | 4.95/5.0 |
| Sandra | 1 | $18,514 | 21 | 4.67/5.0 |
Analyzing the strategies of top hosts, such as their property selection, pricing, and guest communication, can offer valuable lessons for optimizing your own Airbnb operations in Santa Eulalia.
Dive Deeper: Advanced Santa Eulalia STR Market Data (2026)
Ready to unlock more insights? AirROI provides access to advanced metrics and comprehensive Airbnb data for Santa Eulalia. Explore detailed analytics beyond this report to refine your investment strategy, optimize pricing, and maximize your vacation rental profits.
Explore Advanced MetricsSanta Eulalia Short-Term Rental Market Composition (2026): Property & Room Types
Room Type Distribution
Property Type Distribution
Market Composition Insights for Santa Eulalia
- The Santa Eulalia Airbnb market composition is heavily skewed towards Entire Home/Apt listings, which make up 92.9% of the 42 active rentals. This indicates strong guest preference for privacy and space.
- Looking at the property type distribution in Santa Eulalia, House properties are the most common (81%), reflecting the local real estate landscape.
- Houses represent a significant 81% portion, catering likely to families or larger groups.
- Smaller segments like others, apartment/condo (combined 9.6%) offer potential for unique stay experiences.
Santa Eulalia Airbnb Room Capacity Analysis (2026): Bedroom Distribution
Distribution of Listings by Number of Bedrooms
Room Capacity Insights for Santa Eulalia
- The dominant room capacity in Santa Eulalia is 3 bedrooms listings, making up 26.2% of the market. This suggests a strong demand for properties suitable for families or small groups.
- Together, 3 bedrooms and 1 bedroom properties represent 47.6% of the active Airbnb listings in Santa Eulalia, indicating a high concentration in these sizes.
- A significant 61.9% of listings offer 3+ bedrooms, catering to larger groups and families seeking more space in Santa Eulalia.
Santa Eulalia Vacation Rental Guest Capacity Trends (2026)
Distribution of Listings by Guest Capacity
Guest Capacity Insights for Santa Eulalia
- The most common guest capacity trend in Santa Eulalia vacation rentals is listings accommodating 8+ guests (61.9%). This suggests the primary traveler segment is likely larger groups.
- Properties designed for 8+ guests and 2 guests dominate the Santa Eulalia STR market, accounting for 76.2% of listings.
- 71.5% of properties accommodate 6+ guests, serving the market segment for larger families or group travel in Santa Eulalia.
- On average, properties in Santa Eulalia are equipped to host 6.1 guests.
Santa Eulalia Airbnb Booking Patterns (2026): Available vs. Booked Days
Available Days Distribution
Booked Days Distribution
Booking Pattern Insights for Santa Eulalia
- The most common availability pattern in Santa Eulalia falls within the 271-366 days range, representing 81% of listings. This suggests many properties have significant open periods on their calendars.
- Approximately 100.0% of listings show high availability (181+ days open annually), indicating potential for increased bookings or specific owner usage patterns.
- For booked days, the 31-90 days range is most frequent in Santa Eulalia (45.2%), reflecting common guest stay durations or potential owner blocking patterns.
- A notable 2.4% of properties secure long booking periods (181+ days booked per year), highlighting successful long-term rental strategies or significant owner usage.
Santa Eulalia Airbnb Minimum Stay Requirements Analysis
Distribution of Listings by Minimum Night Requirement
1 Night
17 listings
40.5% of total
2 Nights
23 listings
54.8% of total
30+ Nights
2 listings
4.8% of total
Key Insights
- The most prevalent minimum stay requirement in Santa Eulalia is 2 Nights, adopted by 54.8% of listings. This highlights the market's preference for shorter, flexible bookings.
- A strong majority (95.3%) of the Santa Eulalia Airbnb data shows acceptance of very short stays (1-2 nights), indicating a dynamic, high-turnover market.
Recommendations
- Align with the market by considering a 2 Nights minimum stay, as 54.8% of Santa Eulalia hosts use this setting.
- Adjust minimum nights based on seasonality – potentially shorter during low season and longer during peak demand periods in Santa Eulalia.
Santa Eulalia Airbnb Cancellation Policy Trends Analysis (2026)
Flexible
10 listings
23.8% of total
Moderate
10 listings
23.8% of total
Firm
19 listings
45.2% of total
Strict
3 listings
7.1% of total
Cancellation Policy Insights for Santa Eulalia
- The prevailing Airbnb cancellation policy trend in Santa Eulalia is Firm, used by 45.2% of listings.
- A majority (52.3%) of hosts in Santa Eulalia utilize Firm or Strict policies, indicating a market where hosts prioritize booking security.
- Strict cancellation policies are quite rare (7.1%), potentially making listings with this policy less competitive unless justified by high demand or property type.
Recommendations for Hosts
- Consider adopting a Firm policy to align with the 45.2% market standard in Santa Eulalia.
- Using a Strict policy might deter some guests, as only 7.1% of listings use it. Evaluate if potential revenue protection outweighs possible lower booking rates.
- Regularly review your cancellation policy against competitors and market demand shifts in Santa Eulalia.
Santa Eulalia STR Booking Lead Time Analysis (2026)
Average Booking Lead Time by Month
Booking Lead Time Insights for Santa Eulalia
- The overall average booking lead time for vacation rentals in Santa Eulalia is 22 days.
- Guests book furthest in advance for stays during January (average 44 days), likely coinciding with peak travel demand or local events.
- The shortest booking windows occur for stays in March (average 6 days), indicating more last-minute travel plans during this time.
- Seasonally, Winter (28 days avg.) sees the longest lead times, while Spring (13 days avg.) has the shortest, reflecting typical travel planning cycles.
Recommendations for Hosts
- Use the overall average lead time (22 days) as a baseline for your pricing and availability strategy in Santa Eulalia.
- For January stays, consider implementing length-of-stay discounts or slightly higher rates for bookings made less than 44 days out to capitalize on advance planning.
- During March, focus on last-minute booking availability and promotions, as guests book with very short notice (6 days avg.).
- Target marketing efforts for the Winter season well in advance (at least 28 days) to capture early planners.
- Monitor your own booking lead times against these Santa Eulalia averages to identify opportunities for dynamic pricing adjustments.
Popular & Essential Airbnb Amenities in Santa Eulalia (2026)
Amenity Prevalence
Amenity Insights for Santa Eulalia
- Essential amenities in Santa Eulalia that guests expect include: Free parking on premises. Lacking these (this) could significantly impact bookings.
- Popular amenities like Kitchen, Pool, TV are common but not universal. Offering these can provide a competitive edge.
- A pool is a highly desired but not standard amenity, making it a key feature for attracting guests seeking leisure in Santa Eulalia.
- Warning: Wifi is not universally provided but is considered essential globally. Ensure reliable Wifi is offered.
Recommendations for Hosts
- Ensure your listing includes all essential amenities for Santa Eulalia: Free parking on premises.
- Consider adding popular differentiators like Kitchen or Pool to increase appeal.
- Highlight unique or less common amenities you offer (e.g., hot tub, dedicated workspace, EV charger) in your listing description and photos.
- Regularly check competitor amenities in Santa Eulalia to stay competitive.
Santa Eulalia Airbnb Guest Demographics & Profile Analysis (2026)
Guest Profile Summary for Santa Eulalia
- The typical guest profile for Airbnb in Santa Eulalia consists of primarily domestic travelers (80%), often arriving from nearby Lima, typically belonging to the Post-2000s (Gen Z/Alpha) group (50%), primarily speaking Spanish or English.
- Domestic travelers account for 79.7% of guests.
- Key international markets include Peru (79.7%) and United States (6.8%).
- Top languages spoken are Spanish (46.1%) followed by English (36.1%).
- A significant demographic segment is the Post-2000s (Gen Z/Alpha) group, representing 50% of guests.
Recommendations for Hosts
- Target domestic marketing efforts towards travelers from Lima and Lima Region.
- Tailor amenities and listing descriptions to appeal to the dominant Post-2000s (Gen Z/Alpha) demographic (e.g., highlight fast WiFi, smart home features, local guides).
- Highlight unique local experiences or amenities relevant to the primary guest profile.
- Consider seasonal promotions aligned with peak travel times for key origin markets.
Nearby Short-Term Rental Market Comparison
How does the Santa Eulalia Airbnb market stack up against its neighbors? Compare key performance metrics like average monthly revenue, ADR, and occupancy rates in surrounding areas to understand the broader regional STR landscape.
| Market | Active Properties | Monthly Revenue | Daily Rate | Avg. Occupancy |
|---|---|---|---|---|
| Ricardo Palma | 12 | $1,262 | $265.85 | 24% |
| Cieneguilla | 10 | $1,242 | $189.15 | 31% |
| Santa Cruz de Flores | 67 | $901 | $222.02 | 22% |
| San Antonio | 115 | $723 | $204.11 | 24% |
| Mala | 132 | $695 | $201.42 | 21% |
| Quilmaná | 20 | $674 | $211.24 | 16% |
| Asia | 375 | $637 | $198.98 | 21% |
| Cerro Azul | 230 | $570 | $177.22 | 21% |
| Huaral | 21 | $561 | $148.42 | 21% |
| Lima Metropolitan Area | 11,840 | $546 | $66.58 | 39% |