Lunahuaná Airbnb Market Analysis 2026: Short Term Rental Data & Vacation Rental Statistics in Lima, Peru
Is Airbnb profitable in Lunahuaná in 2026? Explore comprehensive Airbnb analytics for Lunahuaná, Lima, Peru to uncover income potential. This 2026 STR market report for Lunahuaná, based on AirROI data from February 2025 to January 2026, reveals key trends in the niche market of 97 active listings.
Whether you're considering an Airbnb investment in Lunahuaná, optimizing your existing vacation rental, or exploring rental arbitrage opportunities, understanding the Lunahuaná Airbnb data is crucial. Leveraging the low regulation environment is key to maximizing your short term rental income potential. Let's dive into the specifics.
Key Lunahuaná Airbnb Performance Metrics Overview
Monthly Airbnb Revenue Variations & Income Potential in Lunahuaná (2026)
Understanding the monthly revenue variations for Airbnb listings in Lunahuaná is key to maximizing your short term rental income potential. Seasonality significantly impacts earnings. Our analysis, based on data from the past 12 months, shows that the peak revenue month for STRs in Lunahuaná is typically December, while May often presents the lowest earnings, highlighting opportunities for strategic pricing adjustments during shoulder and low seasons. Explore the typical Airbnb income in Lunahuaná across different performance tiers:
- Best-in-class properties (Top 10%) achieve $2,082+ monthly, often utilizing dynamic pricing and superior guest experiences.
- Strong performing properties (Top 25%) earn $1,193 or more, indicating effective management and desirable locations/amenities.
- Typical properties (Median) generate around $508 per month, representing the average market performance.
- Entry-level properties (Bottom 25%) see earnings around $212, often with potential for optimization.
Average Monthly Airbnb Earnings Trend in Lunahuaná
Lunahuaná Airbnb Occupancy Rate Trends (2026)
Maximize your bookings by understanding the Lunahuaná STR occupancy trends. Seasonal demand shifts significantly influence how often properties are booked. Typically, Februarysees the highest demand (peak season occupancy), while May experiences the lowest (low season). Effective strategies, like adjusting minimum stays or offering promotions, can boost occupancy during slower periods. Here's how different property tiers perform in Lunahuaná:
- Best-in-class properties (Top 10%) achieve 38%+ occupancy, indicating high desirability and potentially optimized availability.
- Strong performing properties (Top 25%) maintain 23% or higher occupancy, suggesting good market fit and guest satisfaction.
- Typical properties (Median) have an occupancy rate around 13%.
- Entry-level properties (Bottom 25%) average 7% occupancy, potentially facing higher vacancy.
Average Monthly Occupancy Rate Trend in Lunahuaná
Average Daily Rate (ADR) Airbnb Trends in Lunahuaná (2026)
Effective short term rental pricing strategy in Lunahuaná involves understanding monthly ADR fluctuations. The Average Daily Rate (ADR) for Airbnb in Lunahuaná typically peaks in December and dips lowest during March. Leveraging Airbnb dynamic pricing tools or strategies based on this seasonality can significantly boost revenue. Here's a look at the typical nightly rates achieved:
- Best-in-class properties (Top 10%) command rates of $249+ per night, often due to premium features or locations.
- Strong performing properties (Top 25%) achieve nightly rates of $181 or more.
- Typical properties (Median) charge around $127 per night.
- Entry-level properties (Bottom 25%) earn around $61 per night.
Average Daily Rate (ADR) Trend by Month in Lunahuaná
Get Live Lunahuaná Market Intelligence 👇

Explore Real-time Analytics
Airbnb Seasonality Analysis & Trends in Lunahuaná (2026)
Peak Season (December, August, February)
- Revenue averages $1,077 per month
- Occupancy rates average 22.6%
- Daily rates average $135
Shoulder Season
- Revenue averages $845 per month
- Occupancy maintains around 17.7%
- Daily rates hold near $134
Low Season (May, September, November)
- Revenue drops to average $625 per month
- Occupancy decreases to average 12.7%
- Daily rates adjust to average $135
Seasonality Insights for Lunahuaná
- The Airbnb seasonality in Lunahuaná shows moderate seasonality with distinct peak and low periods. While the sections above show seasonal averages, it's also insightful to look at the extremes:
- During the high season, the absolute peak month showcases Lunahuaná's highest earning potential, with monthly revenues capable of climbing to $1,115, occupancy reaching a high of 24.1%, and ADRs peaking at $144.
- Conversely, the slowest single month of the year, typically falling within the low season, marks the market's lowest point. In this month, revenue might dip to $585, occupancy could drop to 11.7%, and ADRs may adjust down to $128.
- Understanding both the seasonal averages and these monthly peaks and troughs in revenue, occupancy, and ADR is crucial for maximizing your Airbnb profit potential in Lunahuaná.
Seasonal Strategies for Maximizing Profit
- Peak Season: Maximize revenue through premium pricing and potentially longer minimum stays. Ensure high availability.
- Low Season: Offer competitive pricing, special promotions (e.g., extended stay discounts), and flexible cancellation policies. Target off-season travelers like remote workers or budget-conscious guests.
- Shoulder Seasons: Implement dynamic pricing that balances peak and low rates. Target weekend travelers or specific events. Offer slightly more flexible terms than peak season.
- Regularly analyze your own performance against these Lunahuaná seasonality benchmarks and adjust your pricing and availability strategy accordingly.
Best Areas for Airbnb Investment in Lunahuaná (2026)
Exploring the top neighborhoods for short-term rentals in Lunahuaná? This section highlights key areas, outlining why they are attractive for hosts and guests, along with notable local attractions. Consider these locations based on your target guest profile and investment strategy.
| Neighborhood / Area | Why Host Here? (Target Guests & Appeal) | Key Attractions & Landmarks |
|---|---|---|
| Pueblo de Lunahuaná | Charming village in Lunahuaná famous for its riverside activities and beautiful landscapes. Ideal for tourists seeking adventure sports and relaxation by the river. | Cañete River, Horseback riding, Rafting experiences, Lunahuaná Church, Local wineries |
| Centro Histórico de Lunahuaná | The historic center of Lunahuaná, showcasing colonial architecture and local culture. Attractive to visitors interested in history and local cuisine. | Plaza de Armas, Santuario Señor de la Ascensión, historical museums, local restaurants, artisan markets |
| Segmento del Río Cañete | Perfect for those looking to enjoy water activities and tranquil river views. A great spot for families and groups seeking adventure and leisure alike. | Kayaking, Fishing, Riverside picnics, Scenic viewpoints |
| Viñedos de Lunahuaná | Famous for its vineyards and wineries producing local wines and pisco. A must-visit for wine enthusiasts and culinary tourists. | Winery tours, Wine tasting, Vineyard walks |
| Nevado de La Sal | Ideal for outdoor enthusiasts and hikers, this area offers stunning mountain views and trekking opportunities. | Scenic hiking trails, Breathtaking views, Wildlife observation |
| Lunahuaná Adventure Park | Attracts adventure seekers with various outdoor activities such as zip-lining and canopy tours. Perfect for thrill-seekers and families. | Zip-lining, Canopy tours, Adventure sports courses |
| Mirador de Lunahuaná | A panoramic viewpoint that provides breathtaking views of the valley and river below. A photographic hotspot for visitors. | Scenic overlooks, Photography spots, Picnic areas |
| Baños Termales de Lunahuaná | Natural hot springs located nearby Lunahuaná, ideal for relaxation after a day of activities. Attracts visitors looking for wellness and relaxation. | Hot springs, Spa services, Relaxation areas |
Understanding Airbnb License Requirements & STR Laws in Lunahuaná (2026)
While Lunahuaná, Lima, Peru currently shows low STR regulations, specific Airbnb license requirements might still exist or change. Always verify the latest short term rental regulations and Airbnb license requirements directly with local government authorities for Lunahuaná to ensure full compliance before hosting.
(Source: AirROI data, 2026, finding no licensed listings among those analyzed)
Top Performing Airbnb Properties in Lunahuaná (2026)
Benchmark your potential! Explore examples of top-performing Airbnb properties in Lunahuanábased on Trailing Twelve Month (TTM) revenue. Analyze their characteristics, revenue, occupancy rate, and ADR to understand what drives success in this market.

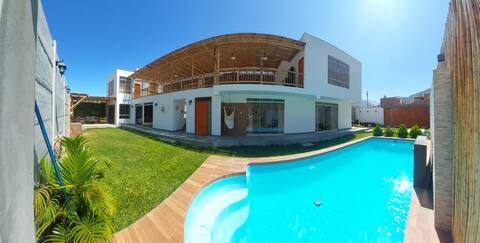
Unique country house with swimming pool and large gardens
Entire Place • 3 bedrooms

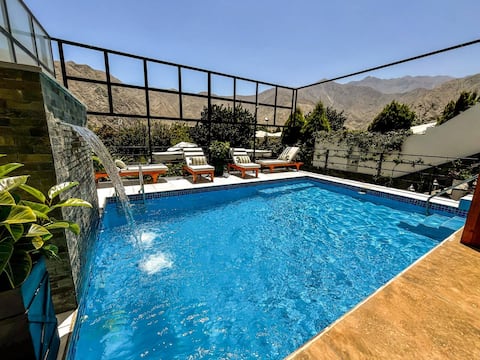
Mirador House: Nature Retreat with Spacious Pool
Entire Place • 2 bedrooms
Casa de Campo - Lunahuaná Main Square
Entire Place • 4 bedrooms
Luxury Eco Villa with Pool - Natural Views
Entire Place • 5 bedrooms
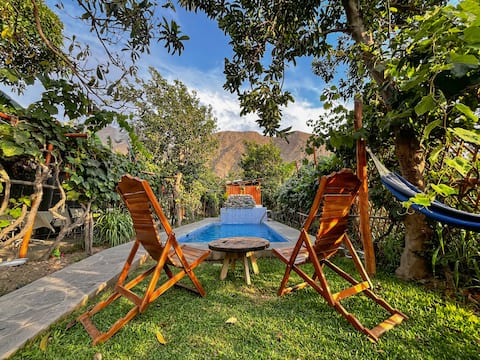
Eco Retreat with Pool & Fruit Orchard Paradise
Entire Place • 6 bedrooms

Lunahuaná country house with pool
Entire Place • 2 bedrooms
Note: Performance varies based on location, size, amenities, seasonality, and management quality. Data reflects the past 12 months.
Top Performing Airbnb Hosts in Lunahuaná (2026)
Learn from the best! This table showcases top-performing Airbnb hosts in Lunahuaná based on the number of properties managed and estimated total revenue over the past year. Analyze their scale and performance metrics.
| Host Name | Properties | Grossing Revenue | Stay Reviews | Avg Rating |
|---|---|---|---|---|
| Claudia | 10 | $129,198 | 265 | 4.96/5.0 |
| Nancy | 4 | $55,851 | 17 | 4.67/5.0 |
| Angelica | 1 | $42,382 | 34 | 5.00/5.0 |
| Sonia | 1 | $24,807 | 61 | 4.90/5.0 |
| Roy | 1 | $23,005 | 27 | 4.93/5.0 |
| Paola | 1 | $21,259 | 17 | 4.94/5.0 |
| Marco | 1 | $19,098 | 17 | 4.82/5.0 |
| Henry | 2 | $18,011 | 75 | 4.93/5.0 |
| Erika | 2 | $17,885 | 13 | 4.94/5.0 |
| Damaris | 1 | $17,680 | 10 | 5.00/5.0 |
Analyzing the strategies of top hosts, such as their property selection, pricing, and guest communication, can offer valuable lessons for optimizing your own Airbnb operations in Lunahuaná.
Dive Deeper: Advanced Lunahuaná STR Market Data (2026)
Ready to unlock more insights? AirROI provides access to advanced metrics and comprehensive Airbnb data for Lunahuaná. Explore detailed analytics beyond this report to refine your investment strategy, optimize pricing, and maximize your vacation rental profits.
Explore Advanced MetricsLunahuaná Short-Term Rental Market Composition (2026): Property & Room Types
Room Type Distribution
Property Type Distribution
Market Composition Insights for Lunahuaná
- The Lunahuaná Airbnb market composition is heavily skewed towards Entire Home/Apt listings, which make up 66% of the 97 active rentals. This indicates strong guest preference for privacy and space.
- However, a notable 34% share for Private Rooms suggests opportunities for budget-conscious travelers or hosts renting out spare rooms.
- Looking at the property type distribution in Lunahuaná, House properties are the most common (58.8%), reflecting the local real estate landscape.
- Houses represent a significant 58.8% portion, catering likely to families or larger groups.
- The presence of 25.8% Hotel/Boutique listings indicates integration with traditional hospitality.
Lunahuaná Airbnb Room Capacity Analysis (2026): Bedroom Distribution
Distribution of Listings by Number of Bedrooms
Room Capacity Insights for Lunahuaná
- The dominant room capacity in Lunahuaná is 5+ bedrooms listings, making up 18.6% of the market. This suggests a strong demand for properties suitable for families or small groups.
- Together, 5+ bedrooms and 1 bedroom properties represent 37.2% of the active Airbnb listings in Lunahuaná, indicating a high concentration in these sizes.
- A significant 50.5% of listings offer 3+ bedrooms, catering to larger groups and families seeking more space in Lunahuaná.
Lunahuaná Vacation Rental Guest Capacity Trends (2026)
Distribution of Listings by Guest Capacity
Guest Capacity Insights for Lunahuaná
- The most common guest capacity trend in Lunahuaná vacation rentals is listings accommodating 8+ guests (49.5%). This suggests the primary traveler segment is likely larger groups.
- Properties designed for 8+ guests and 6 guests dominate the Lunahuaná STR market, accounting for 61.9% of listings.
- 61.9% of properties accommodate 6+ guests, serving the market segment for larger families or group travel in Lunahuaná.
- On average, properties in Lunahuaná are equipped to host 5.4 guests.
Lunahuaná Airbnb Booking Patterns (2026): Available vs. Booked Days
Available Days Distribution
Booked Days Distribution
Booking Pattern Insights for Lunahuaná
- The most common availability pattern in Lunahuaná falls within the 271-366 days range, representing 89.7% of listings. This suggests many properties have significant open periods on their calendars.
- Approximately 99.0% of listings show high availability (181+ days open annually), indicating potential for increased bookings or specific owner usage patterns.
- For booked days, the 1-30 days range is most frequent in Lunahuaná (58.8%), reflecting common guest stay durations or potential owner blocking patterns.
- A notable 1.0% of properties secure long booking periods (181+ days booked per year), highlighting successful long-term rental strategies or significant owner usage.
Lunahuaná Airbnb Minimum Stay Requirements Analysis
Distribution of Listings by Minimum Night Requirement
1 Night
60 listings
61.9% of total
2 Nights
16 listings
16.5% of total
3 Nights
1 listings
1% of total
4-6 Nights
1 listings
1% of total
30+ Nights
19 listings
19.6% of total
Key Insights
- The most prevalent minimum stay requirement in Lunahuaná is 1 Night, adopted by 61.9% of listings. This highlights the market's preference for shorter, flexible bookings.
- A strong majority (78.4%) of the Lunahuaná Airbnb data shows acceptance of very short stays (1-2 nights), indicating a dynamic, high-turnover market.
- A significant segment (19.6%) caters to monthly stays (30+ nights) in Lunahuaná, pointing to opportunities in the extended-stay market.
Recommendations
- Align with the market by considering a 1 Night minimum stay, as 61.9% of Lunahuaná hosts use this setting.
- Explore offering discounts for stays of 30+ nights to attract the 19.6% of the market seeking extended stays.
- Adjust minimum nights based on seasonality – potentially shorter during low season and longer during peak demand periods in Lunahuaná.
Lunahuaná Airbnb Cancellation Policy Trends Analysis (2026)
Limited
2 listings
2.1% of total
Flexible
23 listings
23.7% of total
Moderate
42 listings
43.3% of total
Firm
23 listings
23.7% of total
Strict
7 listings
7.2% of total
Cancellation Policy Insights for Lunahuaná
- The prevailing Airbnb cancellation policy trend in Lunahuaná is Moderate, used by 43.3% of listings.
- There's a relatively balanced mix between guest-friendly (67.0%) and stricter (30.9%) policies, offering choices for different guest needs.
- Strict cancellation policies are quite rare (7.2%), potentially making listings with this policy less competitive unless justified by high demand or property type.
Recommendations for Hosts
- Consider adopting a Moderate policy to align with the 43.3% market standard in Lunahuaná.
- Using a Strict policy might deter some guests, as only 7.2% of listings use it. Evaluate if potential revenue protection outweighs possible lower booking rates.
- Regularly review your cancellation policy against competitors and market demand shifts in Lunahuaná.
Lunahuaná STR Booking Lead Time Analysis (2026)
Average Booking Lead Time by Month
Booking Lead Time Insights for Lunahuaná
- The overall average booking lead time for vacation rentals in Lunahuaná is 23 days.
- Guests book furthest in advance for stays during December (average 58 days), likely coinciding with peak travel demand or local events.
- The shortest booking windows occur for stays in May (average 8 days), indicating more last-minute travel plans during this time.
- Seasonally, Winter (29 days avg.) sees the longest lead times, while Spring (12 days avg.) has the shortest, reflecting typical travel planning cycles.
Recommendations for Hosts
- Use the overall average lead time (23 days) as a baseline for your pricing and availability strategy in Lunahuaná.
- For December stays, consider implementing length-of-stay discounts or slightly higher rates for bookings made less than 58 days out to capitalize on advance planning.
- During May, focus on last-minute booking availability and promotions, as guests book with very short notice (8 days avg.).
- Target marketing efforts for the Winter season well in advance (at least 29 days) to capture early planners.
- Monitor your own booking lead times against these Lunahuaná averages to identify opportunities for dynamic pricing adjustments.
Popular & Essential Airbnb Amenities in Lunahuaná (2026)
Amenity Prevalence
Amenity Insights for Lunahuaná
- Popular amenities like Free parking on premises, Pool, Pets allowed are common but not universal. Offering these can provide a competitive edge.
- A pool is a highly desired but not standard amenity, making it a key feature for attracting guests seeking leisure in Lunahuaná.
- Warning: Wifi is not universally provided but is considered essential globally. Ensure reliable Wifi is offered.
Recommendations for Hosts
- Consider adding popular differentiators like Free parking on premises or Pool to increase appeal.
- Highlight unique or less common amenities you offer (e.g., hot tub, dedicated workspace, EV charger) in your listing description and photos.
- Regularly check competitor amenities in Lunahuaná to stay competitive.
Lunahuaná Airbnb Guest Demographics & Profile Analysis (2026)
Guest Profile Summary for Lunahuaná
- The typical guest profile for Airbnb in Lunahuaná consists of primarily domestic travelers (78%), often arriving from nearby Lima, typically belonging to the Post-2000s (Gen Z/Alpha) group (50%), primarily speaking Spanish or English.
- Domestic travelers account for 78.2% of guests.
- Key international markets include Peru (78.2%) and United States (13.5%).
- Top languages spoken are Spanish (46.6%) followed by English (34.6%).
- A significant demographic segment is the Post-2000s (Gen Z/Alpha) group, representing 50% of guests.
Recommendations for Hosts
- Target domestic marketing efforts towards travelers from Lima and Lima Region.
- Tailor amenities and listing descriptions to appeal to the dominant Post-2000s (Gen Z/Alpha) demographic (e.g., highlight fast WiFi, smart home features, local guides).
- Highlight unique local experiences or amenities relevant to the primary guest profile.
- Consider seasonal promotions aligned with peak travel times for key origin markets.
Nearby Short-Term Rental Market Comparison
How does the Lunahuaná Airbnb market stack up against its neighbors? Compare key performance metrics like average monthly revenue, ADR, and occupancy rates in surrounding areas to understand the broader regional STR landscape.
| Market | Active Properties | Monthly Revenue | Daily Rate | Avg. Occupancy |
|---|---|---|---|---|
| Tambo de Mora | 12 | $1,613 | $224.45 | 29% |
| Ricardo Palma | 12 | $1,262 | $265.85 | 24% |
| Cieneguilla | 10 | $1,242 | $189.15 | 31% |
| Chincha Baja | 45 | $1,097 | $225.32 | 23% |
| El Carmen | 87 | $1,087 | $243.76 | 22% |
| Santa Cruz de Flores | 67 | $901 | $222.02 | 22% |
| Santa Eulalia | 42 | $821 | $192.27 | 20% |
| Paracas | 305 | $785 | $161.55 | 22% |
| Salas | 18 | $750 | $171.35 | 22% |
| San Antonio | 115 | $723 | $204.11 | 24% |