Asia Airbnb Market Analysis 2026: Short Term Rental Data & Vacation Rental Statistics in Lima, Peru
Is Airbnb profitable in Asia in 2026? Explore comprehensive Airbnb analytics for Asia, Lima, Peru to uncover income potential. This 2026 STR market report for Asia, based on AirROI data from February 2025 to January 2026, reveals key trends in the market of 375 active listings.
Whether you're considering an Airbnb investment in Asia, optimizing your existing vacation rental, or exploring rental arbitrage opportunities, understanding the Asia Airbnb data is crucial. Leveraging the low regulation environment is key to maximizing your short term rental income potential. Let's dive into the specifics.
Key Asia Airbnb Performance Metrics Overview
Monthly Airbnb Revenue Variations & Income Potential in Asia (2026)
Understanding the monthly revenue variations for Airbnb listings in Asia is key to maximizing your short term rental income potential. Seasonality significantly impacts earnings. Our analysis, based on data from the past 12 months, shows that the peak revenue month for STRs in Asia is typically February, while November often presents the lowest earnings, highlighting opportunities for strategic pricing adjustments during shoulder and low seasons. Explore the typical Airbnb income in Asia across different performance tiers:
- Best-in-class properties (Top 10%) achieve $2,597+ monthly, often utilizing dynamic pricing and superior guest experiences.
- Strong performing properties (Top 25%) earn $1,515 or more, indicating effective management and desirable locations/amenities.
- Typical properties (Median) generate around $772 per month, representing the average market performance.
- Entry-level properties (Bottom 25%) see earnings around $390, often with potential for optimization.
Average Monthly Airbnb Earnings Trend in Asia
Asia Airbnb Occupancy Rate Trends (2026)
Maximize your bookings by understanding the Asia STR occupancy trends. Seasonal demand shifts significantly influence how often properties are booked. Typically, Februarysees the highest demand (peak season occupancy), while November experiences the lowest (low season). Effective strategies, like adjusting minimum stays or offering promotions, can boost occupancy during slower periods. Here's how different property tiers perform in Asia:
- Best-in-class properties (Top 10%) achieve 38%+ occupancy, indicating high desirability and potentially optimized availability.
- Strong performing properties (Top 25%) maintain 27% or higher occupancy, suggesting good market fit and guest satisfaction.
- Typical properties (Median) have an occupancy rate around 14%.
- Entry-level properties (Bottom 25%) average 7% occupancy, potentially facing higher vacancy.
Average Monthly Occupancy Rate Trend in Asia
Average Daily Rate (ADR) Airbnb Trends in Asia (2026)
Effective short term rental pricing strategy in Asia involves understanding monthly ADR fluctuations. The Average Daily Rate (ADR) for Airbnb in Asia typically peaks in January and dips lowest during August. Leveraging Airbnb dynamic pricing tools or strategies based on this seasonality can significantly boost revenue. Here's a look at the typical nightly rates achieved:
- Best-in-class properties (Top 10%) command rates of $339+ per night, often due to premium features or locations.
- Strong performing properties (Top 25%) achieve nightly rates of $248 or more.
- Typical properties (Median) charge around $181 per night.
- Entry-level properties (Bottom 25%) earn around $125 per night.
Average Daily Rate (ADR) Trend by Month in Asia
Get Live Asia Market Intelligence 👇

Explore Real-time Analytics
Airbnb Seasonality Analysis & Trends in Asia (2026)
Peak Season (February, March, January)
- Revenue averages $2,074 per month
- Occupancy rates average 32.7%
- Daily rates average $207
Shoulder Season
- Revenue averages $1,008 per month
- Occupancy maintains around 16.5%
- Daily rates hold near $200
Low Season (August, September, November)
- Revenue drops to average $583 per month
- Occupancy decreases to average 10.2%
- Daily rates adjust to average $198
Seasonality Insights for Asia
- The Airbnb seasonality in Asia shows highly seasonal trends requiring careful strategy. While the sections above show seasonal averages, it's also insightful to look at the extremes:
- During the high season, the absolute peak month showcases Asia's highest earning potential, with monthly revenues capable of climbing to $2,763, occupancy reaching a high of 45.0%, and ADRs peaking at $224.
- Conversely, the slowest single month of the year, typically falling within the low season, marks the market's lowest point. In this month, revenue might dip to $549, occupancy could drop to 9.9%, and ADRs may adjust down to $192.
- Understanding both the seasonal averages and these monthly peaks and troughs in revenue, occupancy, and ADR is crucial for maximizing your Airbnb profit potential in Asia.
Seasonal Strategies for Maximizing Profit
- Peak Season: Maximize revenue through premium pricing and potentially longer minimum stays. Ensure high availability.
- Low Season: Offer competitive pricing, special promotions (e.g., extended stay discounts), and flexible cancellation policies. Target off-season travelers like remote workers or budget-conscious guests.
- Shoulder Seasons: Implement dynamic pricing that balances peak and low rates. Target weekend travelers or specific events. Offer slightly more flexible terms than peak season.
- Regularly analyze your own performance against these Asia seasonality benchmarks and adjust your pricing and availability strategy accordingly.
Best Areas for Airbnb Investment in Asia (2026)
Exploring the top neighborhoods for short-term rentals in Asia? This section highlights key areas, outlining why they are attractive for hosts and guests, along with notable local attractions. Consider these locations based on your target guest profile and investment strategy.
| Neighborhood / Area | Why Host Here? (Target Guests & Appeal) | Key Attractions & Landmarks |
|---|---|---|
| Shinjuku | A bustling urban area known for its nightlife, shopping, and entertainment. It attracts millions of visitors each year and offers a diverse range of accommodations. | Shinjuku Gyoen National Garden, Tokyo Metropolitan Government Building, Omoide Yokocho (Memory Lane), Kabukicho, Golden Gai |
| Bali | A tropical paradise famous for its stunning beaches, rice terraces, and vibrant culture. Bali is a top destination for tourists seeking relaxation and adventure. | Ubud Monkey Forest, Tanah Lot Temple, Kuta Beach, Seminyak, Uluwatu Temple |
| Bangkok | A vibrant city that blends tradition and modernity with a rich culture, delectable street food, and a bustling atmosphere. It appeals to a wide variety of travelers. | Grand Palace, Wat Pho (Temple of the Reclining Buddha), Chatuchak Weekend Market, Khao San Road, Jim Thompson House |
| Hong Kong | A dynamic city known for its skyline, shopping, and culinary scene. It is a major global financial hub that attracts business travelers and tourists alike. | Victoria Peak, Tsim Sha Tsui waterfront, Big Buddha, Mong Kok shopping district, Star Ferry |
| Seoul | A vibrant city that seamlessly combines modernity with traditional culture, known for its technology, fashion, and delicious food. A hotspot for travelers wanting an urban cultural experience. | Gyeongbokgung Palace, Myeongdong shopping district, N Seoul Tower, Bukchon Hanok Village, Dongdaemun Design Plaza |
| Chiang Mai | Known for its beautiful temples, rich culture, and surrounding nature, Chiang Mai attracts those looking for both relaxation and adventure activities. | Doi Suthep, Chiang Mai Night Bazaar, Old City Temples, Elephant Nature Park, Chiang Mai Zoo |
| Ho Chi Minh City | A lively city known for its history, culture, and culinary delights. It's a key destination for both business and leisure travelers in Vietnam. | War Remnants Museum, Ben Thanh Market, Notre-Dame Cathedral Basilica of Saigon, Bui Vien Street, Saigon River |
| Manila | The capital city of the Philippines, known for its historical landmarks, lively nightlife, and beautiful natural surroundings. It attracts many tourists and business visitors. | Intramuros, Rizal Park, Manila Ocean Park, Greenbelt Mall, Fort Santiago |
Understanding Airbnb License Requirements & STR Laws in Asia (2026)
While Asia, Lima, Peru currently shows low STR regulations, specific Airbnb license requirements might still exist or change. Always verify the latest short term rental regulations and Airbnb license requirements directly with local government authorities for Asia to ensure full compliance before hosting.
(Source: AirROI data, 2026, finding no licensed listings among those analyzed)
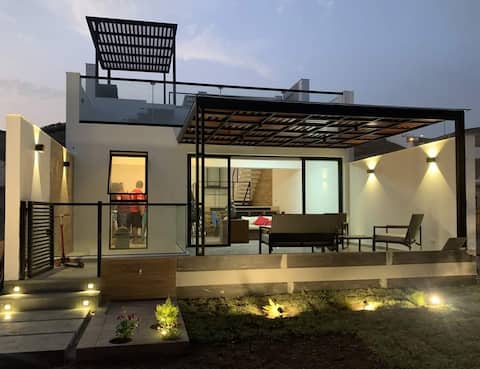
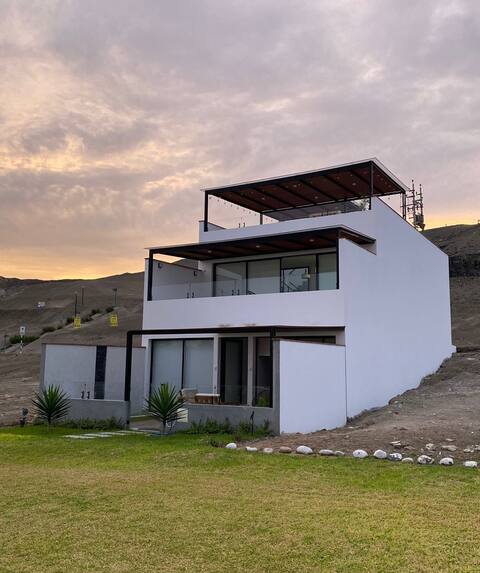
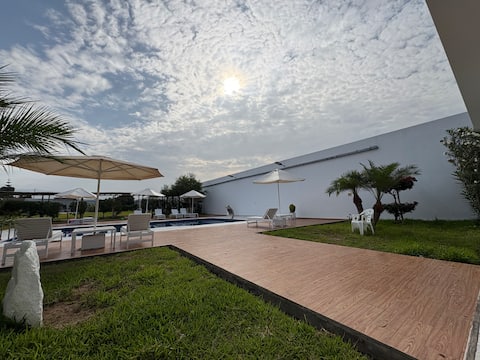
Top Performing Airbnb Properties in Asia (2026)
Benchmark your potential! Explore examples of top-performing Airbnb properties in Asiabased on Trailing Twelve Month (TTM) revenue. Analyze their characteristics, revenue, occupancy rate, and ADR to understand what drives success in this market.

Beach house very close to the sea, exclusive pool!
Entire Place • 5 bedrooms

Exclusive Casa de Campo La Cuesta in Asia, 7 people
Entire Place • 4 bedrooms
South Asia Clubhouse
Entire Place • 5 bedrooms

Beach house in Asia with pool
Entire Place • 5 bedrooms
Casa ES - Clubhouse
Entire Place • 4 bedrooms
Country house in South Asia! Km100
Entire Place • 5 bedrooms
Note: Performance varies based on location, size, amenities, seasonality, and management quality. Data reflects the past 12 months.
Top Performing Airbnb Hosts in Asia (2026)
Learn from the best! This table showcases top-performing Airbnb hosts in Asia based on the number of properties managed and estimated total revenue over the past year. Analyze their scale and performance metrics.
| Host Name | Properties | Grossing Revenue | Stay Reviews | Avg Rating |
|---|---|---|---|---|
| Sandro Y Catherine | 5 | $63,993 | 47 | 4.46/5.0 |
| Rafael | 7 | $53,801 | 53 | 4.25/5.0 |
| Luis | 1 | $48,358 | 47 | 4.91/5.0 |
| Alfonso | 1 | $45,070 | 50 | 4.96/5.0 |
| Elmer | 1 | $41,184 | 9 | 5.00/5.0 |
| María | 1 | $39,467 | 13 | 4.92/5.0 |
| Antonella | 1 | $36,601 | 11 | 4.82/5.0 |
| Rodrigo | 1 | $36,307 | 18 | 5.00/5.0 |
| Ita | 4 | $32,162 | 194 | 4.76/5.0 |
| Paola | 1 | $30,662 | 8 | 4.88/5.0 |
Analyzing the strategies of top hosts, such as their property selection, pricing, and guest communication, can offer valuable lessons for optimizing your own Airbnb operations in Asia.
Dive Deeper: Advanced Asia STR Market Data (2026)
Ready to unlock more insights? AirROI provides access to advanced metrics and comprehensive Airbnb data for Asia. Explore detailed analytics beyond this report to refine your investment strategy, optimize pricing, and maximize your vacation rental profits.
Explore Advanced MetricsAsia Short-Term Rental Market Composition (2026): Property & Room Types
Room Type Distribution
Property Type Distribution
Market Composition Insights for Asia
- The Asia Airbnb market composition is heavily skewed towards Entire Home/Apt listings, which make up 93.9% of the 375 active rentals. This indicates strong guest preference for privacy and space.
- Looking at the property type distribution in Asia, House properties are the most common (68.8%), reflecting the local real estate landscape.
- Houses represent a significant 68.8% portion, catering likely to families or larger groups.
- Smaller segments like hotel/boutique, others, outdoor/unique (combined 2.9%) offer potential for unique stay experiences.
Asia Airbnb Room Capacity Analysis (2026): Bedroom Distribution
Distribution of Listings by Number of Bedrooms
Room Capacity Insights for Asia
- The dominant room capacity in Asia is 5+ bedrooms listings, making up 28% of the market. This suggests a strong demand for properties suitable for families or small groups.
- Together, 5+ bedrooms and 4 bedrooms properties represent 53.3% of the active Airbnb listings in Asia, indicating a high concentration in these sizes.
- A significant 75.7% of listings offer 3+ bedrooms, catering to larger groups and families seeking more space in Asia.
Asia Vacation Rental Guest Capacity Trends (2026)
Distribution of Listings by Guest Capacity
Guest Capacity Insights for Asia
- The most common guest capacity trend in Asia vacation rentals is listings accommodating 8+ guests (76.3%). This suggests the primary traveler segment is likely larger groups.
- Properties designed for 8+ guests and 6 guests dominate the Asia STR market, accounting for 84.6% of listings.
- 88.6% of properties accommodate 6+ guests, serving the market segment for larger families or group travel in Asia.
- On average, properties in Asia are equipped to host 7.2 guests.
Asia Airbnb Booking Patterns (2026): Available vs. Booked Days
Available Days Distribution
Booked Days Distribution
Booking Pattern Insights for Asia
- The most common availability pattern in Asia falls within the 271-366 days range, representing 94.7% of listings. This suggests many properties have significant open periods on their calendars.
- Approximately 99.5% of listings show high availability (181+ days open annually), indicating potential for increased bookings or specific owner usage patterns.
- For booked days, the 1-30 days range is most frequent in Asia (50.9%), reflecting common guest stay durations or potential owner blocking patterns.
- A notable 0.5% of properties secure long booking periods (181+ days booked per year), highlighting successful long-term rental strategies or significant owner usage.
Asia Airbnb Minimum Stay Requirements Analysis
Distribution of Listings by Minimum Night Requirement
1 Night
53 listings
14.1% of total
2 Nights
132 listings
35.2% of total
3 Nights
31 listings
8.3% of total
4-6 Nights
38 listings
10.1% of total
7-29 Nights
18 listings
4.8% of total
30+ Nights
103 listings
27.5% of total
Key Insights
- The most prevalent minimum stay requirement in Asia is 2 Nights, adopted by 35.2% of listings. This highlights the market's preference for shorter, flexible bookings.
- A significant segment (27.5%) caters to monthly stays (30+ nights) in Asia, pointing to opportunities in the extended-stay market.
Recommendations
- Align with the market by considering a 2 Nights minimum stay, as 35.2% of Asia hosts use this setting.
- If feasible, allowing 1-night stays, especially midweek or during low season, could capture last-minute bookings, as only 14.1% currently do.
- A 2-night minimum appears standard (35.2%). Consider this for weekends or peak periods.
- Explore offering discounts for stays of 30+ nights to attract the 27.5% of the market seeking extended stays.
- Adjust minimum nights based on seasonality – potentially shorter during low season and longer during peak demand periods in Asia.
Asia Airbnb Cancellation Policy Trends Analysis (2026)
Limited
13 listings
3.5% of total
Flexible
89 listings
24.1% of total
Moderate
94 listings
25.5% of total
Firm
134 listings
36.3% of total
Strict
39 listings
10.6% of total
Cancellation Policy Insights for Asia
- The prevailing Airbnb cancellation policy trend in Asia is Firm, used by 36.3% of listings.
- There's a relatively balanced mix between guest-friendly (49.6%) and stricter (46.9%) policies, offering choices for different guest needs.
Recommendations for Hosts
- Consider adopting a Firm policy to align with the 36.3% market standard in Asia.
- Using a Strict policy might deter some guests, as only 10.6% of listings use it. Evaluate if potential revenue protection outweighs possible lower booking rates.
- Regularly review your cancellation policy against competitors and market demand shifts in Asia.
Asia STR Booking Lead Time Analysis (2026)
Average Booking Lead Time by Month
Booking Lead Time Insights for Asia
- The overall average booking lead time for vacation rentals in Asia is 22 days.
- Guests book furthest in advance for stays during December (average 37 days), likely coinciding with peak travel demand or local events.
- The shortest booking windows occur for stays in September (average 2 days), indicating more last-minute travel plans during this time.
- Seasonally, Winter (27 days avg.) sees the longest lead times, while Summer (7 days avg.) has the shortest, reflecting typical travel planning cycles.
Recommendations for Hosts
- Use the overall average lead time (22 days) as a baseline for your pricing and availability strategy in Asia.
- For December stays, consider implementing length-of-stay discounts or slightly higher rates for bookings made less than 37 days out to capitalize on advance planning.
- During September, focus on last-minute booking availability and promotions, as guests book with very short notice (2 days avg.).
- Target marketing efforts for the Winter season well in advance (at least 27 days) to capture early planners.
- Monitor your own booking lead times against these Asia averages to identify opportunities for dynamic pricing adjustments.
Popular & Essential Airbnb Amenities in Asia (2026)
Amenity Prevalence
Amenity Insights for Asia
- Essential amenities in Asia that guests expect include: Free parking on premises, Kitchen. Lacking these (any) could significantly impact bookings.
- Popular amenities like TV, Pool, BBQ grill are common but not universal. Offering these can provide a competitive edge.
- A pool is a highly desired but not standard amenity, making it a key feature for attracting guests seeking leisure in Asia.
- Warning: Wifi is not universally provided but is considered essential globally. Ensure reliable Wifi is offered.
Recommendations for Hosts
- Ensure your listing includes all essential amenities for Asia: Free parking on premises, Kitchen.
- Prioritize adding missing essentials: Free parking on premises, Kitchen.
- Consider adding popular differentiators like TV or Pool to increase appeal.
- Highlight unique or less common amenities you offer (e.g., hot tub, dedicated workspace, EV charger) in your listing description and photos.
- Regularly check competitor amenities in Asia to stay competitive.
Asia Airbnb Guest Demographics & Profile Analysis (2026)
Guest Profile Summary for Asia
- The typical guest profile for Airbnb in Asia consists of primarily domestic travelers (84%), often arriving from nearby Lima, typically belonging to the Post-2000s (Gen Z/Alpha) group (50%), primarily speaking Spanish or English.
- Domestic travelers account for 84.3% of guests.
- Key international markets include Peru (84.3%) and United States (7.2%).
- Top languages spoken are Spanish (49.2%) followed by English (37.8%).
- A significant demographic segment is the Post-2000s (Gen Z/Alpha) group, representing 50% of guests.
Recommendations for Hosts
- Target domestic marketing efforts towards travelers from Lima and Lima District.
- Tailor amenities and listing descriptions to appeal to the dominant Post-2000s (Gen Z/Alpha) demographic (e.g., highlight fast WiFi, smart home features, local guides).
- Highlight unique local experiences or amenities relevant to the primary guest profile.
- Consider seasonal promotions aligned with peak travel times for key origin markets.
Nearby Short-Term Rental Market Comparison
How does the Asia Airbnb market stack up against its neighbors? Compare key performance metrics like average monthly revenue, ADR, and occupancy rates in surrounding areas to understand the broader regional STR landscape.
| Market | Active Properties | Monthly Revenue | Daily Rate | Avg. Occupancy |
|---|---|---|---|---|
| Tambo de Mora | 12 | $1,613 | $224.45 | 29% |
| Ricardo Palma | 12 | $1,262 | $265.85 | 24% |
| Cieneguilla | 10 | $1,242 | $189.15 | 31% |
| Chincha Baja | 45 | $1,097 | $225.32 | 23% |
| El Carmen | 87 | $1,087 | $243.76 | 22% |
| Santa Cruz de Flores | 67 | $901 | $222.02 | 22% |
| Santa Eulalia | 42 | $821 | $192.27 | 20% |
| Paracas | 305 | $785 | $161.55 | 22% |
| Salas | 18 | $750 | $171.35 | 22% |
| San Antonio | 115 | $723 | $204.11 | 24% |