Chanchamayo Airbnb Market Analysis 2026: Short Term Rental Data & Vacation Rental Statistics in Junín, Peru
Is Airbnb profitable in Chanchamayo in 2026? Explore comprehensive Airbnb analytics for Chanchamayo, Junín, Peru to uncover income potential. This 2026 STR market report for Chanchamayo, based on AirROI data from February 2025 to January 2026, reveals key trends in the niche market of 31 active listings.
Whether you're considering an Airbnb investment in Chanchamayo, optimizing your existing vacation rental, or exploring rental arbitrage opportunities, understanding the Chanchamayo Airbnb data is crucial. Leveraging the low regulation environment is key to maximizing your short term rental income potential. Let's dive into the specifics.
Key Chanchamayo Airbnb Performance Metrics Overview
Monthly Airbnb Revenue Variations & Income Potential in Chanchamayo (2026)
Understanding the monthly revenue variations for Airbnb listings in Chanchamayo is key to maximizing your short term rental income potential. Seasonality significantly impacts earnings. Our analysis, based on data from the past 12 months, shows that the peak revenue month for STRs in Chanchamayo is typically July, while November often presents the lowest earnings, highlighting opportunities for strategic pricing adjustments during shoulder and low seasons. Explore the typical Airbnb income in Chanchamayo across different performance tiers:
- Best-in-class properties (Top 10%) achieve $443+ monthly, often utilizing dynamic pricing and superior guest experiences.
- Strong performing properties (Top 25%) earn $285 or more, indicating effective management and desirable locations/amenities.
- Typical properties (Median) generate around $147 per month, representing the average market performance.
- Entry-level properties (Bottom 25%) see earnings around $66, often with potential for optimization.
Average Monthly Airbnb Earnings Trend in Chanchamayo
Chanchamayo Airbnb Occupancy Rate Trends (2026)
Maximize your bookings by understanding the Chanchamayo STR occupancy trends. Seasonal demand shifts significantly influence how often properties are booked. Typically, Augustsees the highest demand (peak season occupancy), while September experiences the lowest (low season). Effective strategies, like adjusting minimum stays or offering promotions, can boost occupancy during slower periods. Here's how different property tiers perform in Chanchamayo:
- Best-in-class properties (Top 10%) achieve 35%+ occupancy, indicating high desirability and potentially optimized availability.
- Strong performing properties (Top 25%) maintain 20% or higher occupancy, suggesting good market fit and guest satisfaction.
- Typical properties (Median) have an occupancy rate around 11%.
- Entry-level properties (Bottom 25%) average 7% occupancy, potentially facing higher vacancy.
Average Monthly Occupancy Rate Trend in Chanchamayo
Average Daily Rate (ADR) Airbnb Trends in Chanchamayo (2026)
Effective short term rental pricing strategy in Chanchamayo involves understanding monthly ADR fluctuations. The Average Daily Rate (ADR) for Airbnb in Chanchamayo typically peaks in January and dips lowest during February. Leveraging Airbnb dynamic pricing tools or strategies based on this seasonality can significantly boost revenue. Here's a look at the typical nightly rates achieved:
- Best-in-class properties (Top 10%) command rates of $96+ per night, often due to premium features or locations.
- Strong performing properties (Top 25%) achieve nightly rates of $47 or more.
- Typical properties (Median) charge around $31 per night.
- Entry-level properties (Bottom 25%) earn around $22 per night.
Average Daily Rate (ADR) Trend by Month in Chanchamayo
Get Live Chanchamayo Market Intelligence 👇

Explore Real-time Analytics
Airbnb Seasonality Analysis & Trends in Chanchamayo (2026)
Peak Season (July, December, August)
- Revenue averages $335 per month
- Occupancy rates average 20.5%
- Daily rates average $45
Shoulder Season
- Revenue averages $215 per month
- Occupancy maintains around 14.5%
- Daily rates hold near $44
Low Season (May, June, November)
- Revenue drops to average $139 per month
- Occupancy decreases to average 13.2%
- Daily rates adjust to average $44
Seasonality Insights for Chanchamayo
- The Airbnb seasonality in Chanchamayo shows highly seasonal trends requiring careful strategy. While the sections above show seasonal averages, it's also insightful to look at the extremes:
- During the high season, the absolute peak month showcases Chanchamayo's highest earning potential, with monthly revenues capable of climbing to $383, occupancy reaching a high of 24.2%, and ADRs peaking at $49.
- Conversely, the slowest single month of the year, typically falling within the low season, marks the market's lowest point. In this month, revenue might dip to $125, occupancy could drop to 7.5%, and ADRs may adjust down to $41.
- Understanding both the seasonal averages and these monthly peaks and troughs in revenue, occupancy, and ADR is crucial for maximizing your Airbnb profit potential in Chanchamayo.
Seasonal Strategies for Maximizing Profit
- Peak Season: Maximize revenue through premium pricing and potentially longer minimum stays. Ensure high availability.
- Low Season: Offer competitive pricing, special promotions (e.g., extended stay discounts), and flexible cancellation policies. Target off-season travelers like remote workers or budget-conscious guests.
- Shoulder Seasons: Implement dynamic pricing that balances peak and low rates. Target weekend travelers or specific events. Offer slightly more flexible terms than peak season.
- Regularly analyze your own performance against these Chanchamayo seasonality benchmarks and adjust your pricing and availability strategy accordingly.
Best Areas for Airbnb Investment in Chanchamayo (2026)
Exploring the top neighborhoods for short-term rentals in Chanchamayo? This section highlights key areas, outlining why they are attractive for hosts and guests, along with notable local attractions. Consider these locations based on your target guest profile and investment strategy.
| Neighborhood / Area | Why Host Here? (Target Guests & Appeal) | Key Attractions & Landmarks |
|---|---|---|
| Chanchamayo | A vibrant town known for its rich cultural heritage and stunning natural beauty, offering a gateway to the Amazon rainforest and popular for ecotourism. | Coffee Plantations, Tingo Maria National Park, Chanchamayo Falls, Santa Rosa de Ocopa, Monastery of Santa Rosa, Quillabamba |
| La Merced | The capital of the Chanchamayo province, popular for its pleasant climate and proximity to various natural attractions, ideal for nature lovers and tourists. | La Merced Church, Chanchamayo River, Catarata Bayoz, Catarata Tora, Parque Nacional Yanachaga-Chemillén |
| San Luis de Shuaro | A small town that serves as a hub for eco-adventures and jungle experiences, attracting adventure seekers and nature enthusiasts. | Shuaro River, Hiking Trails, Local Markets, Wildlife Watching, Biodiversity Areas |
| Perene | Known for its beautiful landscapes and biodiversity, ideal for tourists looking to explore the natural beauty of the region. | Perene River, Natural Parks, Sustainable Tourism Spots, Cultural Experiences |
| Vencedores | A growing neighborhood that offers various attractions for tourists, especially those interested in local culture and community experiences. | Local Artisan Markets, Cultural Festivals, Community Events |
| Pampa Hermosa | A charming area known for its stunning landscapes, attracting visitors who enjoy tranquility in nature. | Scenic Viewpoints, Nature Trails, Rural Tourism |
| San Ramón | A district with beautiful landscapes, home to various attractions that highlight the region's natural beauty and cultural heritage. | Catarata Santa Jerez, Hiking Trails, Coffee Tours, Natural Reserves |
| El Niccio | An up-and-coming destination that offers eco-friendly accommodations and an introduction to the region's natural wonders. | Sustainable Tourism, Wildlife Tours, Local Cuisine Experiences |
Understanding Airbnb License Requirements & STR Laws in Chanchamayo (2026)
While Chanchamayo, Junín, Peru currently shows low STR regulations, specific Airbnb license requirements might still exist or change. Always verify the latest short term rental regulations and Airbnb license requirements directly with local government authorities for Chanchamayo to ensure full compliance before hosting.
(Source: AirROI data, 2026, finding no licensed listings among those analyzed)
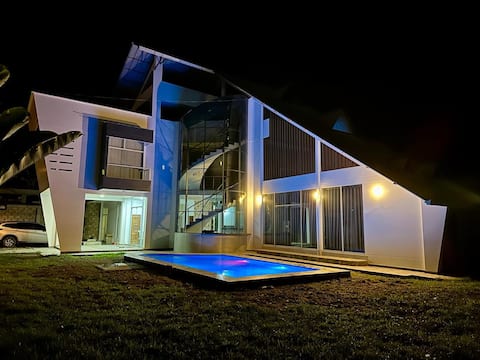
Top Performing Airbnb Properties in Chanchamayo (2026)
Benchmark your potential! Explore examples of top-performing Airbnb properties in Chanchamayobased on Trailing Twelve Month (TTM) revenue. Analyze their characteristics, revenue, occupancy rate, and ADR to understand what drives success in this market.
Accommodation House
Entire Place • 4 bedrooms
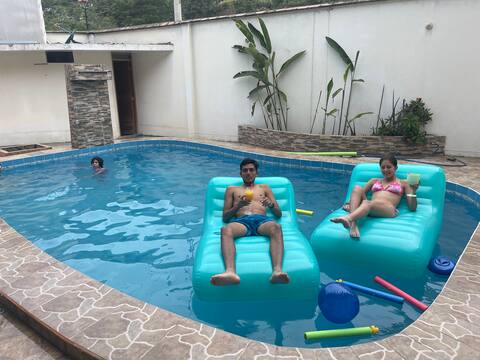
La Merced house with pool
Entire Place • 3 bedrooms
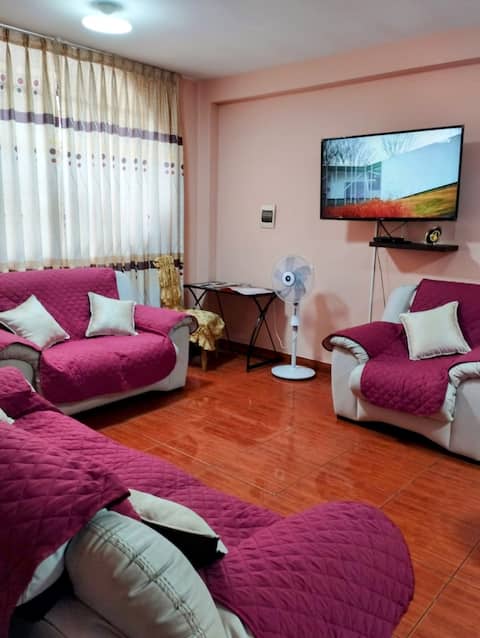
Beautiful Family Apartment in Chanchamayo!
Entire Place • 2 bedrooms

Apartment in La Merced
Entire Place • 2 bedrooms
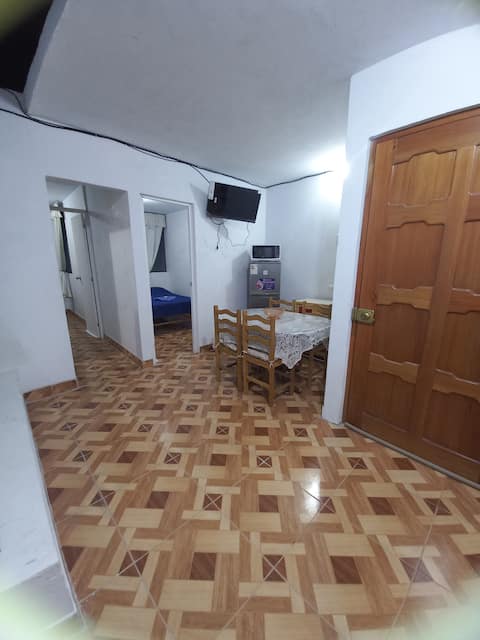
Apartment in La Merced
Entire Place • 4 bedrooms

Complete house for your unforgettable vacation.
Entire Place • 3 bedrooms
Note: Performance varies based on location, size, amenities, seasonality, and management quality. Data reflects the past 12 months.
Top Performing Airbnb Hosts in Chanchamayo (2026)
Learn from the best! This table showcases top-performing Airbnb hosts in Chanchamayo based on the number of properties managed and estimated total revenue over the past year. Analyze their scale and performance metrics.
| Host Name | Properties | Grossing Revenue | Stay Reviews | Avg Rating |
|---|---|---|---|---|
| Yosselyn | 1 | $7,036 | 9 | 4.78/5.0 |
| Casas Kaynatam Perú | 2 | $3,798 | 14 | 4.67/5.0 |
| Jayke Mireyya | 1 | $3,158 | 22 | 4.27/5.0 |
| Giorgio Morales | 1 | $2,621 | 26 | 4.85/5.0 |
| David | 2 | $2,577 | 19 | 4.92/5.0 |
| Eduardo | 1 | $2,424 | 23 | 4.78/5.0 |
| Janice | 1 | $2,359 | 8 | 5.00/5.0 |
| Maricruz | 3 | $2,153 | 23 | 4.49/5.0 |
| Mirtha | 1 | $2,078 | 58 | 4.86/5.0 |
| Paola | 1 | $2,077 | 71 | 4.96/5.0 |
Analyzing the strategies of top hosts, such as their property selection, pricing, and guest communication, can offer valuable lessons for optimizing your own Airbnb operations in Chanchamayo.
Dive Deeper: Advanced Chanchamayo STR Market Data (2026)
Ready to unlock more insights? AirROI provides access to advanced metrics and comprehensive Airbnb data for Chanchamayo. Explore detailed analytics beyond this report to refine your investment strategy, optimize pricing, and maximize your vacation rental profits.
Explore Advanced MetricsChanchamayo Short-Term Rental Market Composition (2026): Property & Room Types
Room Type Distribution
Property Type Distribution
Market Composition Insights for Chanchamayo
- The Chanchamayo Airbnb market composition is heavily skewed towards Entire Home/Apt listings, which make up 80.6% of the 31 active rentals. This indicates strong guest preference for privacy and space.
- Looking at the property type distribution in Chanchamayo, Apartment/Condo properties are the most common (45.2%), reflecting the local real estate landscape.
- Houses represent a significant 45.2% portion, catering likely to families or larger groups.
- The presence of 9.7% Hotel/Boutique listings indicates integration with traditional hospitality.
Chanchamayo Airbnb Room Capacity Analysis (2026): Bedroom Distribution
Distribution of Listings by Number of Bedrooms
Room Capacity Insights for Chanchamayo
- The dominant room capacity in Chanchamayo is 2 bedrooms listings, making up 32.3% of the market. This suggests a strong demand for properties suitable for couples or solo travelers.
- Together, 2 bedrooms and 3 bedrooms properties represent 54.9% of the active Airbnb listings in Chanchamayo, indicating a high concentration in these sizes.
- A significant 38.8% of listings offer 3+ bedrooms, catering to larger groups and families seeking more space in Chanchamayo.
Chanchamayo Vacation Rental Guest Capacity Trends (2026)
Distribution of Listings by Guest Capacity
Guest Capacity Insights for Chanchamayo
- The most common guest capacity trend in Chanchamayo vacation rentals is listings accommodating 8+ guests (29%). This suggests the primary traveler segment is likely larger groups.
- Properties designed for 8+ guests and 2 guests dominate the Chanchamayo STR market, accounting for 45.1% of listings.
- 38.7% of properties accommodate 6+ guests, serving the market segment for larger families or group travel in Chanchamayo.
- On average, properties in Chanchamayo are equipped to host 4.8 guests.
Chanchamayo Airbnb Booking Patterns (2026): Available vs. Booked Days
Available Days Distribution
Booked Days Distribution
Booking Pattern Insights for Chanchamayo
- The most common availability pattern in Chanchamayo falls within the 271-366 days range, representing 100% of listings. This suggests many properties have significant open periods on their calendars.
- Approximately 100.0% of listings show high availability (181+ days open annually), indicating potential for increased bookings or specific owner usage patterns.
- For booked days, the 1-30 days range is most frequent in Chanchamayo (61.3%), reflecting common guest stay durations or potential owner blocking patterns.
Chanchamayo Airbnb Minimum Stay Requirements Analysis
Distribution of Listings by Minimum Night Requirement
1 Night
12 listings
38.7% of total
2 Nights
15 listings
48.4% of total
4-6 Nights
1 listings
3.2% of total
30+ Nights
3 listings
9.7% of total
Key Insights
- The most prevalent minimum stay requirement in Chanchamayo is 2 Nights, adopted by 48.4% of listings. This highlights the market's preference for shorter, flexible bookings.
- A strong majority (87.1%) of the Chanchamayo Airbnb data shows acceptance of very short stays (1-2 nights), indicating a dynamic, high-turnover market.
Recommendations
- Align with the market by considering a 2 Nights minimum stay, as 48.4% of Chanchamayo hosts use this setting.
- Explore offering discounts for stays of 30+ nights to attract the 9.7% of the market seeking extended stays.
- Adjust minimum nights based on seasonality – potentially shorter during low season and longer during peak demand periods in Chanchamayo.
Chanchamayo Airbnb Cancellation Policy Trends Analysis (2026)
Limited
1 listings
3.2% of total
Flexible
17 listings
54.8% of total
Moderate
6 listings
19.4% of total
Firm
7 listings
22.6% of total
Cancellation Policy Insights for Chanchamayo
- The prevailing Airbnb cancellation policy trend in Chanchamayo is Flexible, used by 54.8% of listings.
- The market strongly favors guest-friendly terms, with 74.2% of listings offering Flexible or Moderate policies. This suggests guests in Chanchamayo may expect booking flexibility.
Recommendations for Hosts
- Consider adopting a Flexible policy to align with the 54.8% market standard in Chanchamayo.
- Given the high prevalence of Flexible policies (54.8%), offering this can enhance booking appeal, especially during shoulder seasons.
- Regularly review your cancellation policy against competitors and market demand shifts in Chanchamayo.
Chanchamayo STR Booking Lead Time Analysis (2026)
Average Booking Lead Time by Month
Booking Lead Time Insights for Chanchamayo
- The overall average booking lead time for vacation rentals in Chanchamayo is 13 days.
- Guests book furthest in advance for stays during September (average 22 days), likely coinciding with peak travel demand or local events.
- The shortest booking windows occur for stays in October (average 1 days), indicating more last-minute travel plans during this time.
- Seasonally, Summer (13 days avg.) sees the longest lead times, while Winter (8 days avg.) has the shortest, reflecting typical travel planning cycles.
Recommendations for Hosts
- Use the overall average lead time (13 days) as a baseline for your pricing and availability strategy in Chanchamayo.
- During October, focus on last-minute booking availability and promotions, as guests book with very short notice (1 days avg.).
- Target marketing efforts for the Summer season well in advance (at least 13 days) to capture early planners.
- Monitor your own booking lead times against these Chanchamayo averages to identify opportunities for dynamic pricing adjustments.
Popular & Essential Airbnb Amenities in Chanchamayo (2026)
Amenity Prevalence
Amenity Insights for Chanchamayo
- Popular amenities like Wifi, TV, Dishes and silverware are common but not universal. Offering these can provide a competitive edge.
- Warning: Wifi is not universally provided but is considered essential globally. Ensure reliable Wifi is offered.
Recommendations for Hosts
- Consider adding popular differentiators like Wifi or TV to increase appeal.
- Highlight unique or less common amenities you offer (e.g., hot tub, dedicated workspace, EV charger) in your listing description and photos.
- Regularly check competitor amenities in Chanchamayo to stay competitive.
Chanchamayo Airbnb Guest Demographics & Profile Analysis (2026)
Guest Profile Summary for Chanchamayo
- The typical guest profile for Airbnb in Chanchamayo consists of primarily domestic travelers (85%), often arriving from nearby Lima, typically belonging to the Post-2000s (Gen Z/Alpha) group (50%), primarily speaking Spanish or English.
- Domestic travelers account for 85.3% of guests.
- Key international markets include Peru (85.3%) and United States (8.8%).
- Top languages spoken are Spanish (51.6%) followed by English (35.5%).
- A significant demographic segment is the Post-2000s (Gen Z/Alpha) group, representing 50% of guests.
Recommendations for Hosts
- Target domestic marketing efforts towards travelers from Lima and Huancayo.
- Tailor amenities and listing descriptions to appeal to the dominant Post-2000s (Gen Z/Alpha) demographic (e.g., highlight fast WiFi, smart home features, local guides).
- Highlight unique local experiences or amenities relevant to the primary guest profile.
- Consider seasonal promotions aligned with peak travel times for key origin markets.
Nearby Short-Term Rental Market Comparison
How does the Chanchamayo Airbnb market stack up against its neighbors? Compare key performance metrics like average monthly revenue, ADR, and occupancy rates in surrounding areas to understand the broader regional STR landscape.
| Market | Active Properties | Monthly Revenue | Daily Rate | Avg. Occupancy |
|---|---|---|---|---|
| Ricardo Palma | 12 | $1,262 | $265.85 | 24% |
| Cieneguilla | 10 | $1,242 | $189.15 | 31% |
| Santa Cruz de Flores | 67 | $901 | $222.02 | 22% |
| Santa Eulalia | 42 | $821 | $192.27 | 20% |
| San Antonio | 115 | $723 | $204.11 | 24% |
| Mala | 132 | $695 | $201.42 | 21% |
| Quilmaná | 20 | $674 | $211.24 | 16% |
| Asia | 375 | $637 | $198.98 | 21% |
| Cerro Azul | 230 | $570 | $177.22 | 21% |
| Chilca | 40 | $527 | $175.07 | 18% |