El Carmen Airbnb Market Analysis 2026: Short Term Rental Data & Vacation Rental Statistics in Ica, Peru
Is Airbnb profitable in El Carmen in 2026? Explore comprehensive Airbnb analytics for El Carmen, Ica, Peru to uncover income potential. This 2026 STR market report for El Carmen, based on AirROI data from February 2025 to January 2026, reveals key trends in the niche market of 87 active listings.
Whether you're considering an Airbnb investment in El Carmen, optimizing your existing vacation rental, or exploring rental arbitrage opportunities, understanding the El Carmen Airbnb data is crucial. Leveraging the low regulation environment is key to maximizing your short term rental income potential. Let's dive into the specifics.
Key El Carmen Airbnb Performance Metrics Overview
Monthly Airbnb Revenue Variations & Income Potential in El Carmen (2026)
Understanding the monthly revenue variations for Airbnb listings in El Carmen is key to maximizing your short term rental income potential. Seasonality significantly impacts earnings. Our analysis, based on data from the past 12 months, shows that the peak revenue month for STRs in El Carmen is typically February, while June often presents the lowest earnings, highlighting opportunities for strategic pricing adjustments during shoulder and low seasons. Explore the typical Airbnb income in El Carmen across different performance tiers:
- Best-in-class properties (Top 10%) achieve $3,554+ monthly, often utilizing dynamic pricing and superior guest experiences.
- Strong performing properties (Top 25%) earn $2,236 or more, indicating effective management and desirable locations/amenities.
- Typical properties (Median) generate around $1,178 per month, representing the average market performance.
- Entry-level properties (Bottom 25%) see earnings around $603, often with potential for optimization.
Average Monthly Airbnb Earnings Trend in El Carmen
El Carmen Airbnb Occupancy Rate Trends (2026)
Maximize your bookings by understanding the El Carmen STR occupancy trends. Seasonal demand shifts significantly influence how often properties are booked. Typically, Februarysees the highest demand (peak season occupancy), while June experiences the lowest (low season). Effective strategies, like adjusting minimum stays or offering promotions, can boost occupancy during slower periods. Here's how different property tiers perform in El Carmen:
- Best-in-class properties (Top 10%) achieve 44%+ occupancy, indicating high desirability and potentially optimized availability.
- Strong performing properties (Top 25%) maintain 31% or higher occupancy, suggesting good market fit and guest satisfaction.
- Typical properties (Median) have an occupancy rate around 18%.
- Entry-level properties (Bottom 25%) average 9% occupancy, potentially facing higher vacancy.
Average Monthly Occupancy Rate Trend in El Carmen
Average Daily Rate (ADR) Airbnb Trends in El Carmen (2026)
Effective short term rental pricing strategy in El Carmen involves understanding monthly ADR fluctuations. The Average Daily Rate (ADR) for Airbnb in El Carmen typically peaks in December and dips lowest during August. Leveraging Airbnb dynamic pricing tools or strategies based on this seasonality can significantly boost revenue. Here's a look at the typical nightly rates achieved:
- Best-in-class properties (Top 10%) command rates of $370+ per night, often due to premium features or locations.
- Strong performing properties (Top 25%) achieve nightly rates of $302 or more.
- Typical properties (Median) charge around $229 per night.
- Entry-level properties (Bottom 25%) earn around $162 per night.
Average Daily Rate (ADR) Trend by Month in El Carmen
Get Live El Carmen Market Intelligence 👇

Explore Real-time Analytics
Airbnb Seasonality Analysis & Trends in El Carmen (2026)
Peak Season (February, January, March)
- Revenue averages $2,587 per month
- Occupancy rates average 32.9%
- Daily rates average $252
Shoulder Season
- Revenue averages $1,526 per month
- Occupancy maintains around 20.0%
- Daily rates hold near $243
Low Season (June, August, September)
- Revenue drops to average $1,029 per month
- Occupancy decreases to average 12.8%
- Daily rates adjust to average $233
Seasonality Insights for El Carmen
- The Airbnb seasonality in El Carmen shows highly seasonal trends requiring careful strategy. While the sections above show seasonal averages, it's also insightful to look at the extremes:
- During the high season, the absolute peak month showcases El Carmen's highest earning potential, with monthly revenues capable of climbing to $3,229, occupancy reaching a high of 42.7%, and ADRs peaking at $273.
- Conversely, the slowest single month of the year, typically falling within the low season, marks the market's lowest point. In this month, revenue might dip to $921, occupancy could drop to 11.2%, and ADRs may adjust down to $229.
- Understanding both the seasonal averages and these monthly peaks and troughs in revenue, occupancy, and ADR is crucial for maximizing your Airbnb profit potential in El Carmen.
Seasonal Strategies for Maximizing Profit
- Peak Season: Maximize revenue through premium pricing and potentially longer minimum stays. Ensure high availability.
- Low Season: Offer competitive pricing, special promotions (e.g., extended stay discounts), and flexible cancellation policies. Target off-season travelers like remote workers or budget-conscious guests.
- Shoulder Seasons: Implement dynamic pricing that balances peak and low rates. Target weekend travelers or specific events. Offer slightly more flexible terms than peak season.
- Regularly analyze your own performance against these El Carmen seasonality benchmarks and adjust your pricing and availability strategy accordingly.
Best Areas for Airbnb Investment in El Carmen (2026)
Exploring the top neighborhoods for short-term rentals in El Carmen? This section highlights key areas, outlining why they are attractive for hosts and guests, along with notable local attractions. Consider these locations based on your target guest profile and investment strategy.
| Neighborhood / Area | Why Host Here? (Target Guests & Appeal) | Key Attractions & Landmarks |
|---|---|---|
| Plaza de Armas | The central square of El Carmen, surrounded by beautiful colonial architecture and local markets. A hub of cultural activities and a must-visit for tourists looking to experience the local community. | Plaza de Armas, Historic churches, Local artisan markets, Museums, Local food stalls |
| Laguna Morón | A beautiful lagoon nearby that offers opportunities for nature activities such as kayaking and bird watching. Ideal for tourists looking to escape the city and enjoy tranquility and nature. | Laguna Morón, Bird watching tours, Kayaking, Picnic spots, Nature trails |
| Ica Wine Region | Famous for its vineyards and wineries, attracting tourists interested in wine tasting and vineyard tours. A perfect location for those looking to explore the local wine culture. | Tacama Winery, El Catador Winery, Ica Wine Museum, Wine tasting experiences |
| Huacachina | A stunning oasis and a popular tourist destination for adventure sports such as sandboarding and dune buggy rides. Attracts both thrill-seekers and those looking for a picturesque setting. | Huacachina Oasis, Sandboarding, Dune buggy rides, ATV tours, Restaurants with lagoon views |
| Local Markets | A vibrant area filled with markets that showcase local handicrafts, food, and cultural products. Great for tourists wanting to experience authentic local culture. | Local artisan markets, Food stalls, Cultural events, Local crafts |
| Museum of Ica | A cultural hub that provides insight into the history and heritage of Ica and the Nazca culture. Attracts history buffs and tourists interested in educational experiences. | Museum of Ica, Nazca lines exhibits, Archaeological artifacts, Guided tours |
| Natural Reserve of Paracas | Just a short drive from El Carmen, this reserve offers stunning coastal scenery and diverse wildlife. Popular for eco-tourism and nature enthusiasts. | Paracas National Reserve, Boat tours to the Ballestas Islands, Wildlife viewing, Beautiful beaches, Nature hikes |
| Ica Plaza de Armas | The main square of Ica city, bustling with life and surrounded by restaurants and shops. It's a great place for tourists to relax and enjoy local cuisine. | Ica Plaza de Armas, Local restaurants, Shops and cafes, Cultural events, Street performances |
Understanding Airbnb License Requirements & STR Laws in El Carmen (2026)
While El Carmen, Ica, Peru currently shows low STR regulations, specific Airbnb license requirements might still exist or change. Always verify the latest short term rental regulations and Airbnb license requirements directly with local government authorities for El Carmen to ensure full compliance before hosting.
(Source: AirROI data, 2026, finding no licensed listings among those analyzed)
Top Performing Airbnb Properties in El Carmen (2026)
Benchmark your potential! Explore examples of top-performing Airbnb properties in El Carmenbased on Trailing Twelve Month (TTM) revenue. Analyze their characteristics, revenue, occupancy rate, and ADR to understand what drives success in this market.

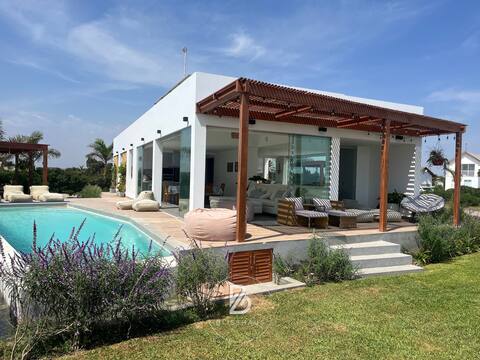
Casa Ferrara: countryside and beach in Chincha
Entire Place • 4 bedrooms
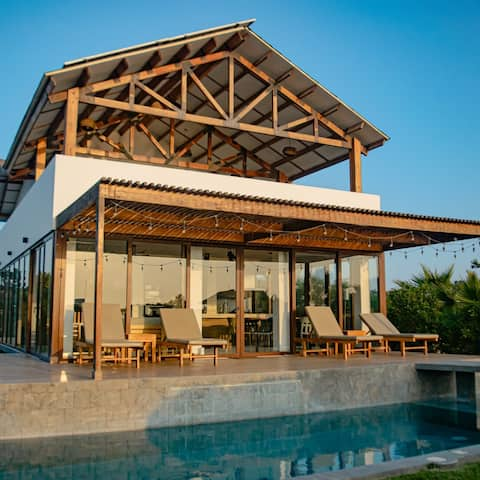
Blisshaus - Sahana Beach House
Entire Place • 4 bedrooms
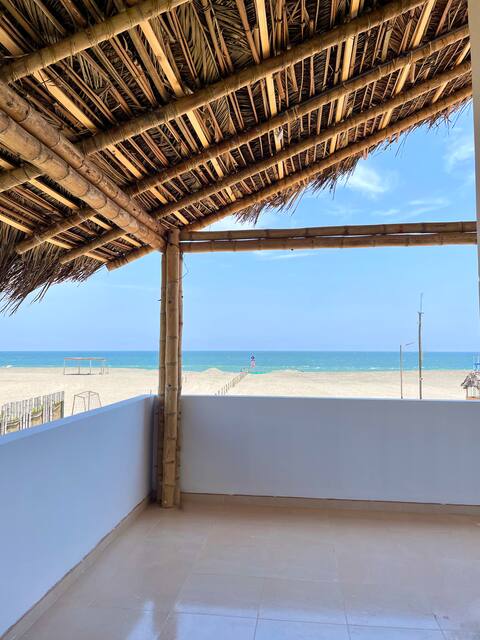
HOP BALI: Lagoon & Beach Escape in Chincha
Entire Place • 6 bedrooms
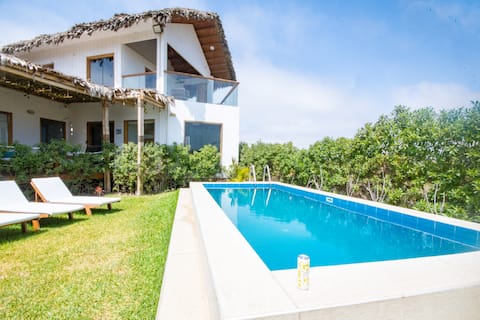
Puntarena® Oceanfront w/Pool near Paracas
Entire Place • 7 bedrooms

Country house with pool, bonfire and pet-friendly
Entire Place • 5 bedrooms
Casa Franco - Beach and Countryside
Entire Place • 5 bedrooms
Note: Performance varies based on location, size, amenities, seasonality, and management quality. Data reflects the past 12 months.
Top Performing Airbnb Hosts in El Carmen (2026)
Learn from the best! This table showcases top-performing Airbnb hosts in El Carmen based on the number of properties managed and estimated total revenue over the past year. Analyze their scale and performance metrics.
| Host Name | Properties | Grossing Revenue | Stay Reviews | Avg Rating |
|---|---|---|---|---|
| Hops | 10 | $127,019 | 76 | 4.54/5.0 |
| Puntarena | 2 | $60,397 | 35 | 4.81/5.0 |
| Mariella | 1 | $58,557 | 54 | 5.00/5.0 |
| Beach Homes Peru | 6 | $55,994 | 288 | 4.79/5.0 |
| Carlo | 1 | $53,195 | 23 | 5.00/5.0 |
| Gabriela | 1 | $38,941 | 78 | 4.97/5.0 |
| Jorge Tomas | 1 | $34,019 | 3 | 5.00/5.0 |
| Giannina | 1 | $33,788 | 11 | 4.82/5.0 |
| Angella | 1 | $32,653 | 63 | 4.92/5.0 |
| Roxana | 1 | $31,784 | 24 | 4.75/5.0 |
Analyzing the strategies of top hosts, such as their property selection, pricing, and guest communication, can offer valuable lessons for optimizing your own Airbnb operations in El Carmen.
Dive Deeper: Advanced El Carmen STR Market Data (2026)
Ready to unlock more insights? AirROI provides access to advanced metrics and comprehensive Airbnb data for El Carmen. Explore detailed analytics beyond this report to refine your investment strategy, optimize pricing, and maximize your vacation rental profits.
Explore Advanced MetricsEl Carmen Short-Term Rental Market Composition (2026): Property & Room Types
Room Type Distribution
Property Type Distribution
Market Composition Insights for El Carmen
- The El Carmen Airbnb market composition is heavily skewed towards Entire Home/Apt listings, which make up 98.9% of the 87 active rentals. This indicates strong guest preference for privacy and space.
- Looking at the property type distribution in El Carmen, House properties are the most common (94.3%), reflecting the local real estate landscape.
- Houses represent a significant 94.3% portion, catering likely to families or larger groups.
- Smaller segments like hotel/boutique, outdoor/unique, others (combined 5.7%) offer potential for unique stay experiences.
El Carmen Airbnb Room Capacity Analysis (2026): Bedroom Distribution
Distribution of Listings by Number of Bedrooms
Room Capacity Insights for El Carmen
- The dominant room capacity in El Carmen is 4 bedrooms listings, making up 32.2% of the market. This suggests a strong demand for properties suitable for families or small groups.
- Together, 4 bedrooms and 5+ bedrooms properties represent 64.4% of the active Airbnb listings in El Carmen, indicating a high concentration in these sizes.
- A significant 81.6% of listings offer 3+ bedrooms, catering to larger groups and families seeking more space in El Carmen.
El Carmen Vacation Rental Guest Capacity Trends (2026)
Distribution of Listings by Guest Capacity
Guest Capacity Insights for El Carmen
- The most common guest capacity trend in El Carmen vacation rentals is listings accommodating 8+ guests (83.9%). This suggests the primary traveler segment is likely larger groups.
- Properties designed for 8+ guests and 6 guests dominate the El Carmen STR market, accounting for 88.5% of listings.
- 93.1% of properties accommodate 6+ guests, serving the market segment for larger families or group travel in El Carmen.
- On average, properties in El Carmen are equipped to host 7.6 guests.
El Carmen Airbnb Booking Patterns (2026): Available vs. Booked Days
Available Days Distribution
Booked Days Distribution
Booking Pattern Insights for El Carmen
- The most common availability pattern in El Carmen falls within the 271-366 days range, representing 87.4% of listings. This suggests many properties have significant open periods on their calendars.
- Approximately 100.0% of listings show high availability (181+ days open annually), indicating potential for increased bookings or specific owner usage patterns.
- For booked days, the 31-90 days range is most frequent in El Carmen (48.3%), reflecting common guest stay durations or potential owner blocking patterns.
El Carmen Airbnb Minimum Stay Requirements Analysis
Distribution of Listings by Minimum Night Requirement
1 Night
17 listings
19.5% of total
2 Nights
40 listings
46% of total
3 Nights
5 listings
5.7% of total
30+ Nights
25 listings
28.7% of total
Key Insights
- The most prevalent minimum stay requirement in El Carmen is 2 Nights, adopted by 46% of listings. This highlights the market's preference for shorter, flexible bookings.
- A strong majority (65.5%) of the El Carmen Airbnb data shows acceptance of very short stays (1-2 nights), indicating a dynamic, high-turnover market.
- A significant segment (28.7%) caters to monthly stays (30+ nights) in El Carmen, pointing to opportunities in the extended-stay market.
Recommendations
- Align with the market by considering a 2 Nights minimum stay, as 46% of El Carmen hosts use this setting.
- If feasible, allowing 1-night stays, especially midweek or during low season, could capture last-minute bookings, as only 19.5% currently do.
- A 2-night minimum appears standard (46%). Consider this for weekends or peak periods.
- Explore offering discounts for stays of 30+ nights to attract the 28.7% of the market seeking extended stays.
- Adjust minimum nights based on seasonality – potentially shorter during low season and longer during peak demand periods in El Carmen.
El Carmen Airbnb Cancellation Policy Trends Analysis (2026)
Limited
1 listings
1.2% of total
Flexible
18 listings
20.9% of total
Moderate
28 listings
32.6% of total
Firm
33 listings
38.4% of total
Strict
6 listings
7% of total
Cancellation Policy Insights for El Carmen
- The prevailing Airbnb cancellation policy trend in El Carmen is Firm, used by 38.4% of listings.
- There's a relatively balanced mix between guest-friendly (53.5%) and stricter (45.4%) policies, offering choices for different guest needs.
- Strict cancellation policies are quite rare (7%), potentially making listings with this policy less competitive unless justified by high demand or property type.
Recommendations for Hosts
- Consider adopting a Firm policy to align with the 38.4% market standard in El Carmen.
- Using a Strict policy might deter some guests, as only 7% of listings use it. Evaluate if potential revenue protection outweighs possible lower booking rates.
- Regularly review your cancellation policy against competitors and market demand shifts in El Carmen.
El Carmen STR Booking Lead Time Analysis (2026)
Average Booking Lead Time by Month
Booking Lead Time Insights for El Carmen
- The overall average booking lead time for vacation rentals in El Carmen is 19 days.
- Guests book furthest in advance for stays during December (average 37 days), likely coinciding with peak travel demand or local events.
- The shortest booking windows occur for stays in September (average 9 days), indicating more last-minute travel plans during this time.
- Seasonally, Winter (27 days avg.) sees the longest lead times, while Summer (12 days avg.) has the shortest, reflecting typical travel planning cycles.
Recommendations for Hosts
- Use the overall average lead time (19 days) as a baseline for your pricing and availability strategy in El Carmen.
- For December stays, consider implementing length-of-stay discounts or slightly higher rates for bookings made less than 37 days out to capitalize on advance planning.
- During September, focus on last-minute booking availability and promotions, as guests book with very short notice (9 days avg.).
- Target marketing efforts for the Winter season well in advance (at least 27 days) to capture early planners.
- Monitor your own booking lead times against these El Carmen averages to identify opportunities for dynamic pricing adjustments.
Popular & Essential Airbnb Amenities in El Carmen (2026)
Amenity Prevalence
Amenity Insights for El Carmen
- Essential amenities in El Carmen that guests expect include: Free parking on premises, BBQ grill, Kitchen. Lacking these (any) could significantly impact bookings.
- Popular amenities like Wifi, Pool, Dishes and silverware are common but not universal. Offering these can provide a competitive edge.
- A pool is a highly desired but not standard amenity, making it a key feature for attracting guests seeking leisure in El Carmen.
- Warning: Wifi is not universally provided but is considered essential globally. Ensure reliable Wifi is offered.
Recommendations for Hosts
- Ensure your listing includes all essential amenities for El Carmen: Free parking on premises, BBQ grill, Kitchen.
- Prioritize adding missing essentials: Free parking on premises, BBQ grill, Kitchen.
- Consider adding popular differentiators like Wifi or Pool to increase appeal.
- Highlight unique or less common amenities you offer (e.g., hot tub, dedicated workspace, EV charger) in your listing description and photos.
- Regularly check competitor amenities in El Carmen to stay competitive.
El Carmen Airbnb Guest Demographics & Profile Analysis (2026)
Guest Profile Summary for El Carmen
- The typical guest profile for Airbnb in El Carmen consists of primarily domestic travelers (87%), often arriving from nearby Lima, typically belonging to the Post-2000s (Gen Z/Alpha) group (50%), primarily speaking Spanish or English.
- Domestic travelers account for 87.1% of guests.
- Key international markets include Peru (87.1%) and United States (3.8%).
- Top languages spoken are Spanish (51.5%) followed by English (33.1%).
- A significant demographic segment is the Post-2000s (Gen Z/Alpha) group, representing 50% of guests.
Recommendations for Hosts
- Target domestic marketing efforts towards travelers from Lima and Lima Region.
- Tailor amenities and listing descriptions to appeal to the dominant Post-2000s (Gen Z/Alpha) demographic (e.g., highlight fast WiFi, smart home features, local guides).
- Highlight unique local experiences or amenities relevant to the primary guest profile.
- Consider seasonal promotions aligned with peak travel times for key origin markets.
Nearby Short-Term Rental Market Comparison
How does the El Carmen Airbnb market stack up against its neighbors? Compare key performance metrics like average monthly revenue, ADR, and occupancy rates in surrounding areas to understand the broader regional STR landscape.
| Market | Active Properties | Monthly Revenue | Daily Rate | Avg. Occupancy |
|---|---|---|---|---|
| Tambo de Mora | 12 | $1,613 | $224.45 | 29% |
| Cieneguilla | 10 | $1,242 | $189.15 | 31% |
| Chincha Baja | 45 | $1,097 | $225.32 | 23% |
| Santa Cruz de Flores | 67 | $901 | $222.02 | 22% |
| Paracas | 305 | $785 | $161.55 | 22% |
| Salas | 18 | $750 | $171.35 | 22% |
| San Antonio | 115 | $723 | $204.11 | 24% |
| Mala | 132 | $695 | $201.42 | 21% |
| Quilmaná | 20 | $674 | $211.24 | 16% |
| Asia | 375 | $637 | $198.98 | 21% |